Wireless electrochemical measurement of kanamycin in whole blood
Jun-Chau Chien, Alexandra E. Rangel, Hyongsok T. Soh
Abstract
This work evaluates the life-time of the structural-switching aptamer sensors in the whole blood using in vitro blood circulation setup as the first step toward implantable usage. The device consists of a 3-electrode sensing probe with the tip of the working electrode (WE) functionalized with the antibiotics aptamers. Square-wave voltammetry (SWV) is used to continuously track both the signal peak and the background current at 5 sec temporal resolution. The sensing probe features a diameter of 800um and is inserted through a 18G catheter. Two samples of whole blood (EDTA treated), spiked with either 500uM kanamycin or SSC 1x (salin sodium citrate) buffer, are alternated toward the sensor to evaluate the degradation of the aptamer sensivitiy and the degree of drift.
Before start
Steps
Aptamer sensor probe overview
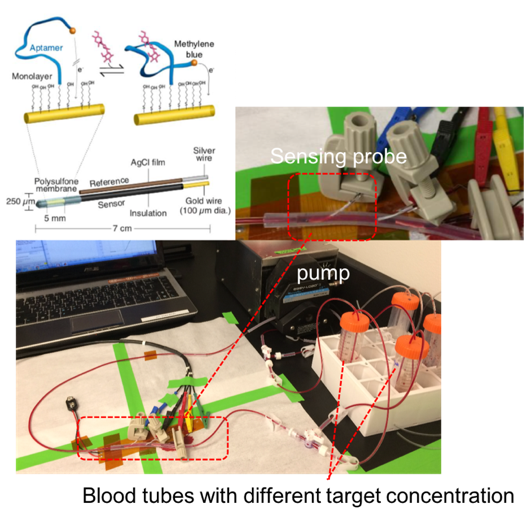
The aptamer-immobilized sensing probe will be approximately 6 ~ 10 cm in length and ~1mm in diameter in order to fit into the 18G catheter. The sensing probe consists of 3 wires:
(1) A working electrode (WE) made of a gold wire (Au, Alfa Aesar Inc.) with its tip functionalized with aptamers at approximately 2 mm in length, as defined by the heat shrink tubing (McMaster Carr Inc.). The diameter of the gold wire is approximately 250um.
(2) A reference electrode (RE) made of silver chloride (AgCl, A-M Systems) with a diameter approximately 100 um (by immersing silver wires in bleach overnight).
(3) A counter electrode (CE) made of platinum (Pt, A-M Systems).
Aptamer Immobilization
Use heat-shrink and bare gold wire (250 um) to define the sensing area at the wire tip.
Solvent clean with sonication in acetone, methanol, and DI-water.
Perform electrochemical cleaning using 3-wire electrochemical system
a. 3 CV cycles in 200mM EC4 H2SO4
b. 3 CV cycles in 50mM EC3 H2SO4
CV parameters: -0.4V ~ 1.5V, step = 0.001V, rate = 0.001V/sec
Prepare 100 micromolar stock of kanamycin aptamer (5'-HS-(CH2)6-GGGACTTGGTTTAGGTAATGAGTCCC-(CH2)7-NH-MB-3’). Aptamer is functionalized with a thiol and methylene blue on the 5' and 3' termini respectively.
Prepare fresh TCEP solution at a concentration of 28.7 mg/mL in water.
Pipette 2µL TCEP solution in to an aptamer aliquot (1µLat 100 micromolar concentration, stored at -20°C upon receiving in dry format) and incubate for 0h 40m 0s in dark conditions.
Add 97µL of 1X SSC buffer into the aliquot after 0h 40m 0s time period.
Immerse the gold wire into the TCEP-aptamer-SSC solution, incubate for 1h 0m 0s in dark conditions.
After 1h 0m 0s take out the gold wire, rinse with DI-water for 0h 1m 0s and immerse in DI-water for 0h 2m 0s
Prepare C6-solution: 1.245mL of DI-water + 1µL of C6 solution.
Immerse the gold wire into the C6-solution, incubate for 2h 0m 0s.
After 2 hours, rinse the gold wire with DI-water for 0h 1m 0s, and immerse in DI-water for 0h 2m 0s.
Store the gold wire in 1X SSC buffer at 4°C overnight (24h 0m 0s) to stabilize the formation of the self-assembly monolayer (SAM).
Aptamer real-time sensor measurement
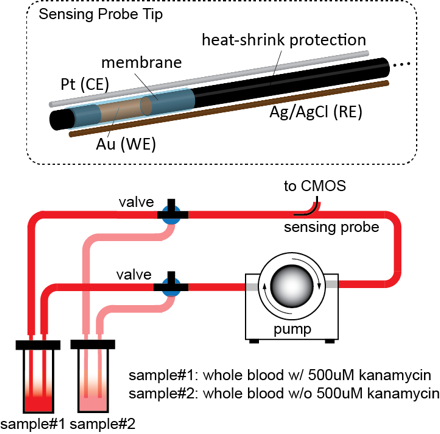
Blood circulation loop (Figure 1 and Figure 2) is created with pump and tubing to emulate actual condition.


Human whole blood sample (9mL, stored at4°C upon receiving) is split into two separate reservoir, each with 4.5mL. In the first reservoir, 0.5mLof 5mM kanamycin in SSC buffer is added. The final concentration is therefore 500uM. In the second reservoir, 0.5mL of SSC buffer without kanamycin is added. Each reservoir has two opening for connecting to the two ports of the circulation loop.
Insert the sensing probe and connect to the electronics.
After the insertion of the aptamer probe, the pump is activated to circulate the blood. A 0h 30m 0s stabilization period is needed. During this period, the potential are swept based on the parameters below.
| A | B | C | D | E | F | G |
|---|---|---|---|---|---|---|
| SWV frequency | # of steps | Potential step size | Start potential | End potential | SWV amplitude | |
| 1st SWV sweep | 400 Hz | 400 | 1mV | -0.4 V | 0 V | 36 mV |
| 2ndSWV sweep | 60 Hz | 80 | 5mV | -0.4 V | 0 V | 36 mV |
PalmSense software is used to perform square-wave voltammetry (SWV) continuously. The parameters are listed below. Two SWV sweeps are performed sequentially at two different frequencies. The results are subtracted to mitigate the drift.
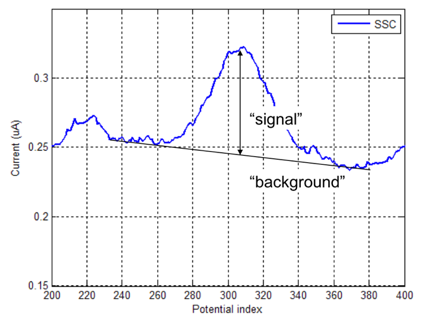
After each sweep, the measured current is stored in .CSV file. The results are post-processed in Matlab to extract: (1) background current, and (2) signal current, as shown in Figure 3.

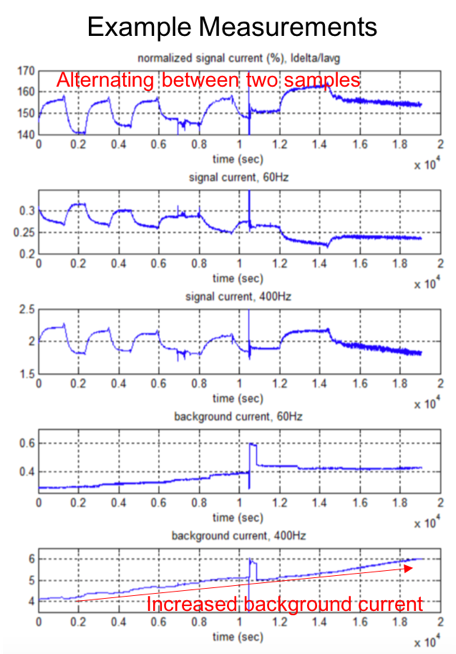
After 30-min stabilization period, the two samples are alternated using valves. Due to difference in the antibiotics concentration, the measurements resemble a square wave. The rise and fall time indicates the achievable temporal resolution, which is currently governed by the diffusion rate of the target across the porous membrane. Figure 4 shows an example of the measured results


