VTEA - a tool for 3D tissue cytometry: 7-Click Analysis
Tarek M. El-Achkar, Daria Barwinska, Seth Winfree
Disclaimer
Abstract
VTEA is a tool for 3D tissue cytometry (3DTC) of large 3D fluorescence light microscopy image volumes ranging from 50-100s of microns thick. The objective was to unify image processing, segmentation, data exploration and analysis in one package.
VTEA is a tool that is…
…free and easy to get. It utilizes ImageJ/Fiji as the distribution platform. .
...easy to use. VTEA is designed to organize the most common workflow in 3DTC inclusive of image processing (to manage imaging artifacts), segmentation (extensible to bring in multiple approaches into a common framework of analysis) and exploration and analysis with flow cytometry like plots, gating, mapping to image with ROI gating and tools for high dimensionality data.
…compatible with mesoscale 3D analysis. VTEA is built to handle massive datasets and to operate seamlessly on an embedded database to enable analysis of 100’s of thousands of cells and will incorporate tools for clustering and dimensionality reduction.
…built around referencing the original image. The power of 3DTC in VTEA enables the localization of identified cells in the analysis space in the original image, in situ , and in 3D.
Before start
VTEA runs as a FIJI (ImageJ) plugin.
Once VTEA is installed, the VTEA menu will appear on top of the FIJI menu strip.
Steps
Select the VTEA menu (Click #1) and then "VTEA 1.1.6" (Click #2) . The version number will change with ongoing updates.

If no images are open in FIJI/ImageJ, use the open image button (Click #3) . This will open up a standard FIJI open image file menu and automatically load an image into the VTEA workflow.

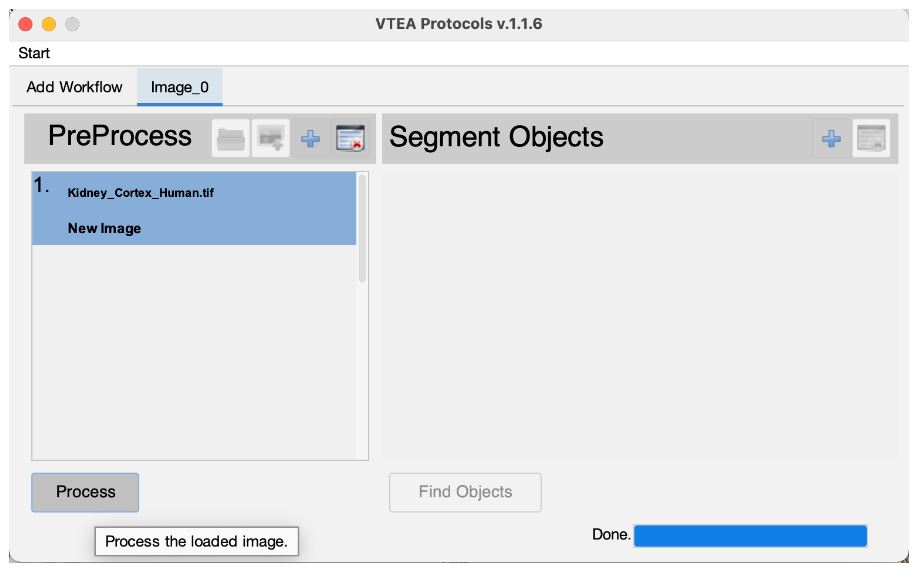
If the image quality is sufficient for segmentation, preprocessing can be skipped by selecting "Process" button (Click #4) . A separate sketch describes image processing and VTEA's functionality including combining image processing steps and previewing.
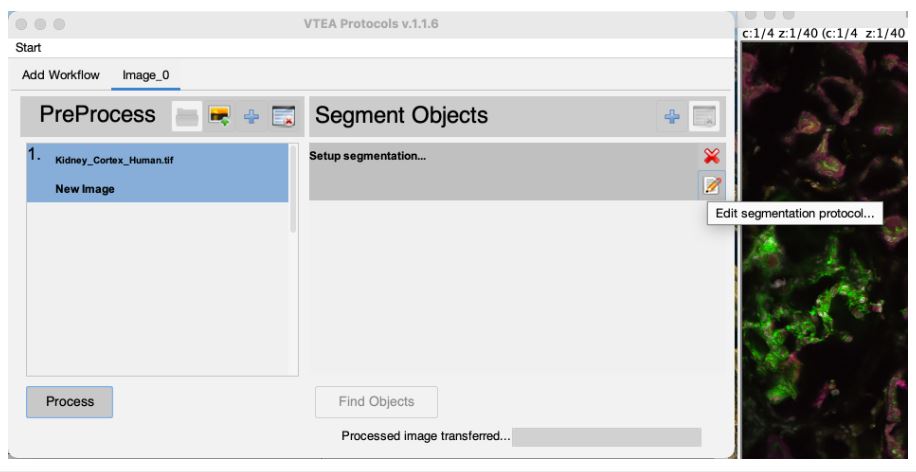
The processed image is automatically moved to the segmentation setup after the image processing steps are completed. An image is also generated by the image processing steps that may be closed. The original image can also be closed at this time. Select the edit settings button (Click #5) , to set and adjust the segmentation settings.
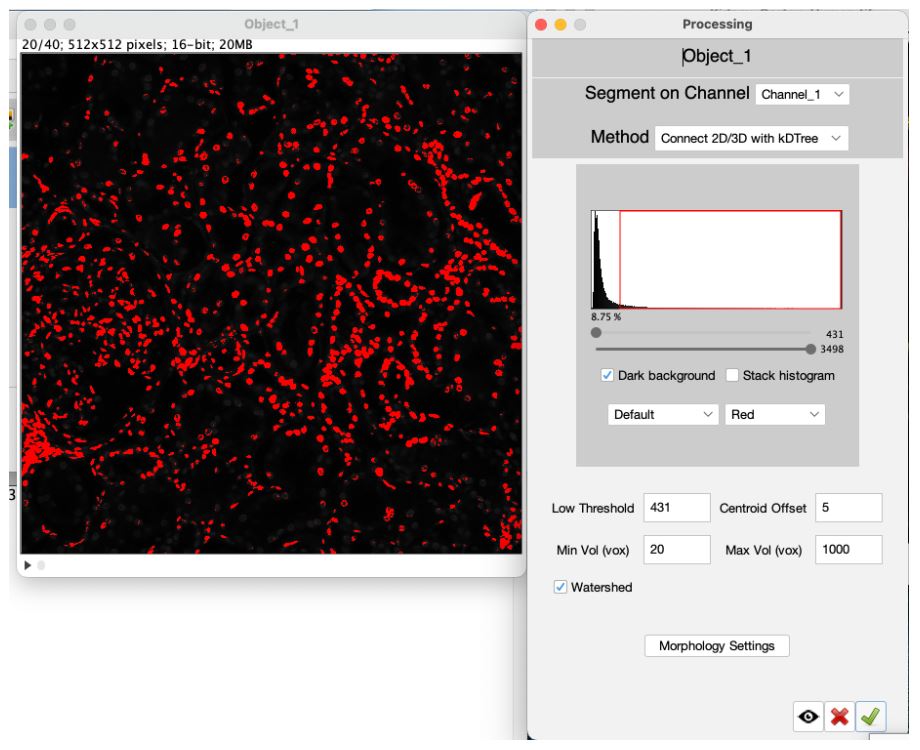
Two windows are used to setup segementation in VTEA, the settings window and, if applicable, a threshold preview. Segementation can be previewed by drawing an ROI on the threshold preview and selecting the "eye" button.
To continue close the setup window by clicking on the green checkmark button (Click #6) . To start the segmentation select the "Find Objects" button, (Click #7) .
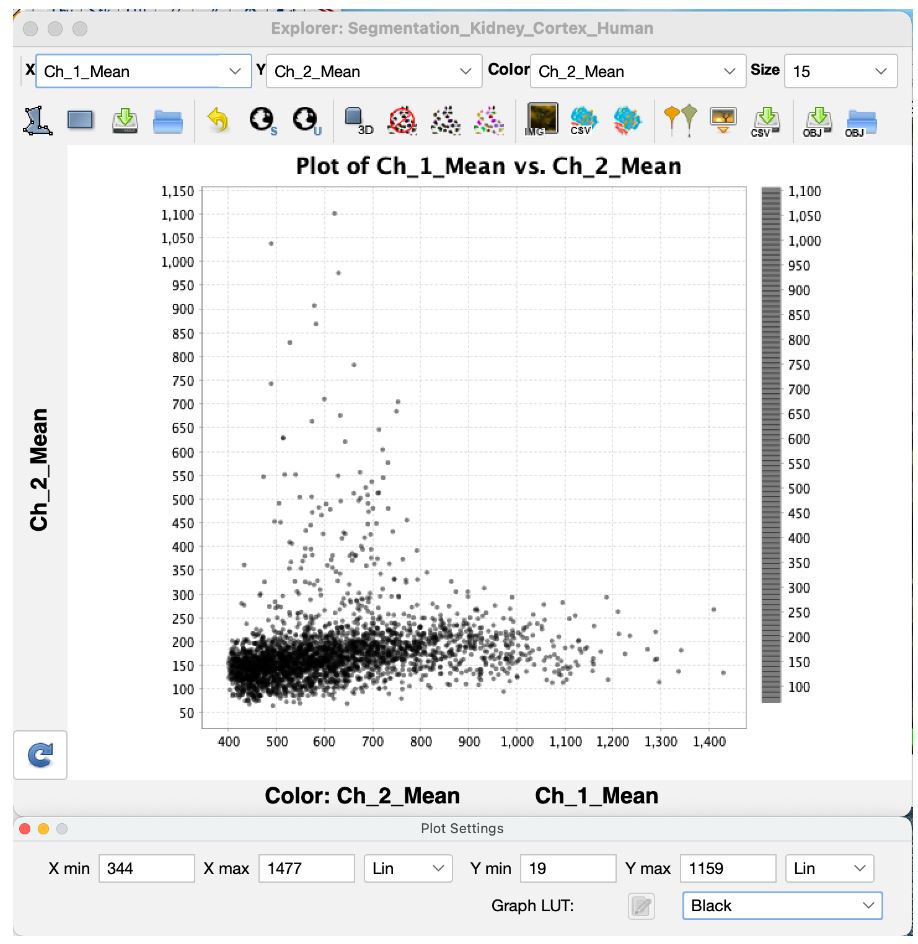
Once the segmentation is completed, VTEA's MicroExplorer window opens with a scatter plot of the processed data.
In this scatter plot every dot represents a segmented cell. Where the dot is plotted is dependent upon the measured features plotted on the two axes and set by the drop-down menus for X, Y and Color respectively.