Using the Reactome Database
Karen Rothfels, Karen Rothfels, Marija Milacic, Marija Milacic, Lisa Matthews, Lisa Matthews, Robin Haw, Robin Haw, Cristoffer Sevilla, Cristoffer Sevilla, Marc Gillespie, Marc Gillespie, Ralf Stephan, Ralf Stephan, Chuqiao Gong, Chuqiao Gong, Eliot Ragueneau, Eliot Ragueneau, Bruce May, Bruce May, Veronica Shamovsky, Veronica Shamovsky, Adam Wright, Joel Weiser, Deidre Beavers, Patrick Conley, Krishna Tiwari, Bijay Jassal, Johannes Griss, Andrea Senff-Ribeiro, Timothy Brunson, Robert Petryszak, Henning Hermjakob, Peter D'Eustachio, Guanming Wu, Lincoln Stein
Abstract
Pathway databases provide descriptions of the roles of proteins, nucleic acids, lipids, carbohydrates, and other molecular entities within their biological cellular contexts. Pathway-centric views of these roles may allow for the discovery of unexpected functional relationships in data such as gene expression profiles and somatic mutation catalogues from tumor cells. For this reason, there is a high demand for high-quality pathway databases and their associated tools. The Reactome project (a collaboration between the Ontario Institute for Cancer Research, New York University Langone Health, the European Bioinformatics Institute, and Oregon Health & Science University) is one such pathway database. Reactome collects detailed information on biological pathways and processes in humans from the primary literature. Reactome content is manually curated, expert-authored, and peer-reviewed and spans the gamut from simple intermediate metabolism to signaling pathways and complex cellular events. This information is supplemented with likely orthologous molecular reactions in mouse, rat, zebrafish, worm, and other model organisms. © 2023 The Authors. Current Protocols published by Wiley Periodicals LLC.
Basic Protocol 1 : Browsing a Reactome pathway
Basic Protocol 2 : Exploring Reactome annotations of disease and drugs
Basic Protocol 3 : Finding the pathways involving a gene or protein
Alternate Protocol 1 : Finding the pathways involving a gene or protein using UniProtKB (SwissProt), Ensembl, or Entrez gene identifier
Alternate Protocol 2 : Using advanced search
Basic Protocol 4 : Using the Reactome pathway analysis tool to identify statistically overrepresented pathways
Basic Protocol 5 : Using the Reactome pathway analysis tool to overlay expression data onto Reactome pathway diagrams
Basic Protocol 6 : Comparing inferred model organism and human pathways using the Species Comparison tool
Basic Protocol 7 : Comparing tissue-specific expression using the Tissue Distribution tool
INTRODUCTION
The availability of whole genome sequences from numerous species coupled with an explosion of techniques for querying and analyzing these reference genomes, including at a single cell level, has led to a high demand for sophisticated tools to facilitate visualization and interpretation of the resulting large data sets. Biological pathway databases are uniquely positioned to play a key role in the interpretation of such data sets. Pathway databases capture what is already known about the interplay of genes, proteins, and small molecules using a data model that is accessible to computation, and position experimental outcomes on proteins or other biological molecules in their relevant cellular context. For example, a perturbation experiment that changes the expression pattern of thousands of genes may only affect the expression patterns of a small handful of biochemical pathways. Pathway analysis has the potential to reveal unexpected connections between disparate areas of biology that are not readily apparent by simple inspection. Hence, there is a high degree of interest in the bioinformatics community in creating pathway databases. The Reactome project, covered in this article, is one such database. It is a curated collection of well-documented human molecular reactions grouped into pathways that span the gamut from simple intermediary metabolism (e.g., sugar catabolism) to complex cellular events such as the mitotic cell cycle. Reactome annotations also document how normal biological pathways are affected during disease, and the effects of drugs on pathway activities. Reactome annotations are manually curated by PhD level scientists and peer-reviewed by experts in the field prior to being published in the database. A semi-automated procedure supplements this manually curated information by identifying likely orthologous molecular reactions in mouse, rat, zebrafish, worm, and other model organisms, extending the use of the database to support research in other species.
The protocols in this article illustrate how to use Reactome to learn the steps of a biological pathway and how a suite of data analysis tools can assist with the interpretation of user-supplied experimental data sets. Basic Protocol 1 describes how to navigate and browse through the Reactome database. Basic Protocol 2 describes how to navigate and browse through the drug and disease annotations of Reactome. Basic Protocol 3 and Alternate Protocol 1 explain how to identify the pathways in which a molecule of interest is involved using either the common name or accession number, respectively. Alternate Protocol 2 describes how to use the Advanced Search Feature. Basic Protocol 4 details how to use Pathway Analysis to perform identifier mapping and overrepresentation analysis. Basic Protocol 5 explains how to overlay pathway diagrams with expression data. Basic Protocol 6 describes the use of the Species Comparison tool to compare model organisms and human pathways. Basic Protocol 7 describes how to compare expression in different tissues using the Tissue Distribution tool.
NOTE : This information is based on Reactome in December 2022. Some of the web pages may have changed somewhat since the article was written.
Basic Protocol 1: BROWSING A REACTOME PATHWAY
This protocol will introduce the basic navigational techniques needed to browse the Reactome Web site.
Necessary Resources
Hardware
- Computer capable of supporting a Web browser and an Internet connection
Software
- Any modern Web browser such as Firefox, Safari, and Chrome will work to display Reactome Web pages
1.Point the browser to the Reactome home page at https://reactome.org.
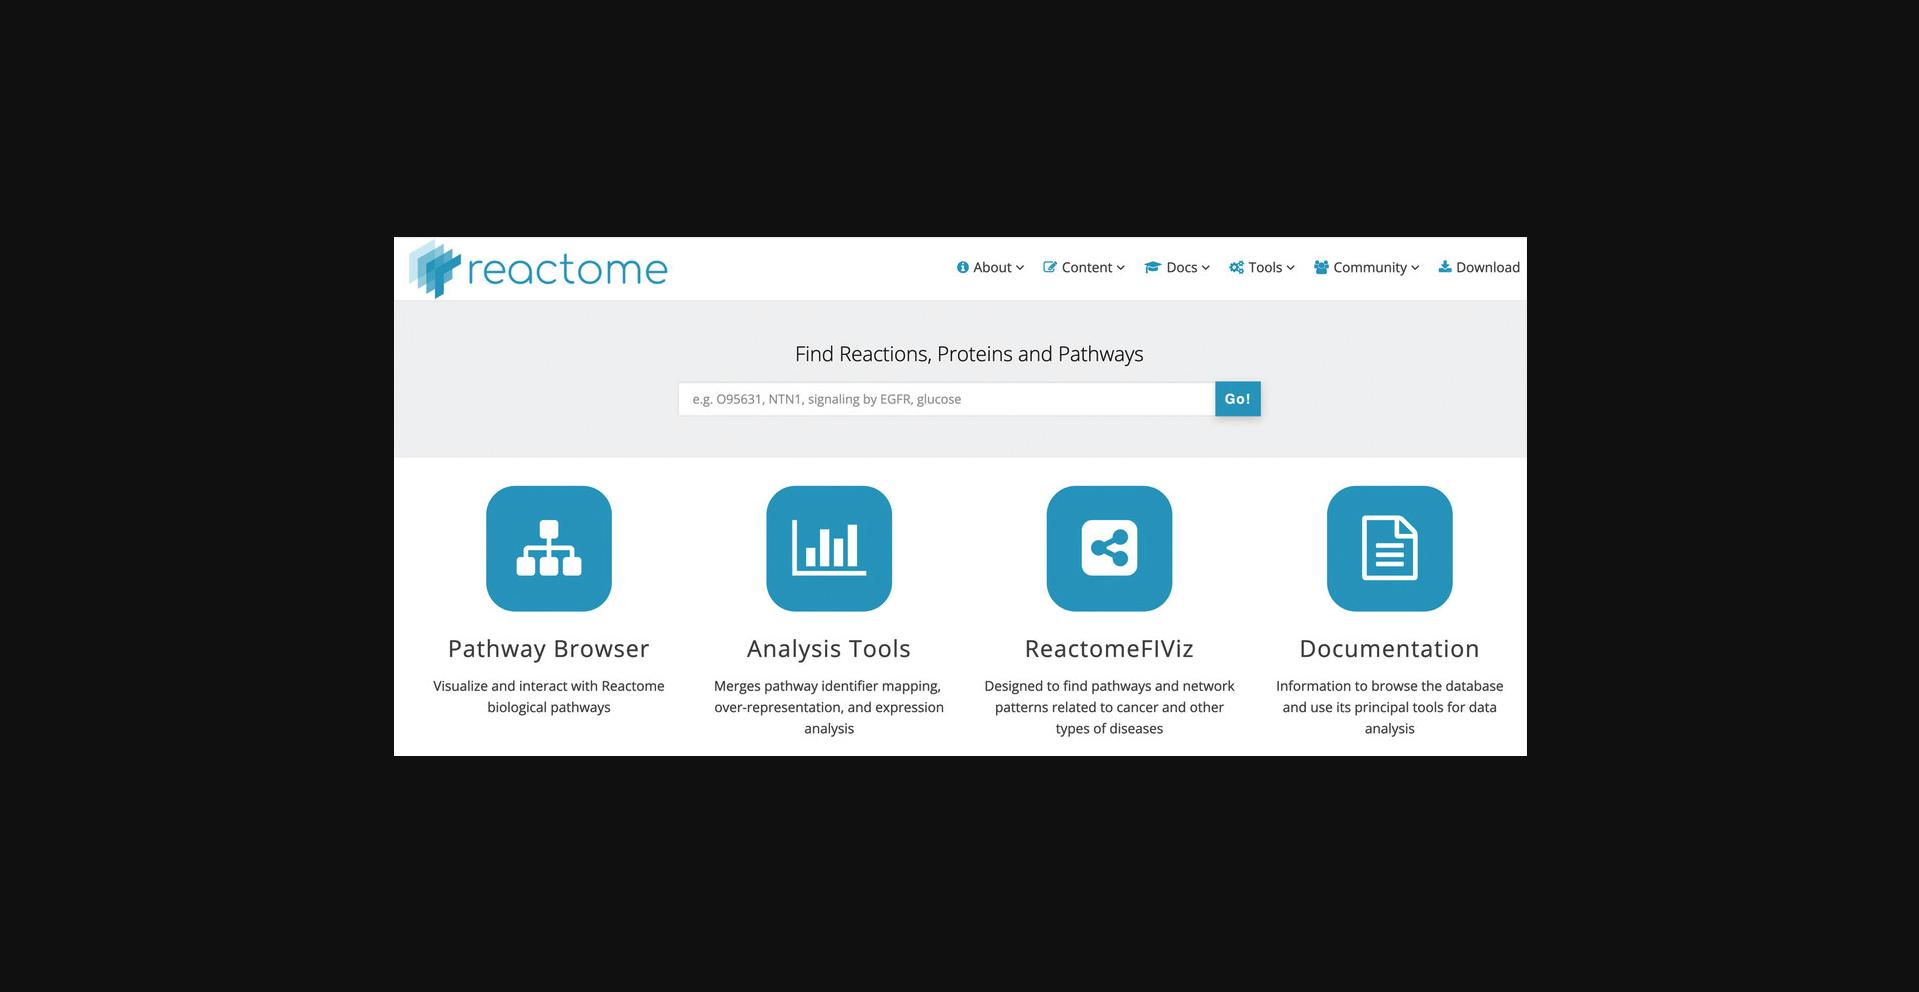
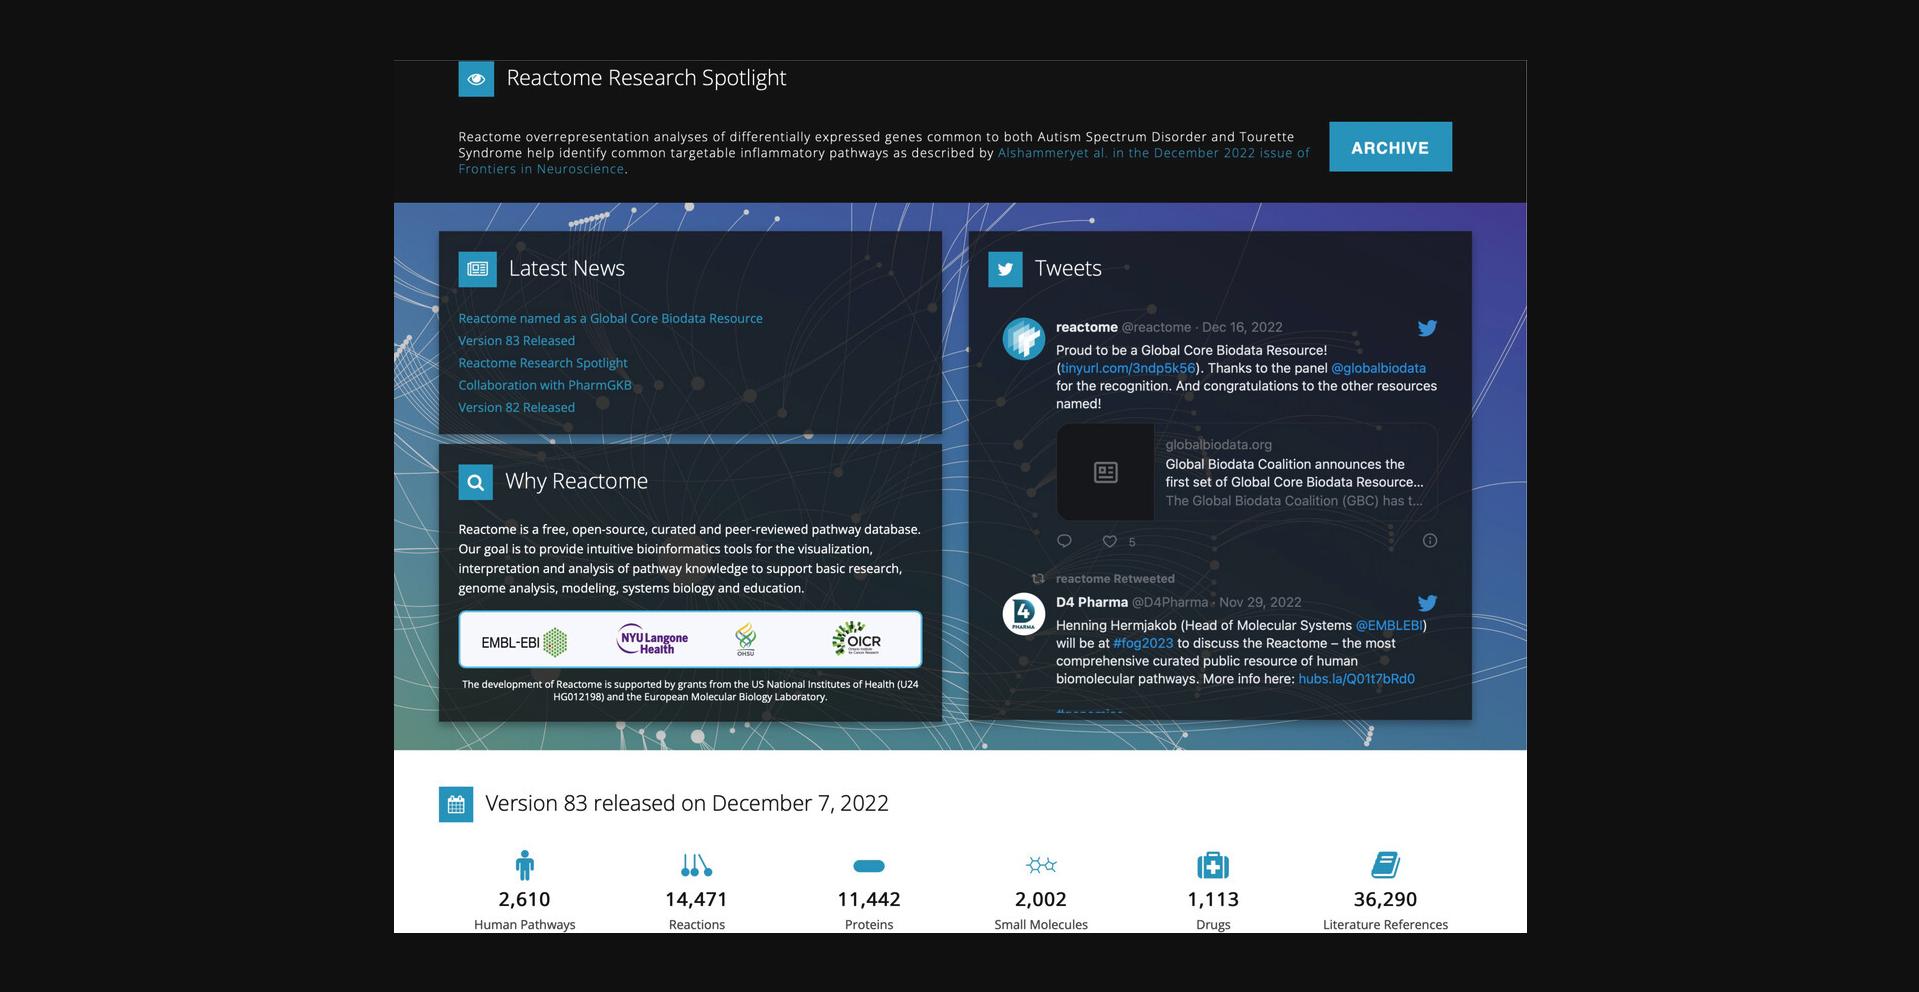
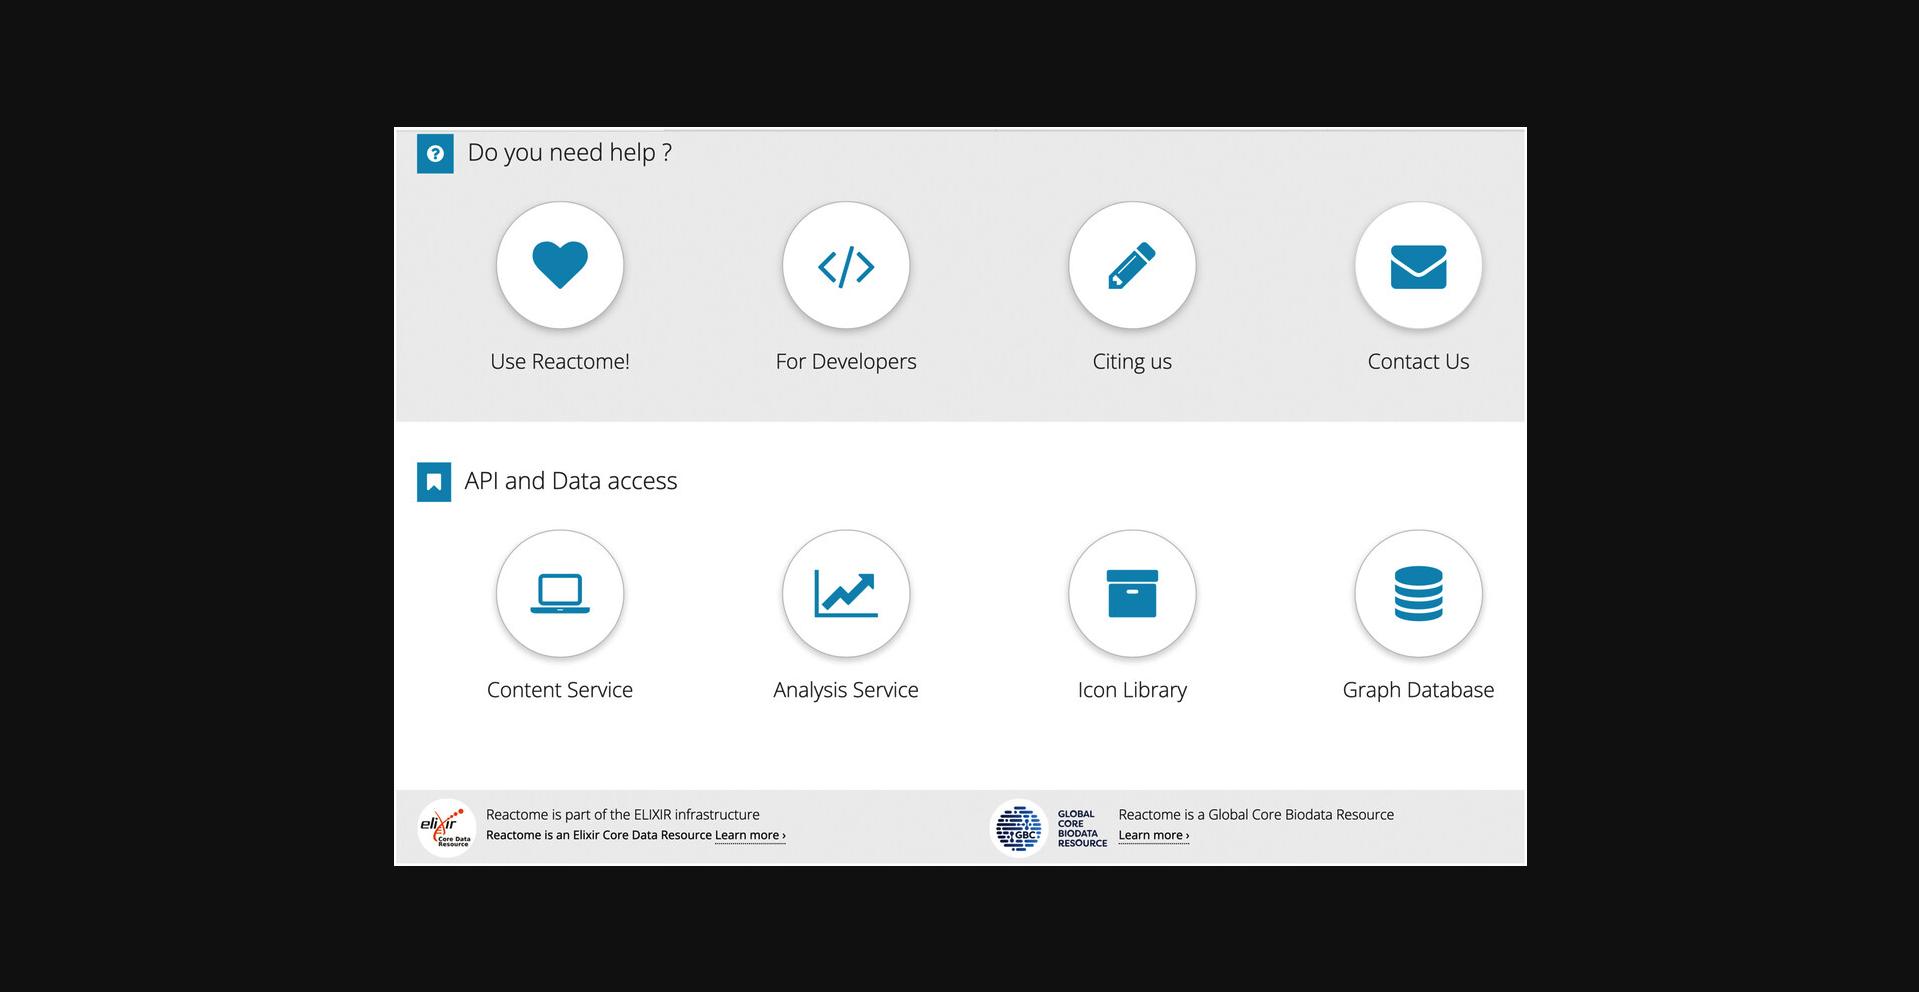
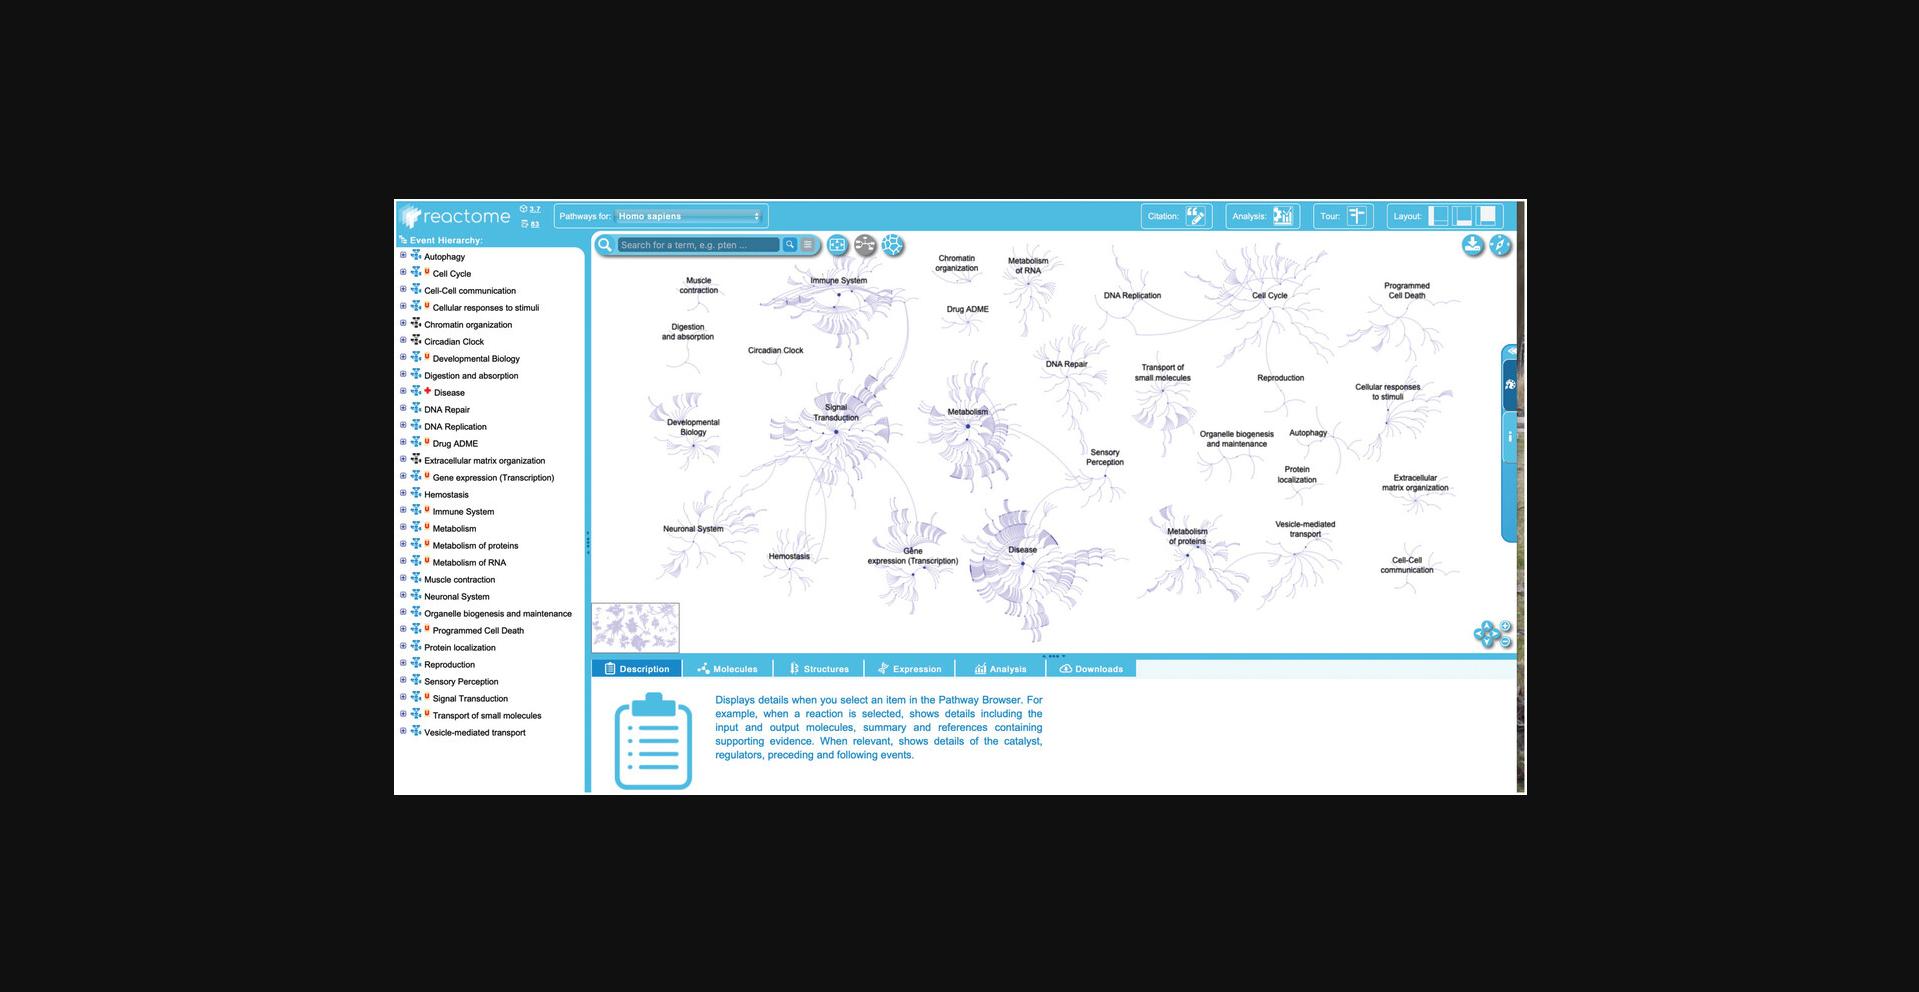
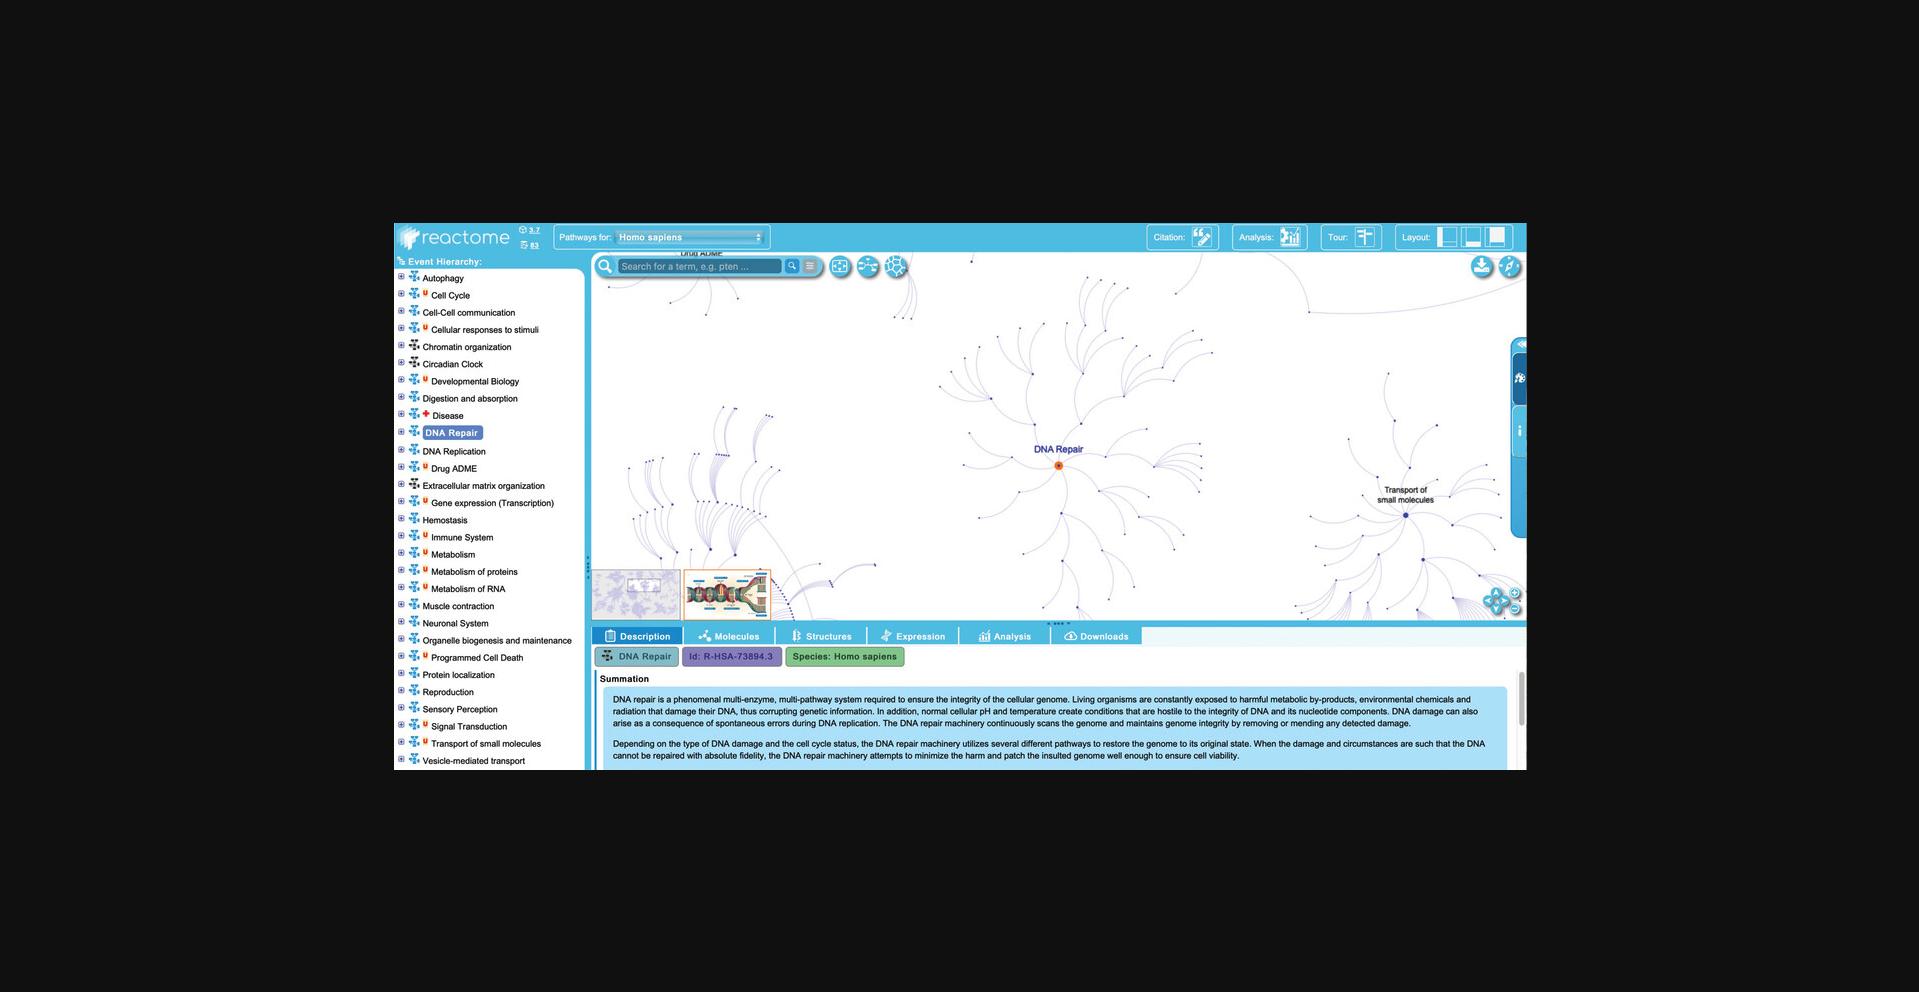
2.To begin exploring the curated Reactome pathways, click on the “Pathway Browser” button on the home page. This will load the page shown in Figure 4.
- 1.The header bar , at the top of the page. This has the Reactome logo, which returns users to the home page when clicked. Next to this is a species selector, with a drop-down list of species. Selecting an organism from the species selector will refresh the pathway browser with the inferred pathway diagram from the selected model organism if it is conserved. Reactome data is human-centric. Data for other species is inferred from human pathways and pathway steps may be missing for other organisms if they are not identified by the inference process. The “Analysis” button provides access to the interactive tools associated with the pathway diagrams, described below in Basic Protocols Basic Protocol 4, Basic Protocol 5, Basic Protocol 6 , and Basic Protocol 7 . Clicking the “Tour” button in the header opens a brief video tutorial on the key Reactome website functions, while selecting one of the layout buttons in the top right of the header bar allows users to personalize the Web site panels that are displayed to optimize viewing.
- 2.The pathway hierarchy panel , occupying the vertical rectangle on the far left of the screen, provides a scrolling display of all Reactome pathways in a hierarchy. The plus (“+”) symbol indicates that there are subheadings underneath the pathway headings. Clicking on a plus (“+”) symbol will expand the topic to show its subsections. The subpathways and reactions within each pathway can be hidden by clicking on the minus (“–”) symbol to the left of the pathway name. Next to the plus/minus signs is a small pathway icon in blue or black, indicating the presence or absence of an “Enhanced High Level Diagram” (EHLD, see below) associated with that pathway. A red “N” or “U” next to a pathway name indicates that the pathway is new or has been updated since the last release, respectively. A red cross next to a pathway name indicates that the pathway contains disease annotations.
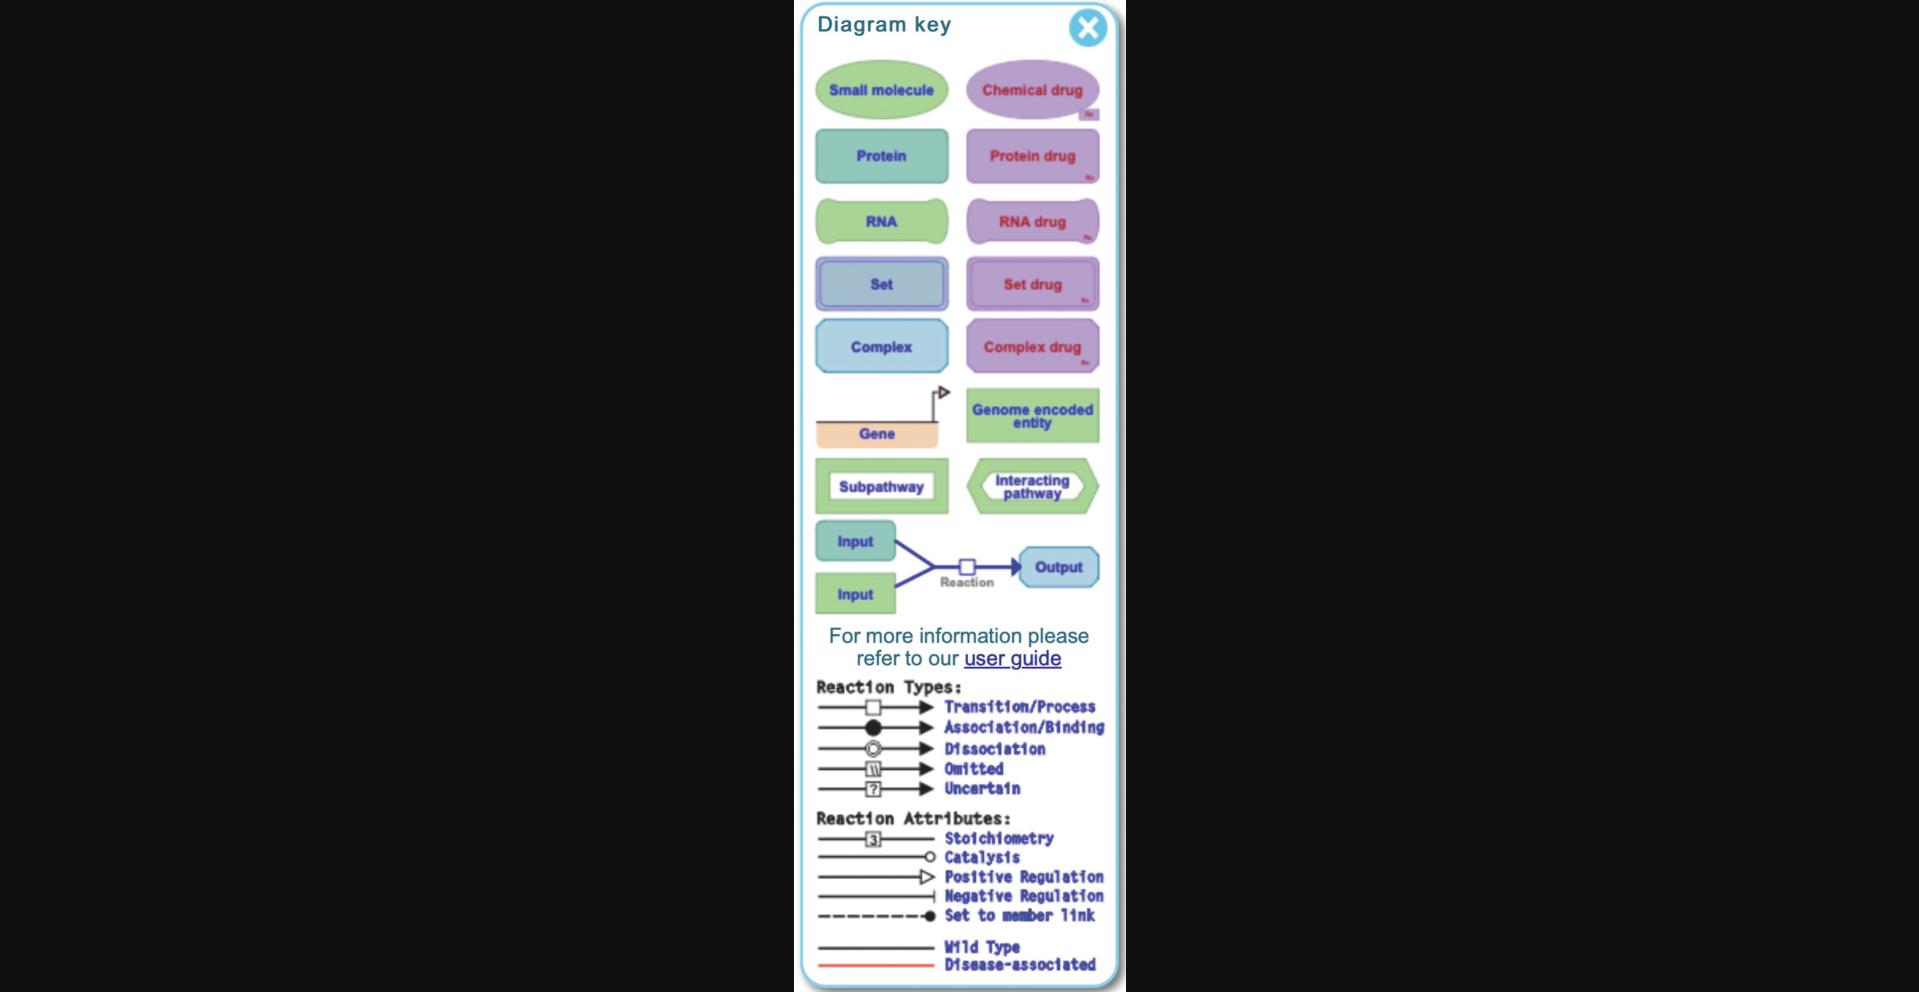
- 3.The visualization panel, _to the right of the hierarchy panel, displays an interactive pathway diagram that can be panned and zoomed in Google Map style. The visualization panel is synced with the pathway hierarchy on the left, such that selecting pathways or subpathways in the hierarchy will change what is displayed in the visualization panel. There are three primary views that can be displayed in this panel. The first view, “Pathway Overview”, displays the entire pathway hierarchy as interconnected nodes, with nodes representing pathways and edges representing relationships. If a user selects a pathway in the hierarchy or in the graphical display, the corresponding node is outlined in orange. The second view, “Enhanced High Level Diagram (EHLD)”, where available, displays a textbook style interactive illustration of a user-selected pathway (_Sidiropoulos et al. , 2017 _). The third view, “Entity Level View” (ELV), displays the reaction-level molecular details of the user-selected pathway. The ELV pathway diagrams apply the conventions of the Systems Biology Graphical Notation (SBGN) format (_Le Novère et al. , 2009 ) to distinguish the molecules and reactions by shape and cellular location, providing a dynamic framework for pathway visualization and data analysis. Users can toggle between the Pathway Overview and the ELV views by clicking the second of three blue icons beside the search bar at the top left of the visualization panel. EHLDs, where available, appear as a thumbnail in the bottom left of the visualization panel, and can be accessed by clicking the pathway name in the pathway hierarchy at the left of the visualization panel. An alternate view of the entire pathway hierarchy can be accessed by clicking the third blue icon to the right of the search bar from the Pathway Overview view. This opens a separate window and displays the Reactome pathways as a Voronoi diagram, with sizes of pathway clusters proportional to the number of events the pathway contains (Jassal et al. , 2020 ). To move from the Voronoi diagram back to the Pathway Browser, click and hold on a pathway name within the Voronoi image.
- 4.The details panel _is located below the visualization panel, and its contents change in sync with user selections in the visualization panel or the pathway hierarchy. The details panel has 6 tabs, each of which contains a general description of what will be displayed in that panel once an event or entity is selected. The “Description” tab displays molecular details related to the selected event or entity, including inputs and outputs of reactions, catalysts, regulators, preceding, and following events, linkouts to other databases with entity information, etc. This tab also displays event summations, literature references, and editorial information. The “Molecules” tab shows downloadable details of the molecules (proteins, small molecules/chemical compounds, nucleic acid sequences) involved in the selected event. The “Structures” tab shows reaction details from Rhea (_Bansal et al. , 2022 _) or structural information from ChEBI (_Hastings et al. , 2016 _) or PDBe (_Armstrong et al. , 2020 ), as appropriate. The “Expression” tab displays gene expression information from Gene Expression Atlas for genes corresponding to the selected items. The “Analysis” tab displays the pathway-specific results generated by the Reactome analysis tools, and finally, the “Download” tab allows users to download the selected pathway in several different formats.
3.This protocol will illustrate features of the Reactome pathway browser by exploring the events contained within the “DNA Repair” pathway. To begin, click on the “DNA Repair” pathway title in the pathway hierarchy at right.
4.Double click on the “DNA Repair” pathway title in the hierarchy, or double click on the corresponding node in the visualization panel.
5.Click on the plus (“+”) symbol beside “DNA Repair” in the hierarchy to reveal the subpathways.
6.Click on the “Nucleotide Excision Repair” pathway either in the hierarchy or from within the “DNA Repair” EHLD.
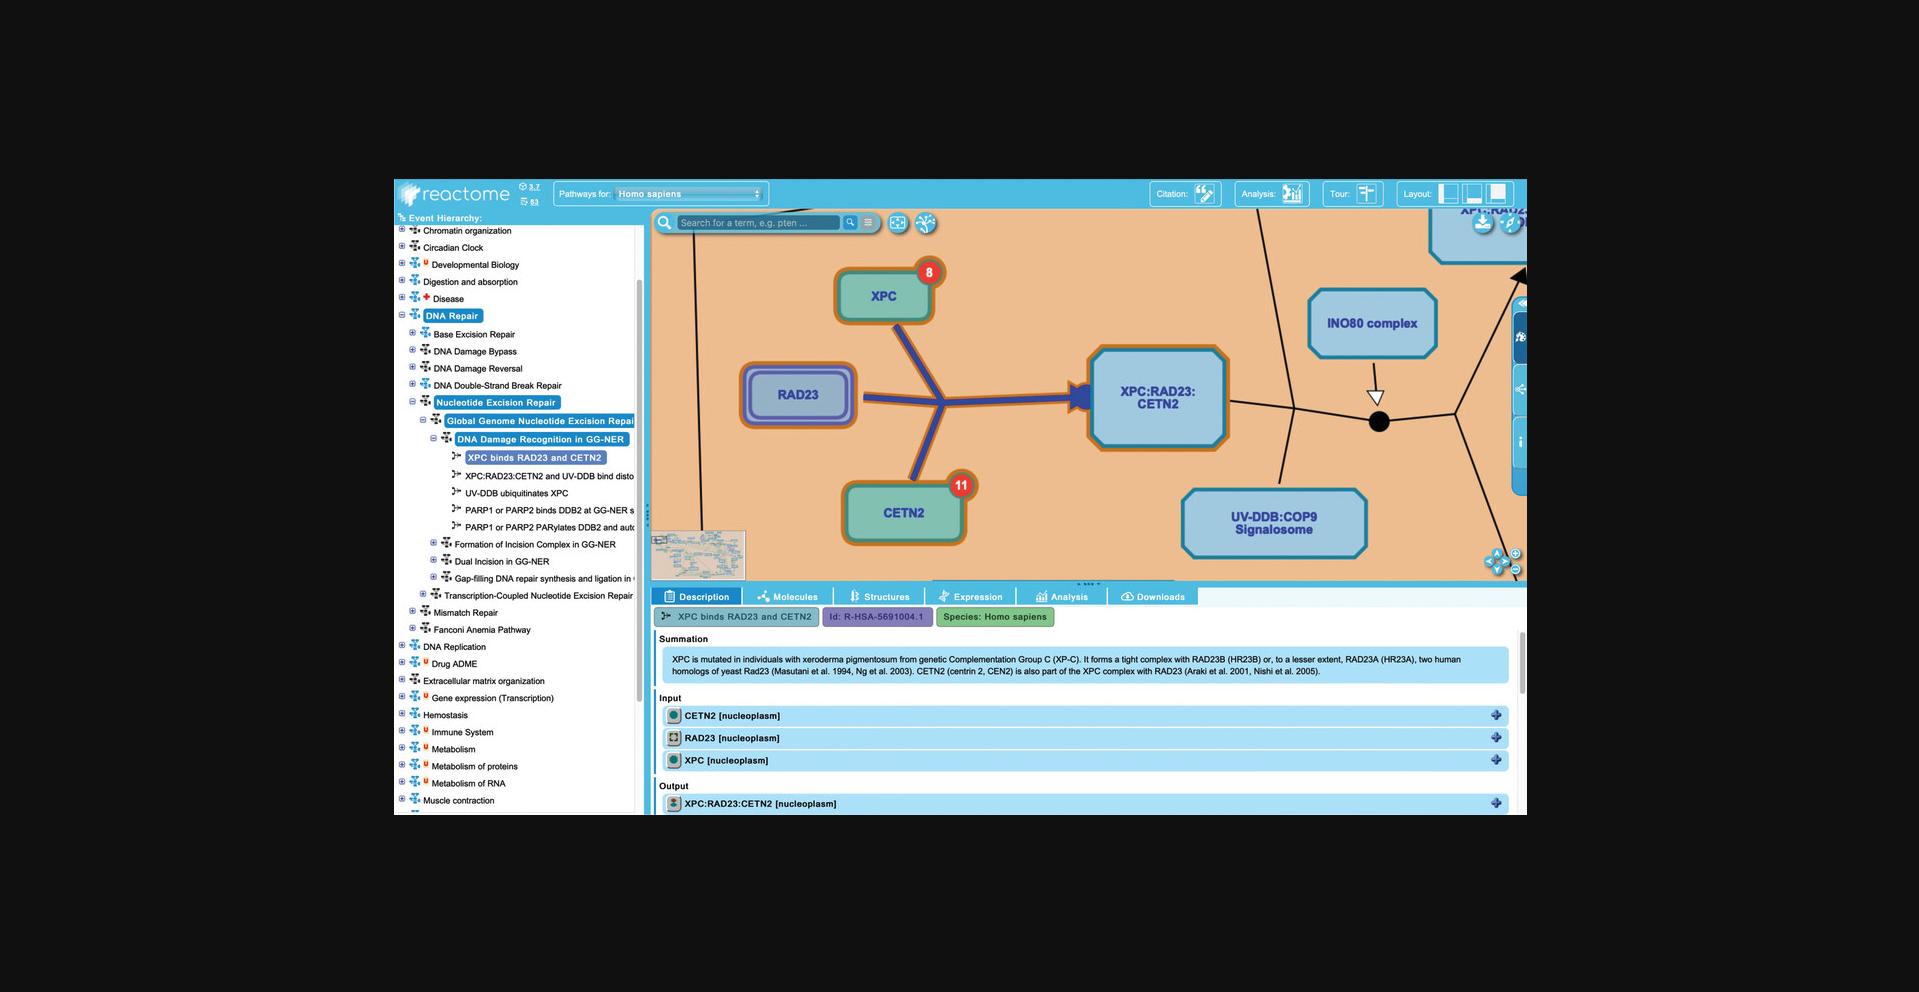
7.Continue to drill down into the hierarchy to reach reaction level events as follows: Click on the pathway title “Global Genomic Nucleotide Excision Repair”. Note that the details panel shows that this pathway contains 92 of the 119 molecules present in the NER pathway (8/9 “Chemical Compounds” and 84/110 “Proteins”). Expand this subpathway in the hierarchy by clicking on the adjacent plus sign to reveal the four subpathways (“DNA Damage Recognition in GG-NER”, “Formation of Incision Complex…”, etc.). Continue to expand the hierarchy by clicking the “DNA Damage Recognition in GG-NER” pathway in the hierarchy to reveal the five molecular level events contained within, noticing that at each subsequent pathway level the fraction of molecules represented is adjusted relative to the parent NER pathway.
8.Click on “XPC binds RAD23 and CETN2”, the first reaction in the “DNA Damage Recognition in GG-NER” pathway, as shown in Figure 7.
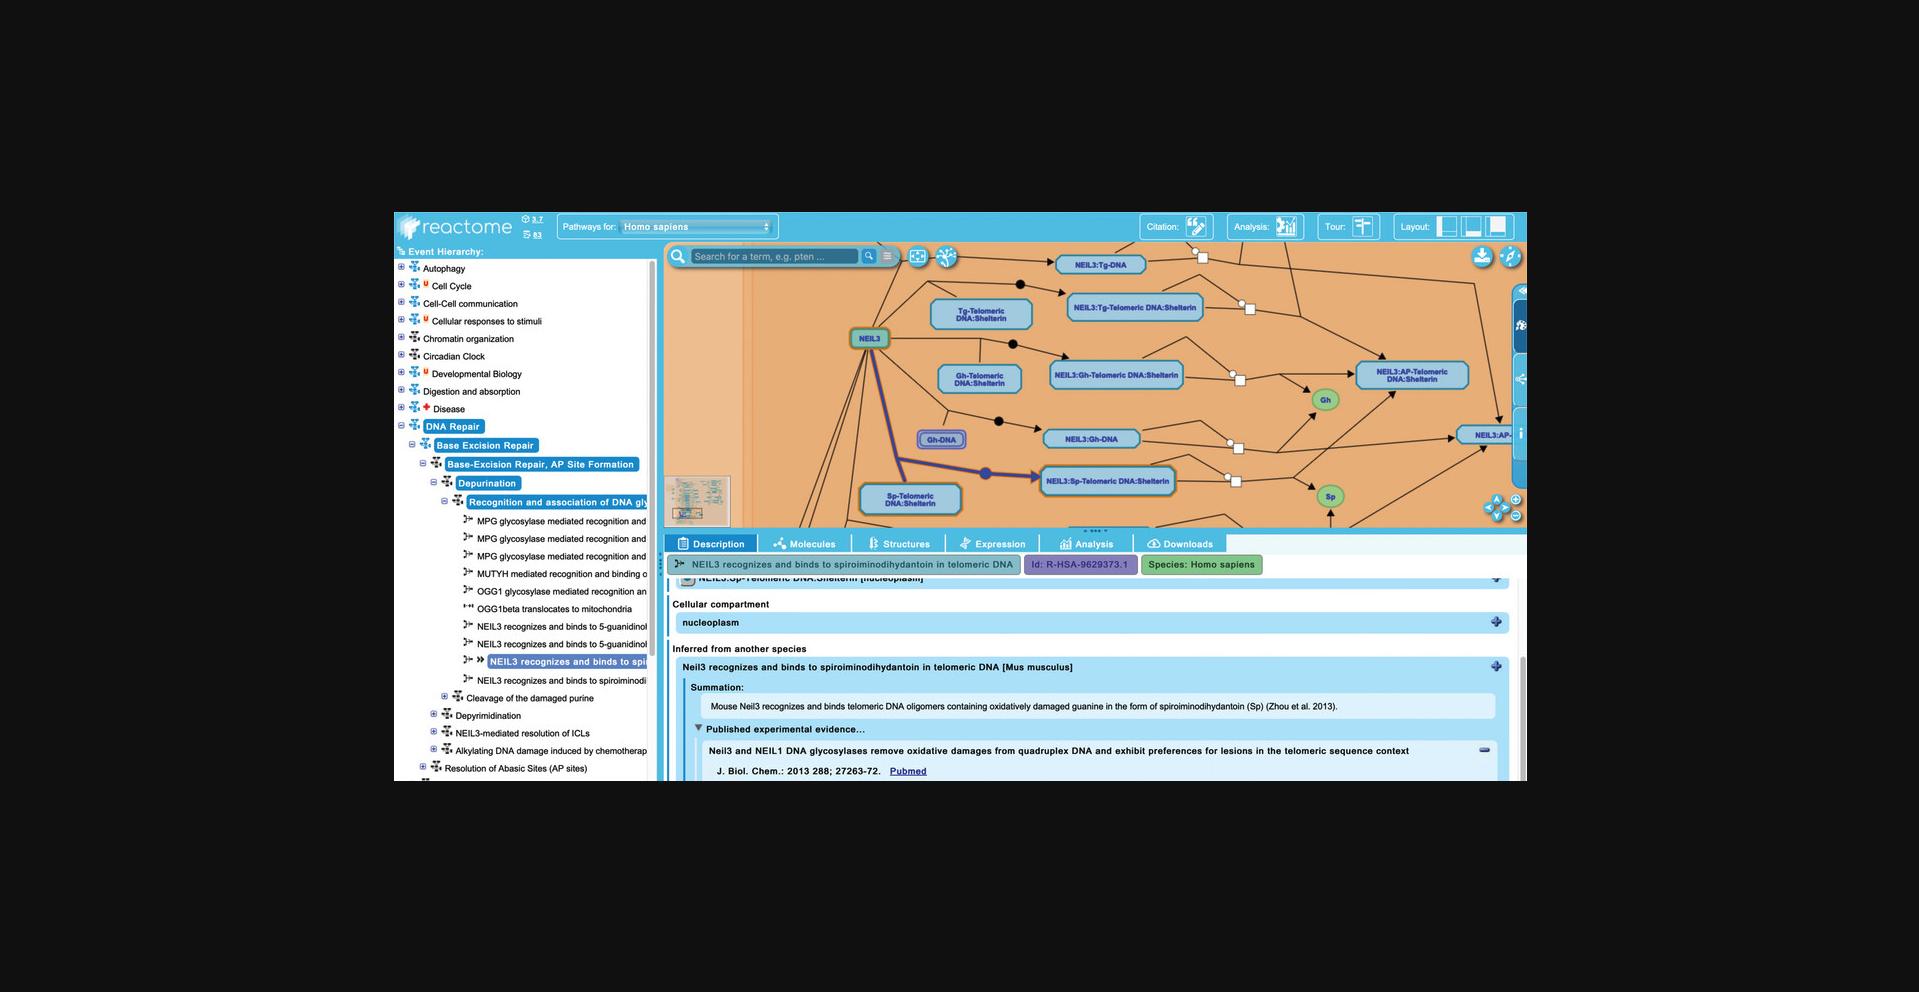
9.There are no inferred reactions within the “Nucleotide Excision Repair” subpathway. To see an example in the “Base Excision Repair” pathway, expand the “Base Excision Repair” hierarchy to reveal the subpathways “Base-Excision Repair, AP Site Formation”, and continue to unfurl its child pathway “Depurination”, and its child pathway “Recognition and association of DNA glycosylase with site containing an affected purine”.
10.In addition to the reaction level information described above (summations, literature references, editorial attributes, etc.), Reactome also provides detailed information about each of the entities involved in a reaction. To explore this, return to the first reaction of the “DNA Damage Recognition in GG-NER pathway”, “XPC binds RAD23 and CETN2”. Clicking on any of the inputs or outputs of the reaction (or regulators and catalysts where applicable) updates the “Description” tab of the details panel with information and linkouts for the corresponding molecule. In the “XPC binds RAD23 and CETN2” reaction, click on the “XPC” entity in the pathway diagram.
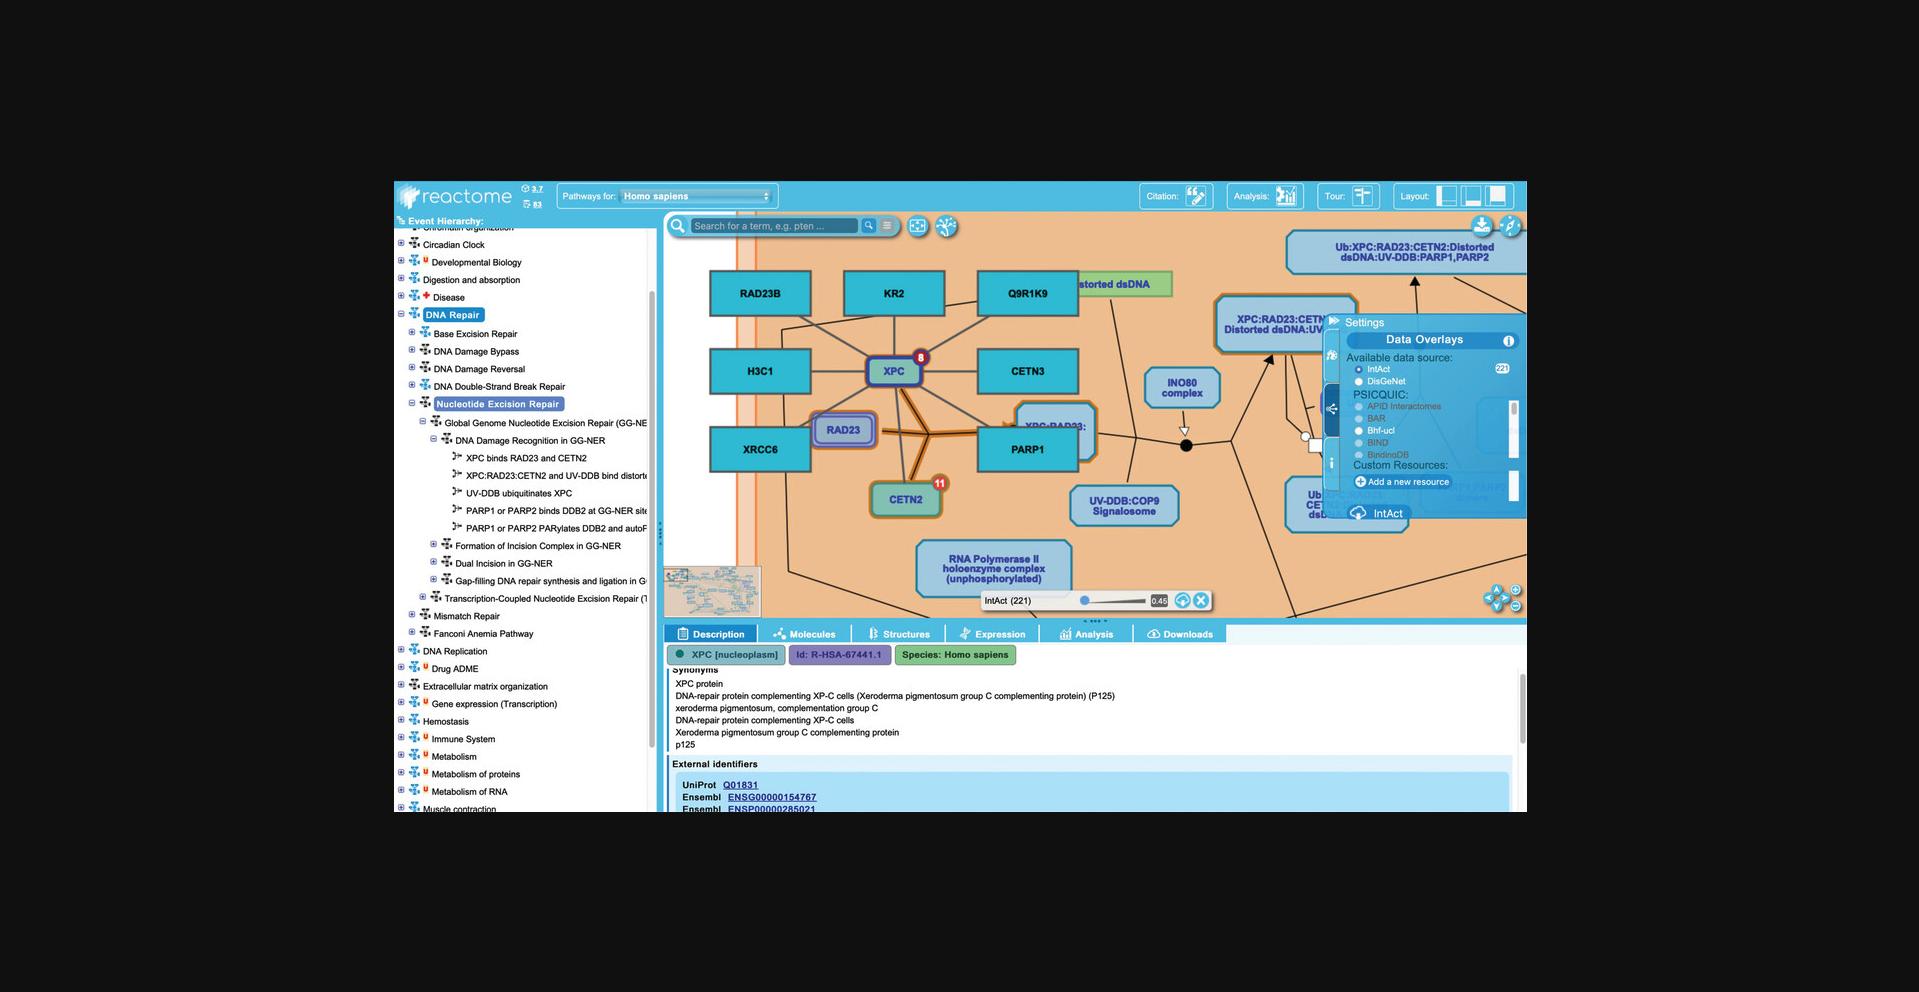
11.Reactome provides information about the subunits of a complex, as well as the larger ensembles of proteins that a complex participates in. In this example, from the “XPC binds RAD23 and CETN2” page, click on the “XPC:RAD23:CETN2” entity in the pathway diagram. This will update the Details panel to display information about this complex.
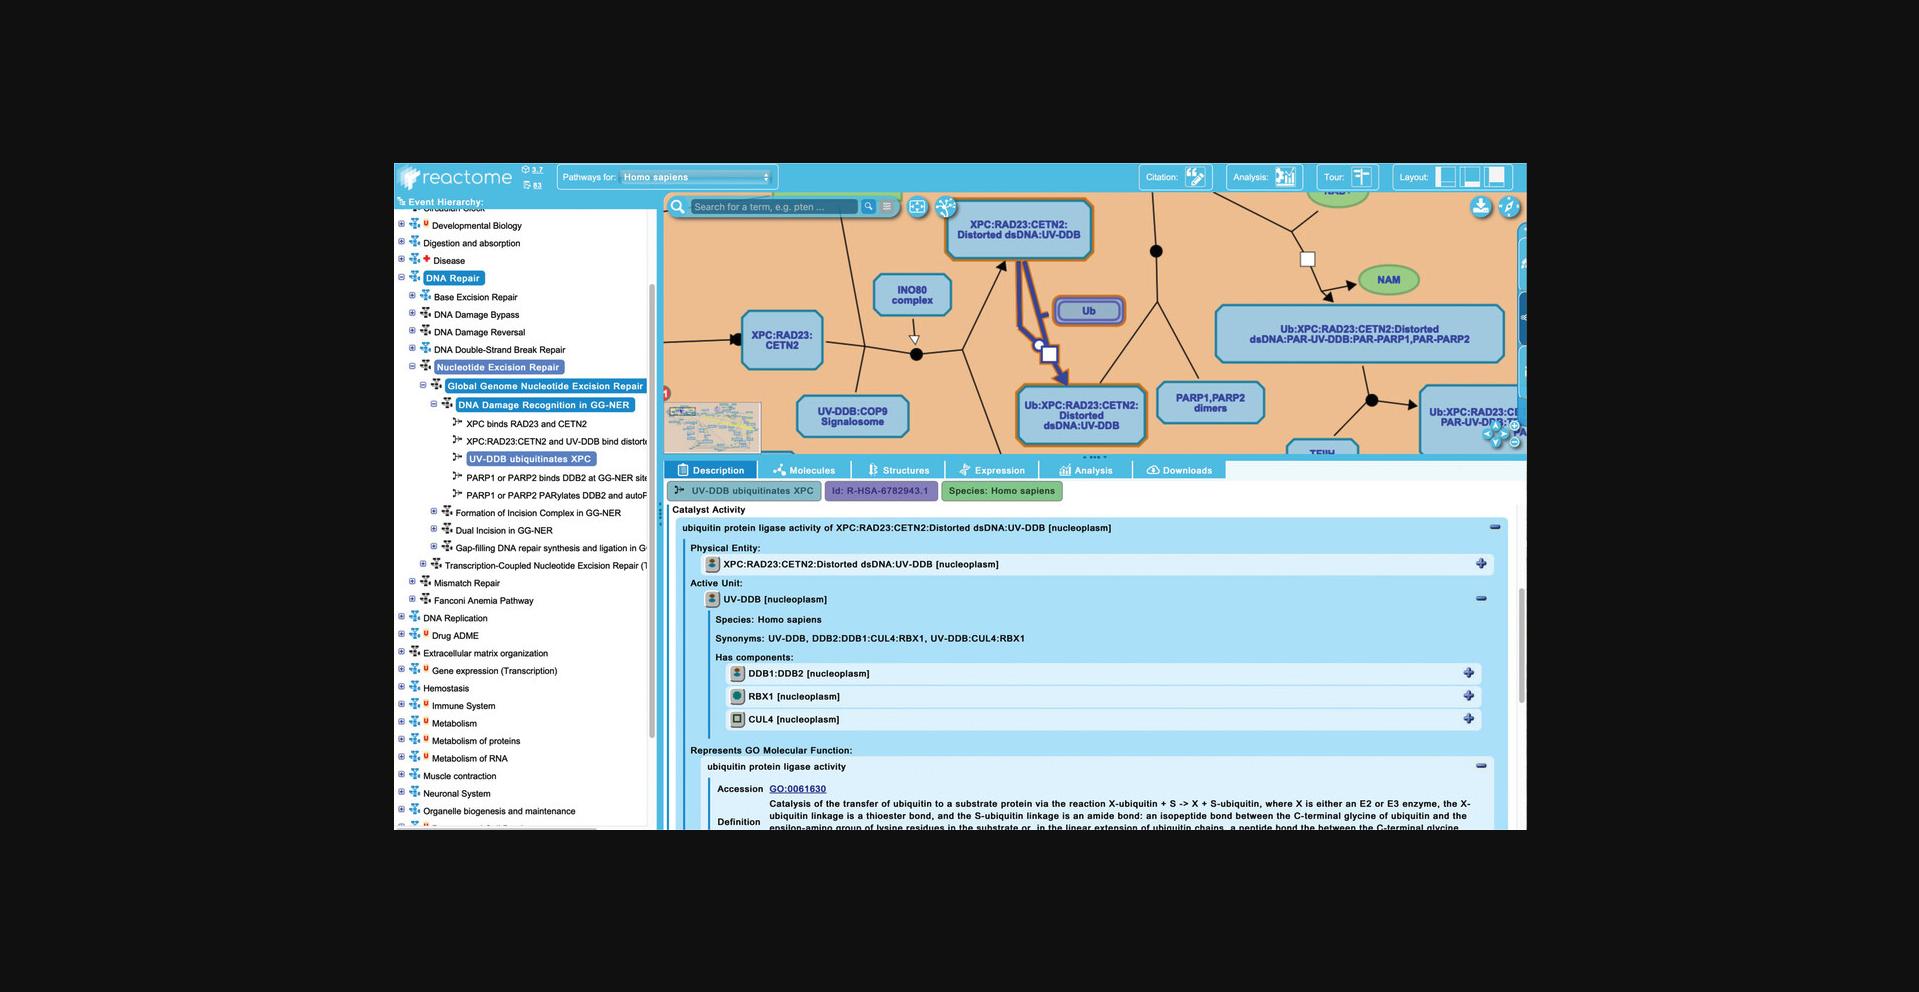
12.To explore the information Reactome provides about catalysts, click on the third reaction in the “DNA Damage Recognition in GG-NER” pathway, “UV-DDB ubiquitinates XPC”. Catalysts are shown regulating the reaction node by virtue of an edge ending in a circle (see Fig. 10). Catalysts may either be independent of other reaction participants, or, as in this case, may be one of the reaction inputs. Reflecting this dual role, the “XPC:RAD23:CETN2:Distorted ds DNA:UV-DDB” complex has both a reaction edge and a catalyst edge associated with it.
1.-Physical Entity: whichever molecule in the pathway diagram is associated with the catalyst activity. This may be a single protein, a set of proteins, or a complex (here the complex “XPC:RAD23:CETN2:Distorted ds DNA:UV-DDB”). 2.-Active Unit: in cases such as this one where a complex is the catalyst, the specific component that contributes the catalytic activity is identified. Here, the active unit is the UV-DDB subcomplex consisting of DDB1 and 2, RBX1 and CUL4. 3.-Molecular Function: the most appropriate term is taken from (and linked out to) the GO. The catalyst name is a concatenation of the GO Molecular Function and the name of the Physical entity.
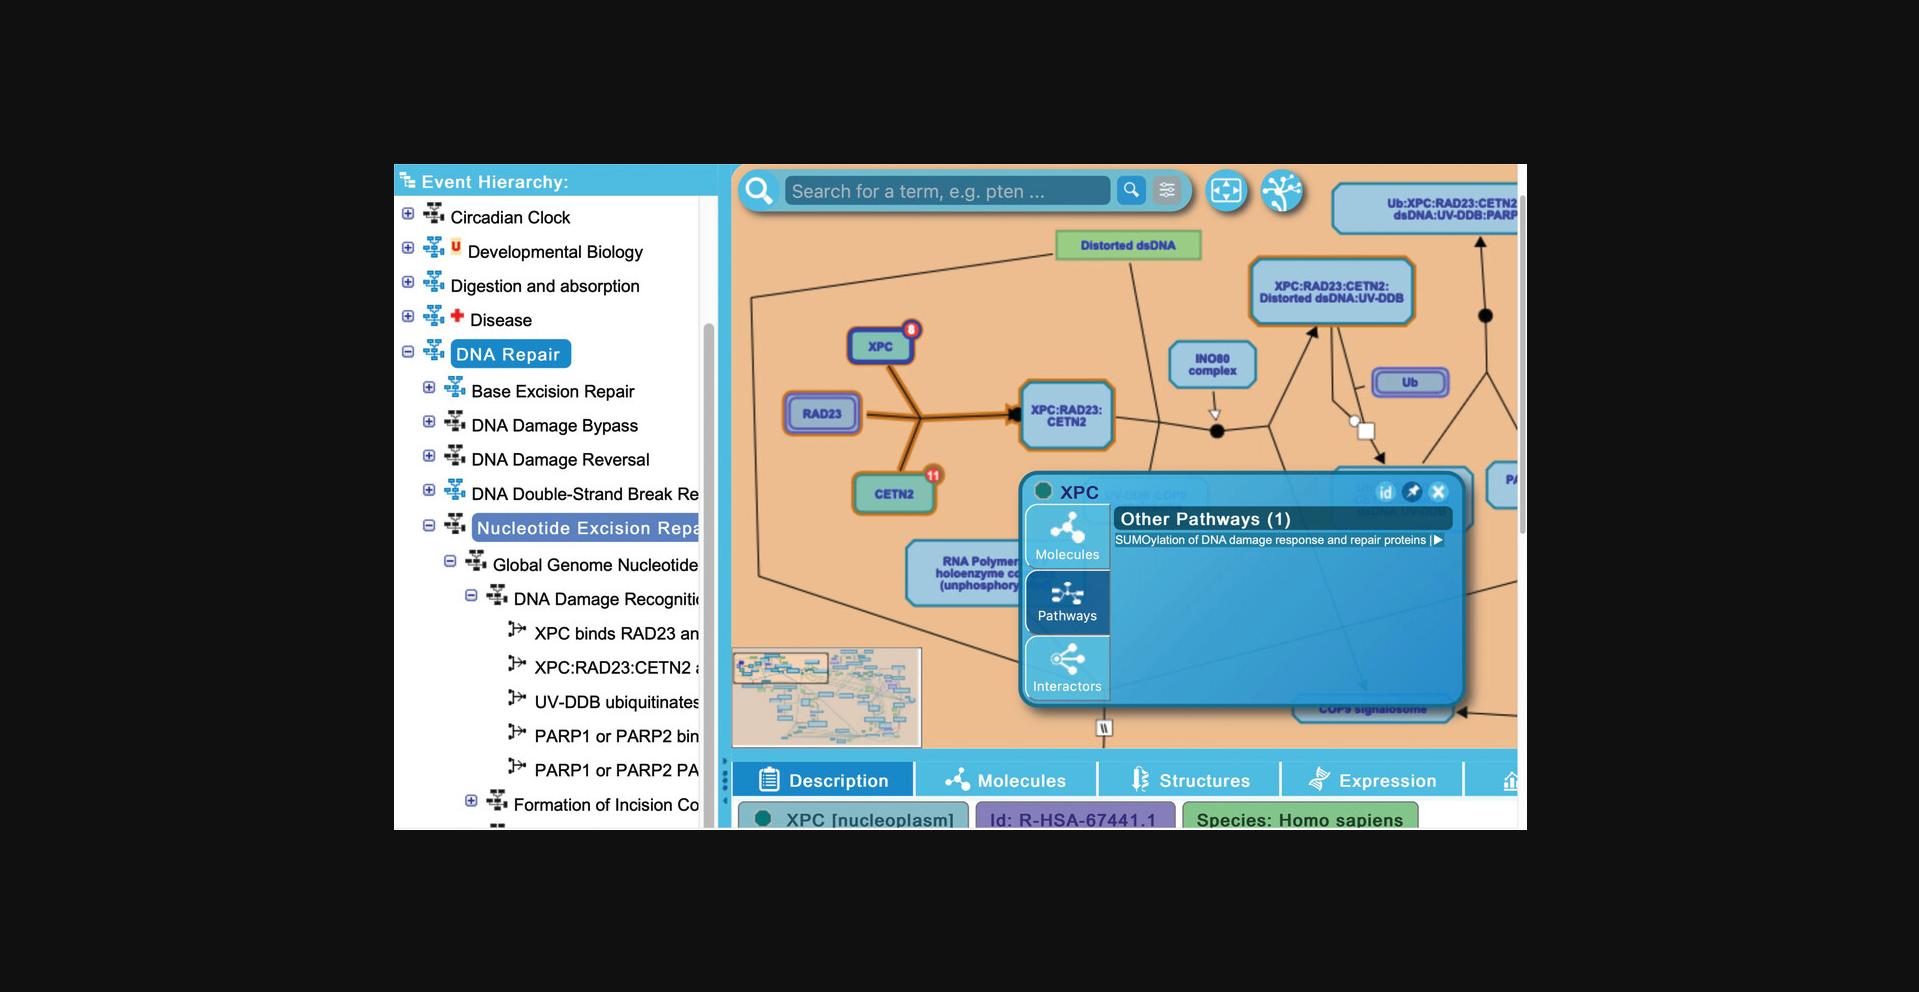
13.Reactome provides inter-pathway connections for physical entities contained within a given pathway diagram. Hovering over any entity in the visualization panel reveals an arrowhead at the right side of the entity icon. Clicking on this arrowhead reveals an interactive information panel (Contextual Information Panel, CIP) with three tabs (see Fig. 11): “Molecules”, “Pathways”, and “Interactors”. Similar to the descriptions above, the “Molecules” tab provides the components of the selected entity, and the “Interactors” tab provides a table listing the interacting proteins along with scores and evidence (note that display name of components or interactors can be toggled between common name and reference identifier by clicking on the small “id” button at the top right of the interactive panel; clicking on the pin icon locks the interactive panel to the pathway diagram; to close the panel, click on the “x” icon).
To explore the “Pathways” tab, click on the arrowhead revealed by hovering above the XPC protein input in the first reaction of the “DNA Damage Recognition in GG-NER” subpathway, “XPC binds RAD23 and CETN2”.
Basic Protocol 2: EXPLORING REACTOME ANNOTATIONS OF DISEASE AND DRUGS
In addition to normal human biology, Reactome annotates abnormal or pathological events arising from genetic mutation or interaction with an infectious agent in a separate top-level pathway called “Disease”. Reactome disease pathways are designated with a red “+” symbol to the left of the pathway name and include cancer, metabolic, immune, and infectious diseases, among others. Where possible, Reactome disease pathways also include the interaction of relevant therapeutic drugs.
Consistent with Reactome's pathway-centric view, disease events (with the exception of infectious processes) are annotated as changes to normal molecular level reactions and are displayed in the context of the relevant non-disease pathway background. As a result, there is no single diagram representing a given disease (e.g., bladder cancer or diabetes) but rather individual events that are perturbed in the course of that disease are labeled with the appropriate disease tag and displayed as overlays to normal pathway events. Events with the same disease tag may, therefore, be distributed across multiple normal pathways and pathway diagrams. Infectious diseases represent novel events that do not have a corresponding normal state and have their own pathway diagrams.
Reactome's disease and drug annotations will be explored using the disease pathways “Signaling by ERBB2 in Cancer” and “SARS-CoV-2 Infection”. This module will highlight where and how the disease pathway annotations diverge from those of normal pathways; many of the key annotation features, however, are functionally equivalent and these will not be detailed here.
Necessary Resources
Hardware
- Computer capable of supporting a Web browser and an Internet connection
Software
- Any modern Web browser such as Firefox, Safari, and Chrome will work to display Reactome Web pages
1.To begin exploring Reactome's disease and drug annotations, point the browser to the Reactome home page at https://reactome.org.
2.Click on the “Pathway Browser” button on the home page and unfurl the events under the “Disease” top level pathway in the hierarchy by clicking on the “+” symbol to the left of the pathway name.
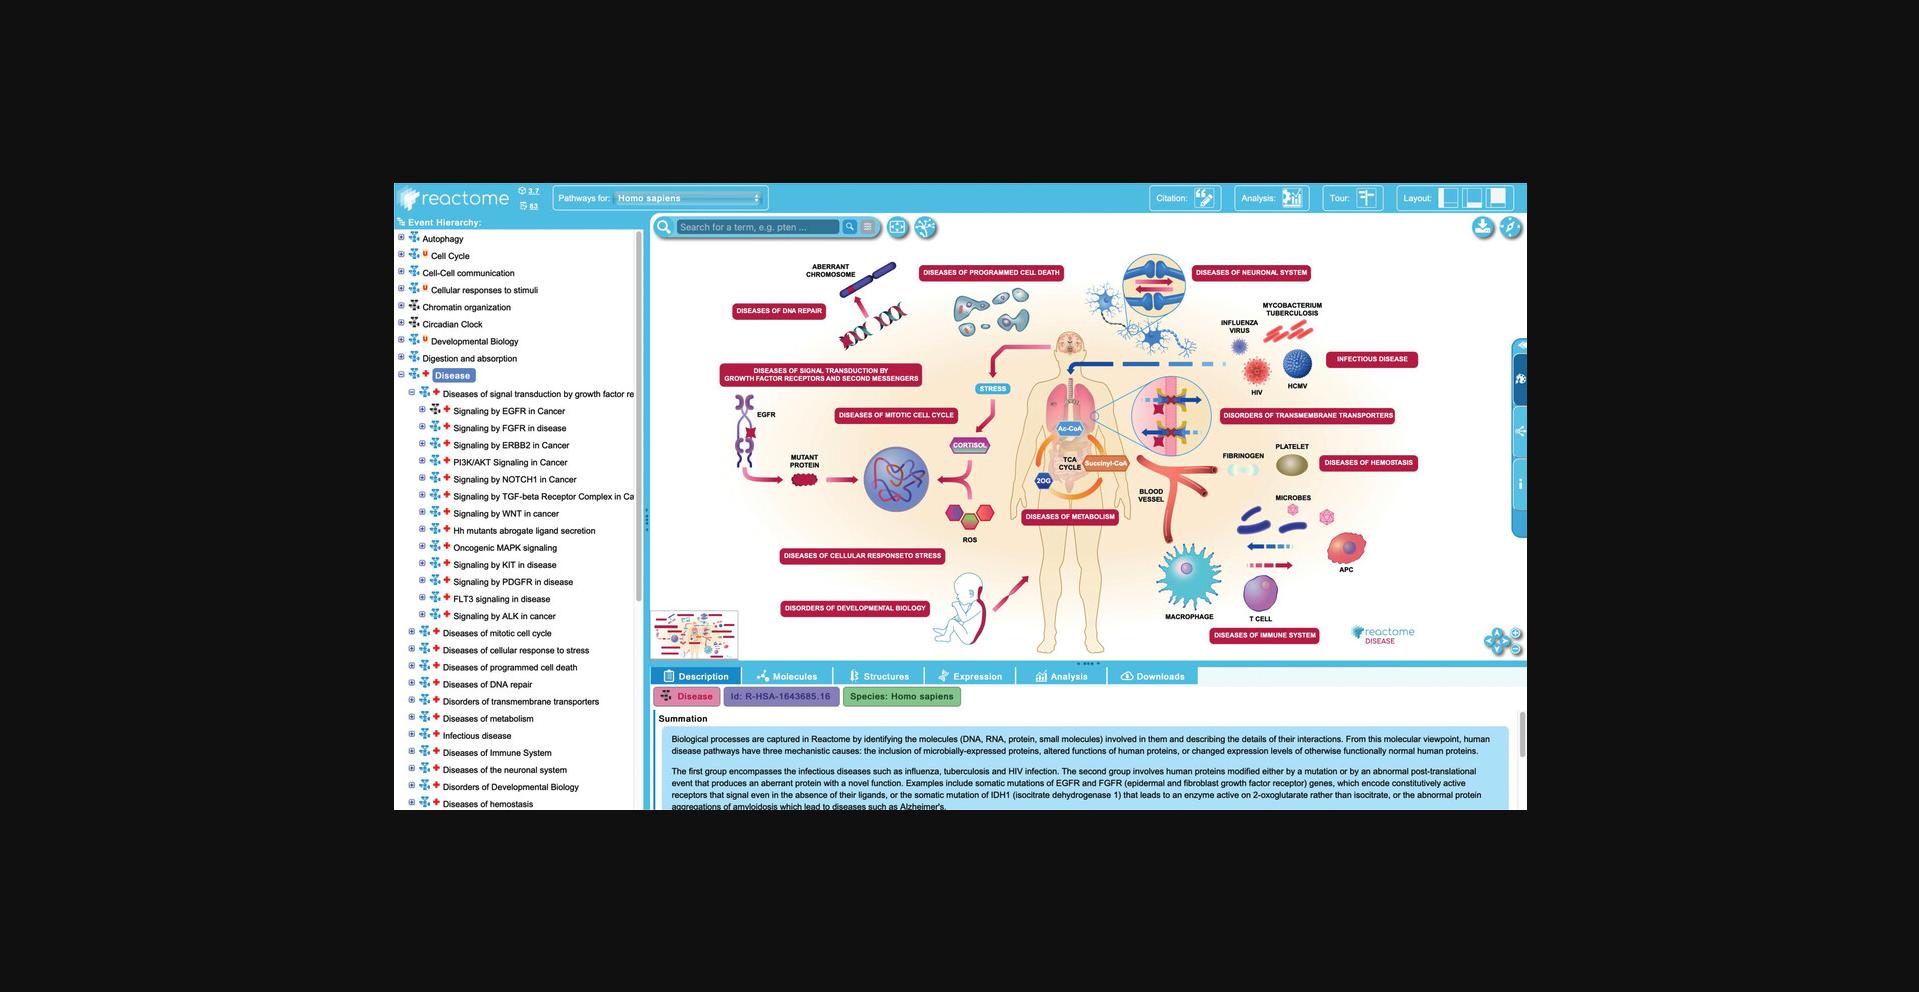
3.Continue to unfurl the disease hierarchy, first expanding the “Diseases of signal transduction by growth factor receptors and second messengers” pathway, and then the child of that subpathway “Signaling by ERBB2 in Cancer”. This is an EHLD-level pathway with 6 subpathways.
4.Click on the first subpathway “Constitutive Signaling by Overexpressed ERBB2”. This opens an ELV level pathway with molecular level reactions laid out.
5.Click on the first reaction of the “Constitutive Signaling by Overexpressed ERBB2” pathway, “ERBB2 homodimerization”.
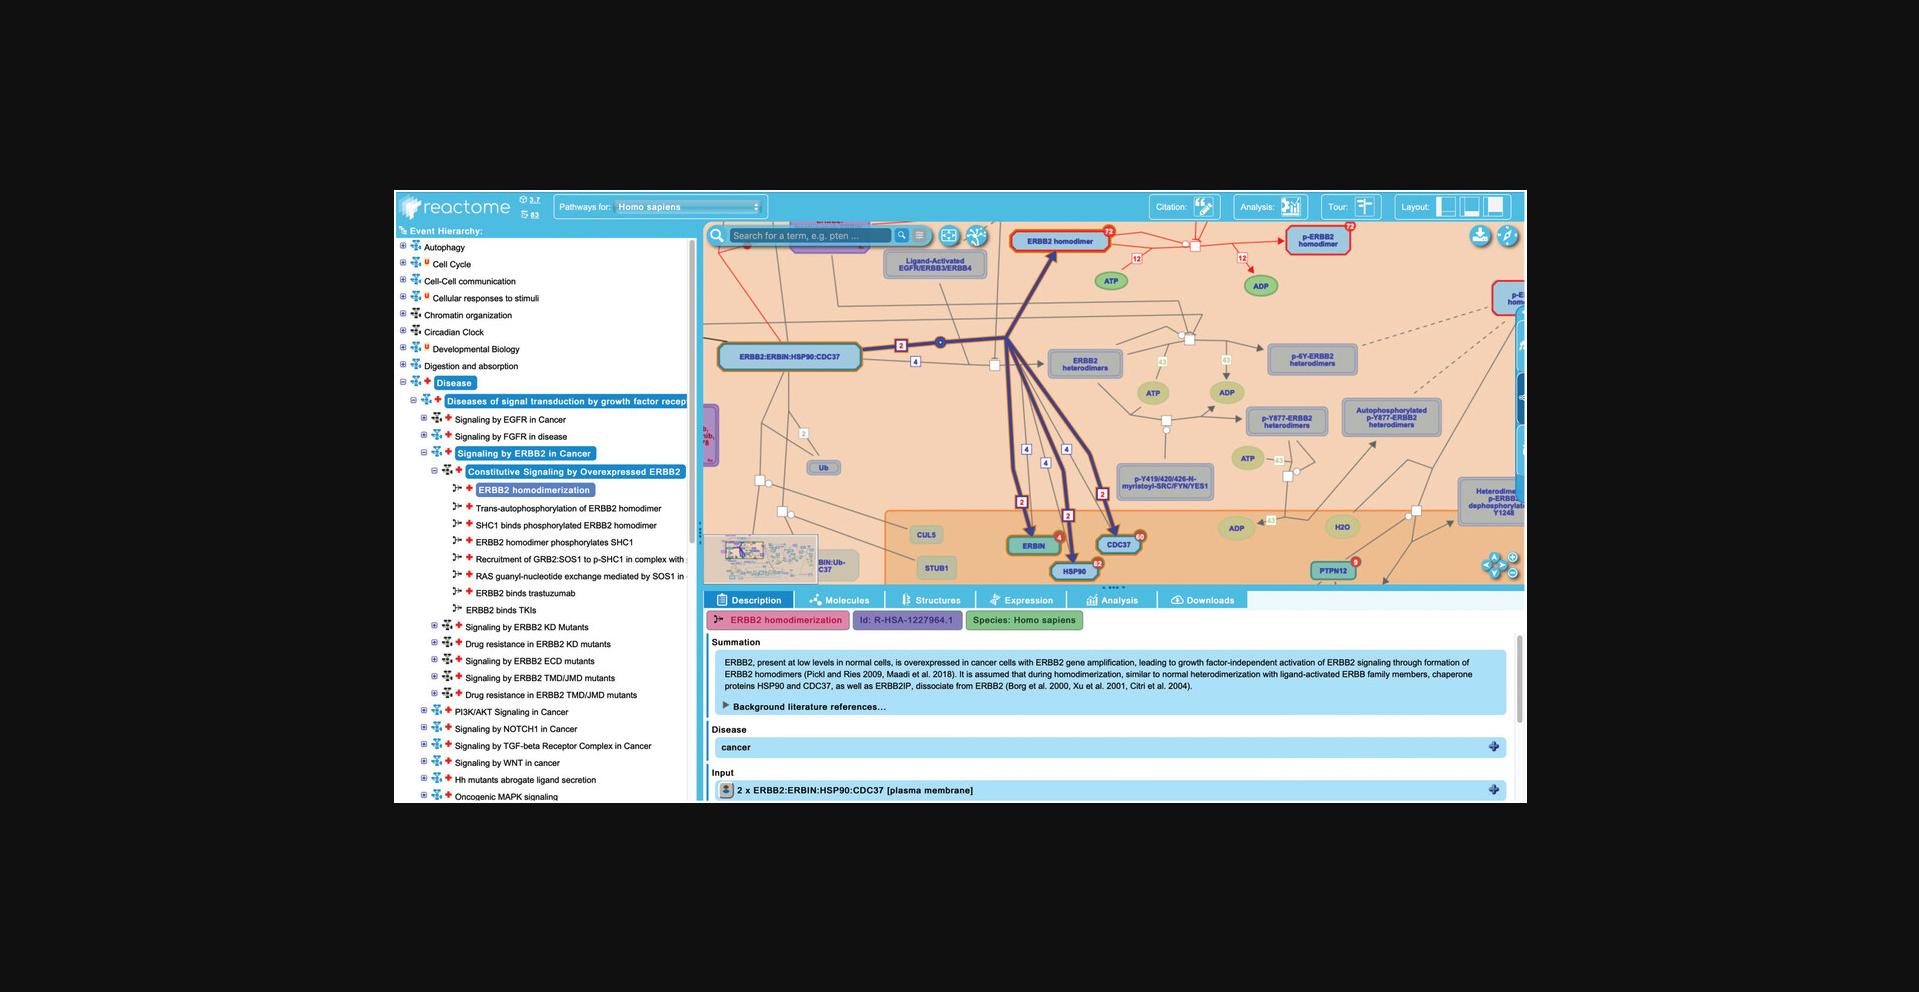
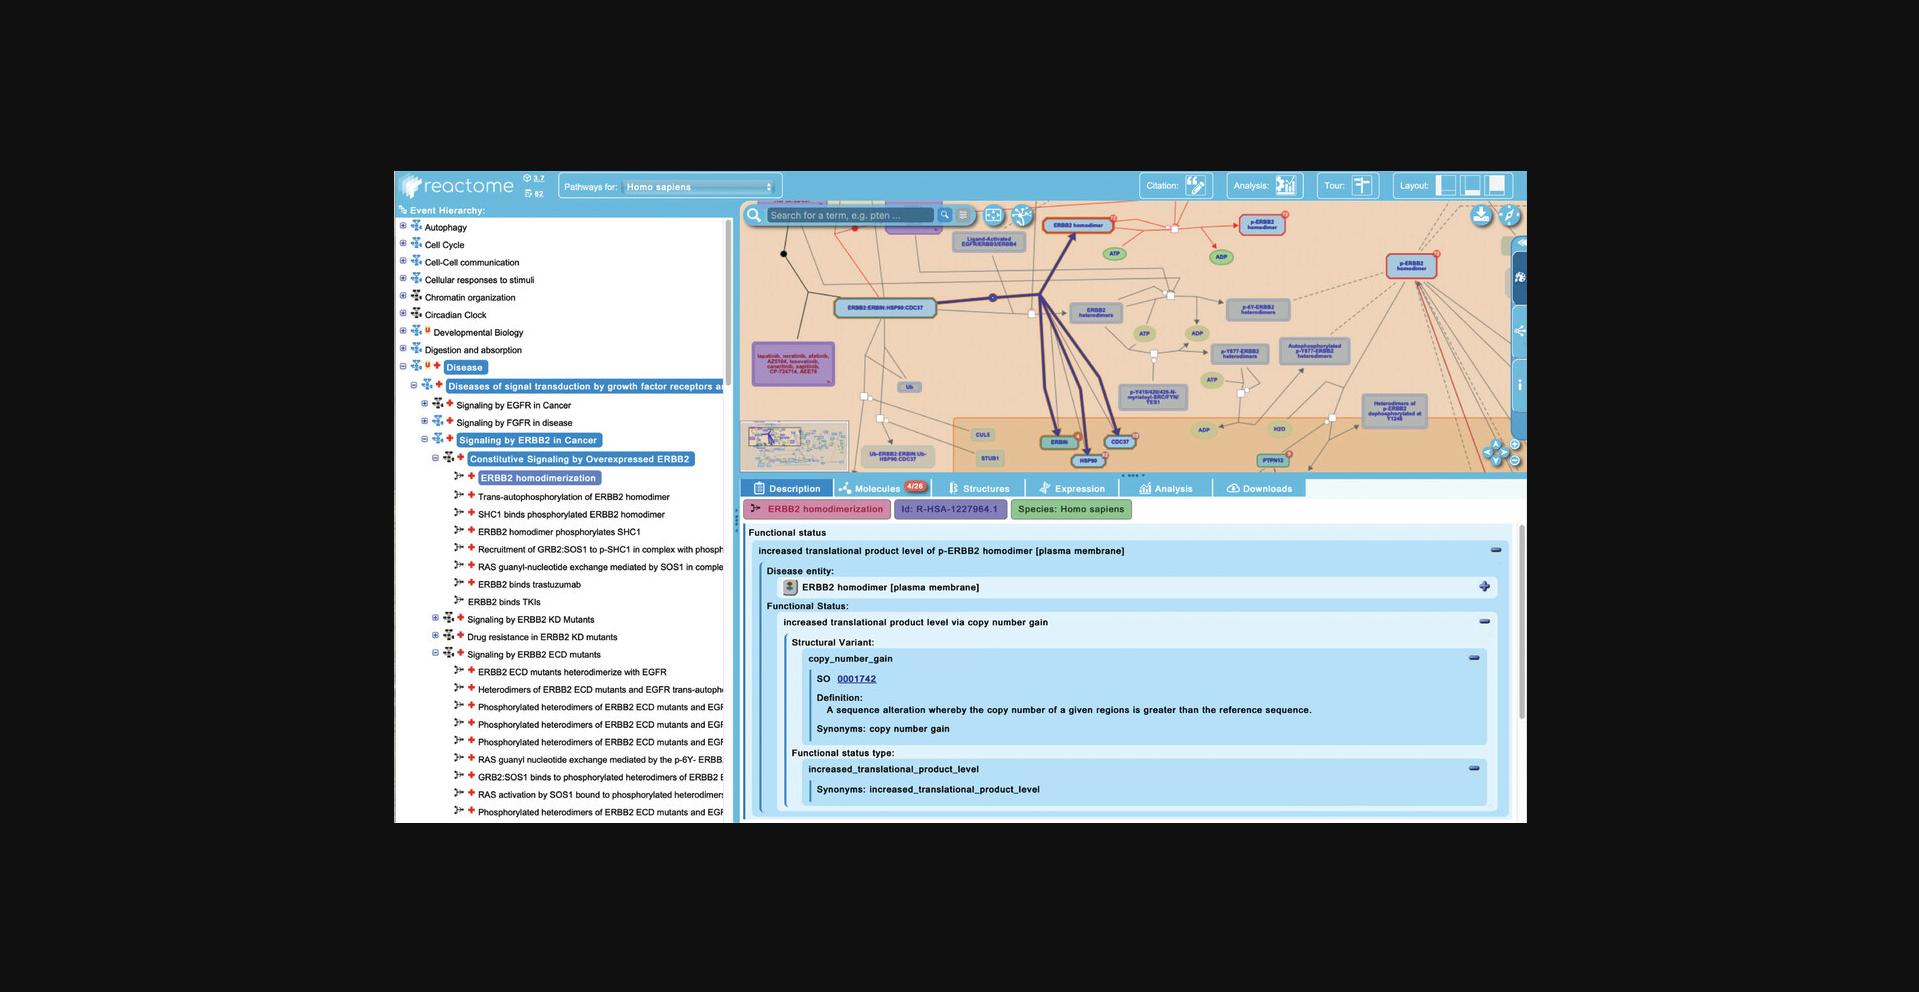
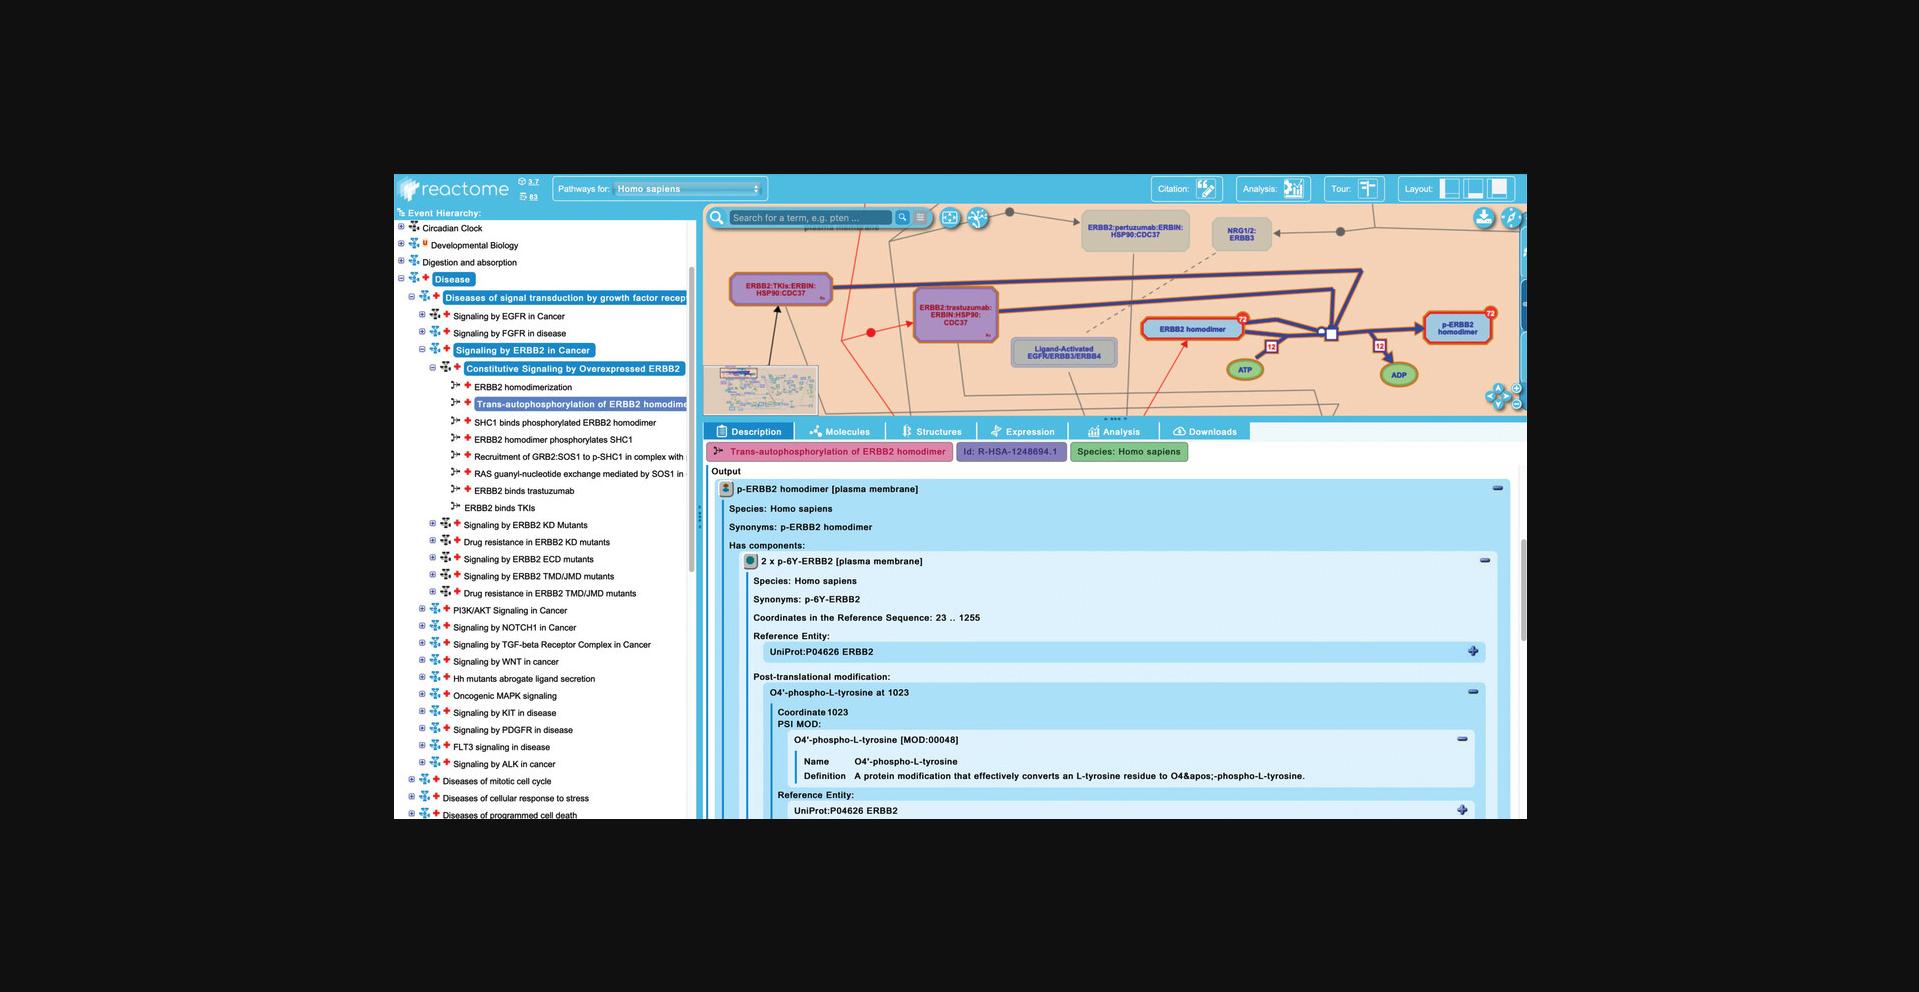
6.Click on the next reaction in the “Constitutive Signaling by Overexpressed ERBB2”, “Trans-autophosphorylation of ERBB2 homodimer”.
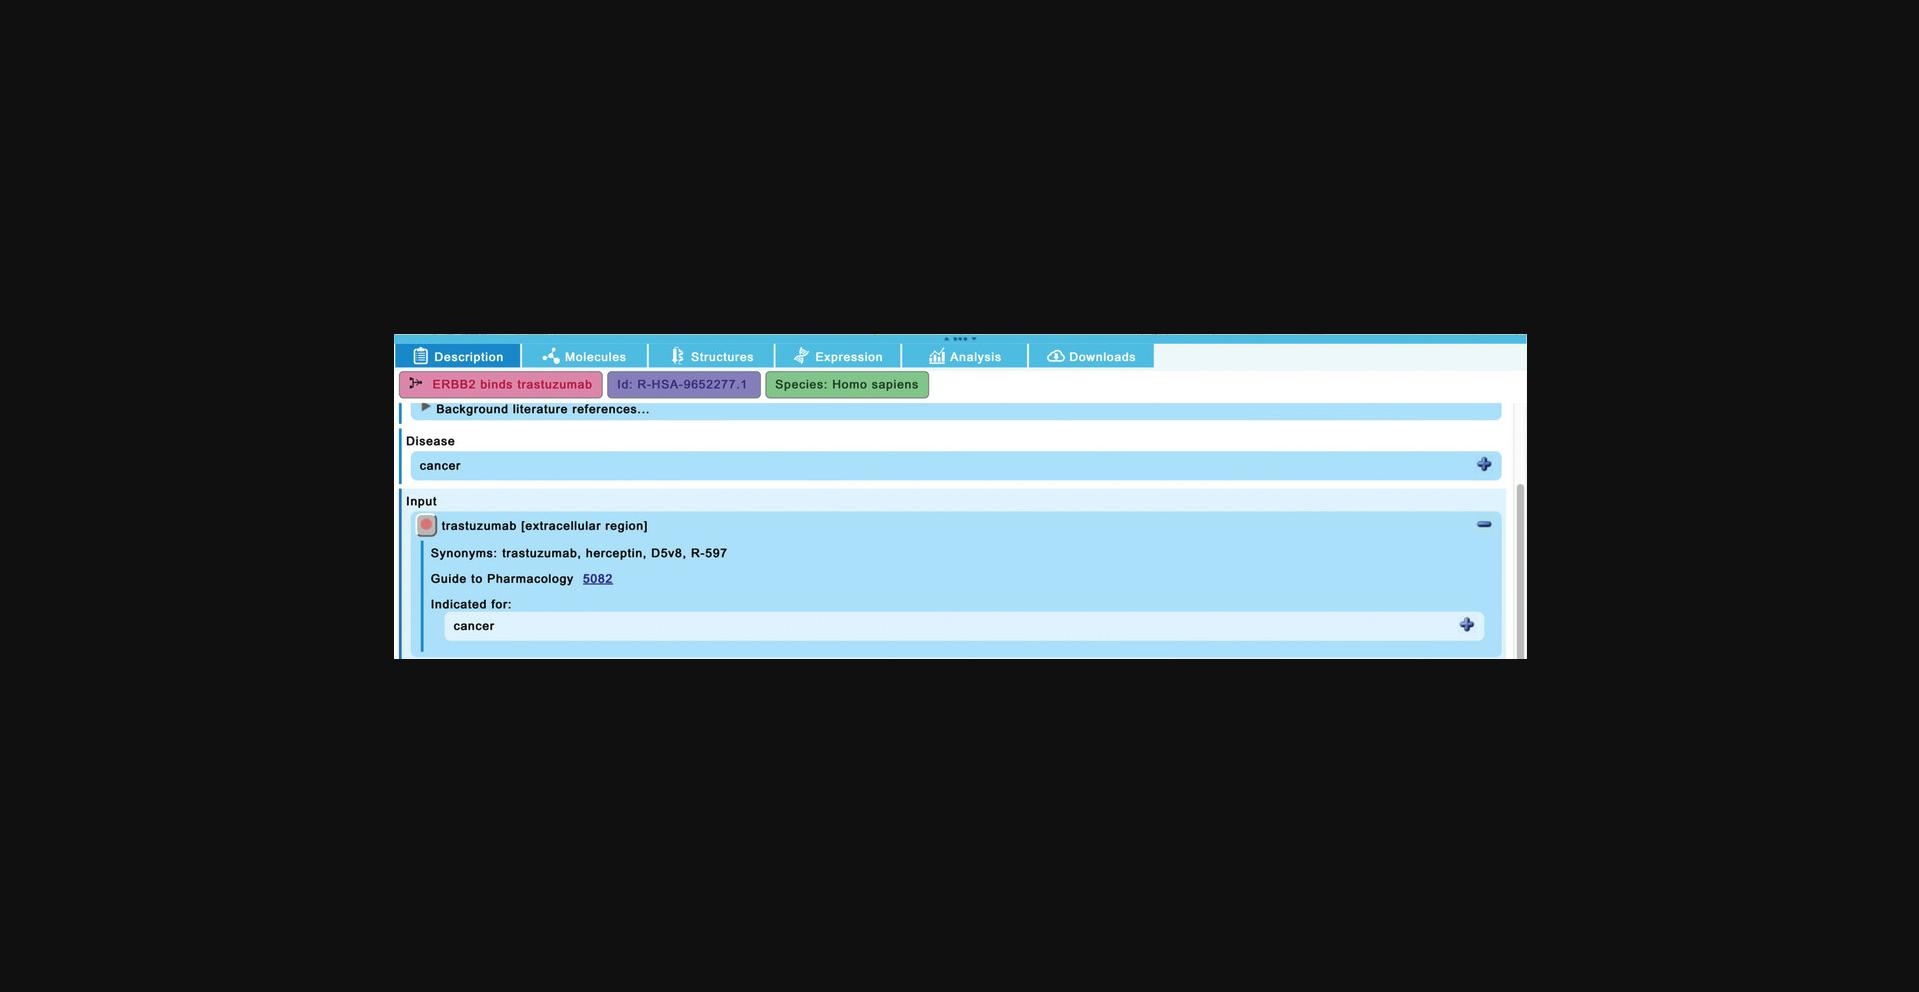
7.In the “Constitutive Signaling by Overexpressed ERBB2”, click on the reaction “ERBB2 binds trastuzumab”. Scroll down in the “Description” tab of the details panel and expand the field for the “trastuzumab” reaction input.
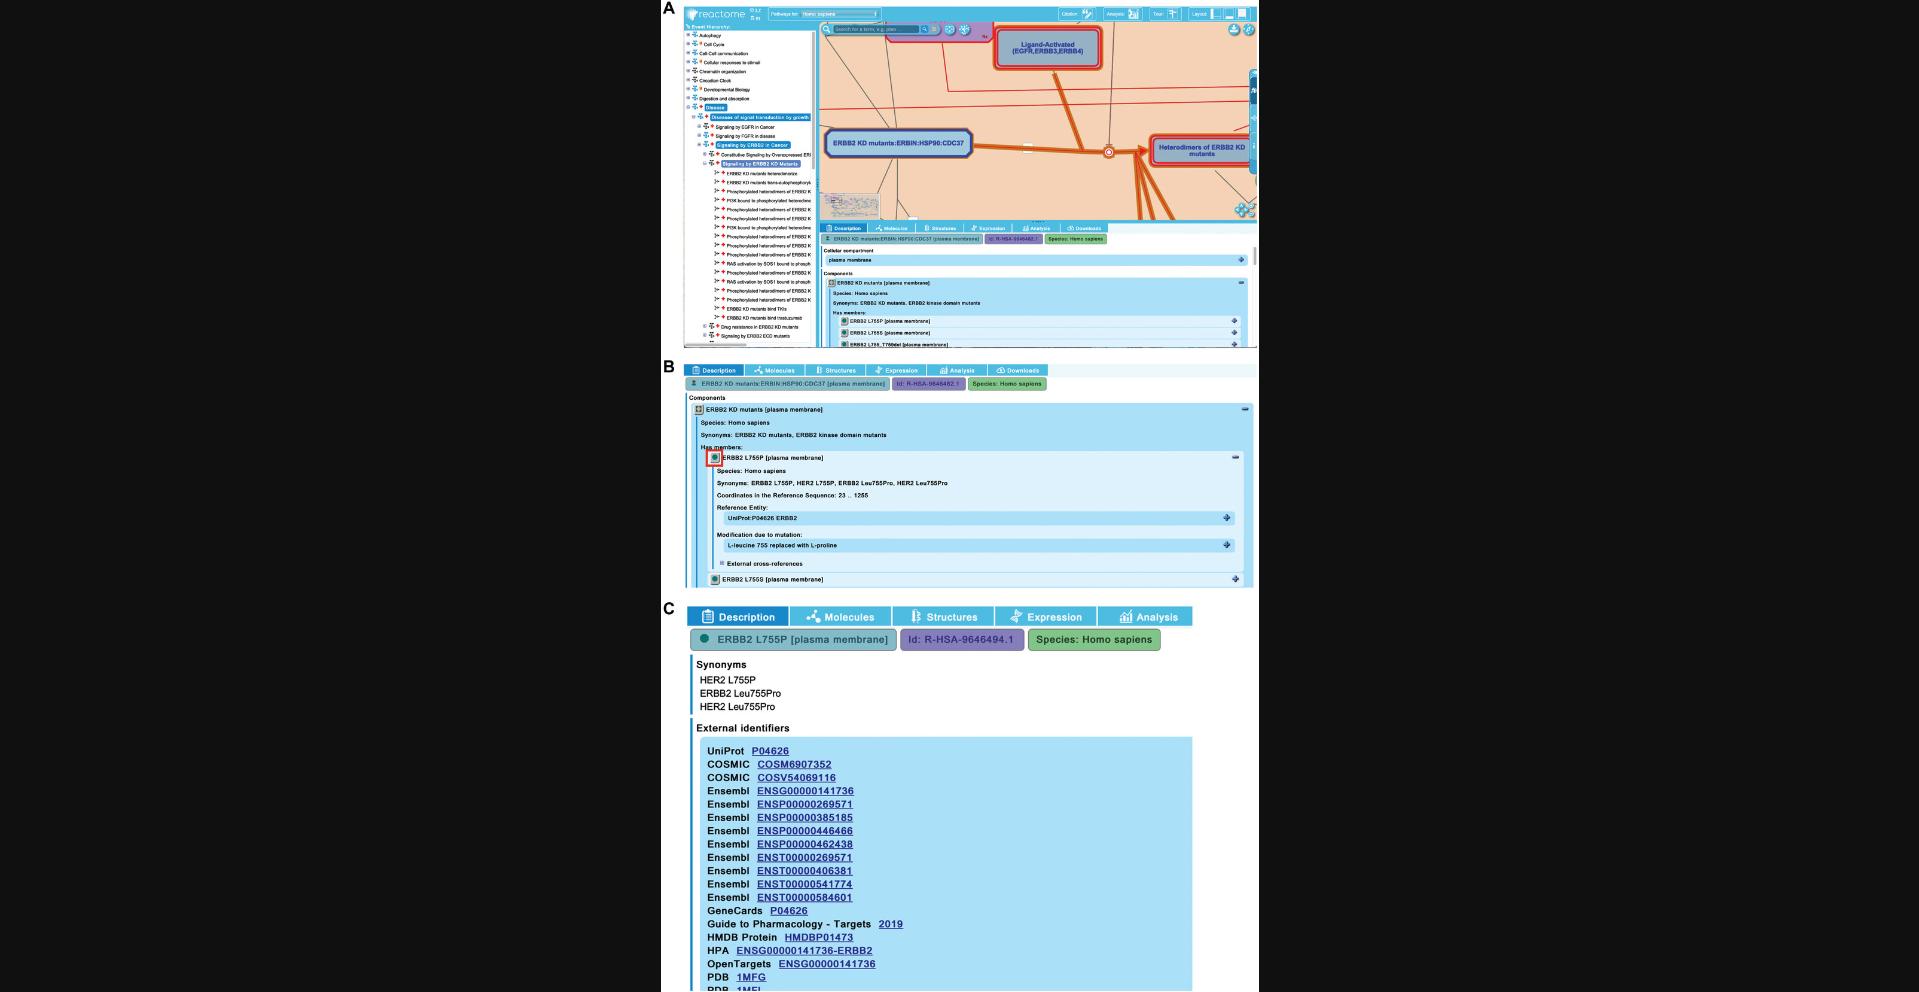
8.Reactome captures detailed molecular information about individual proteins that are implicated in abnormal biochemical reactions in disease. To explore this, unfurl the second pathway of “Signaling by ERBB2 in Cancer”, “Signaling by ERBB2 KD Mutants”, and click on the first reaction “ERBB2 KD mutants heterodimerize”.
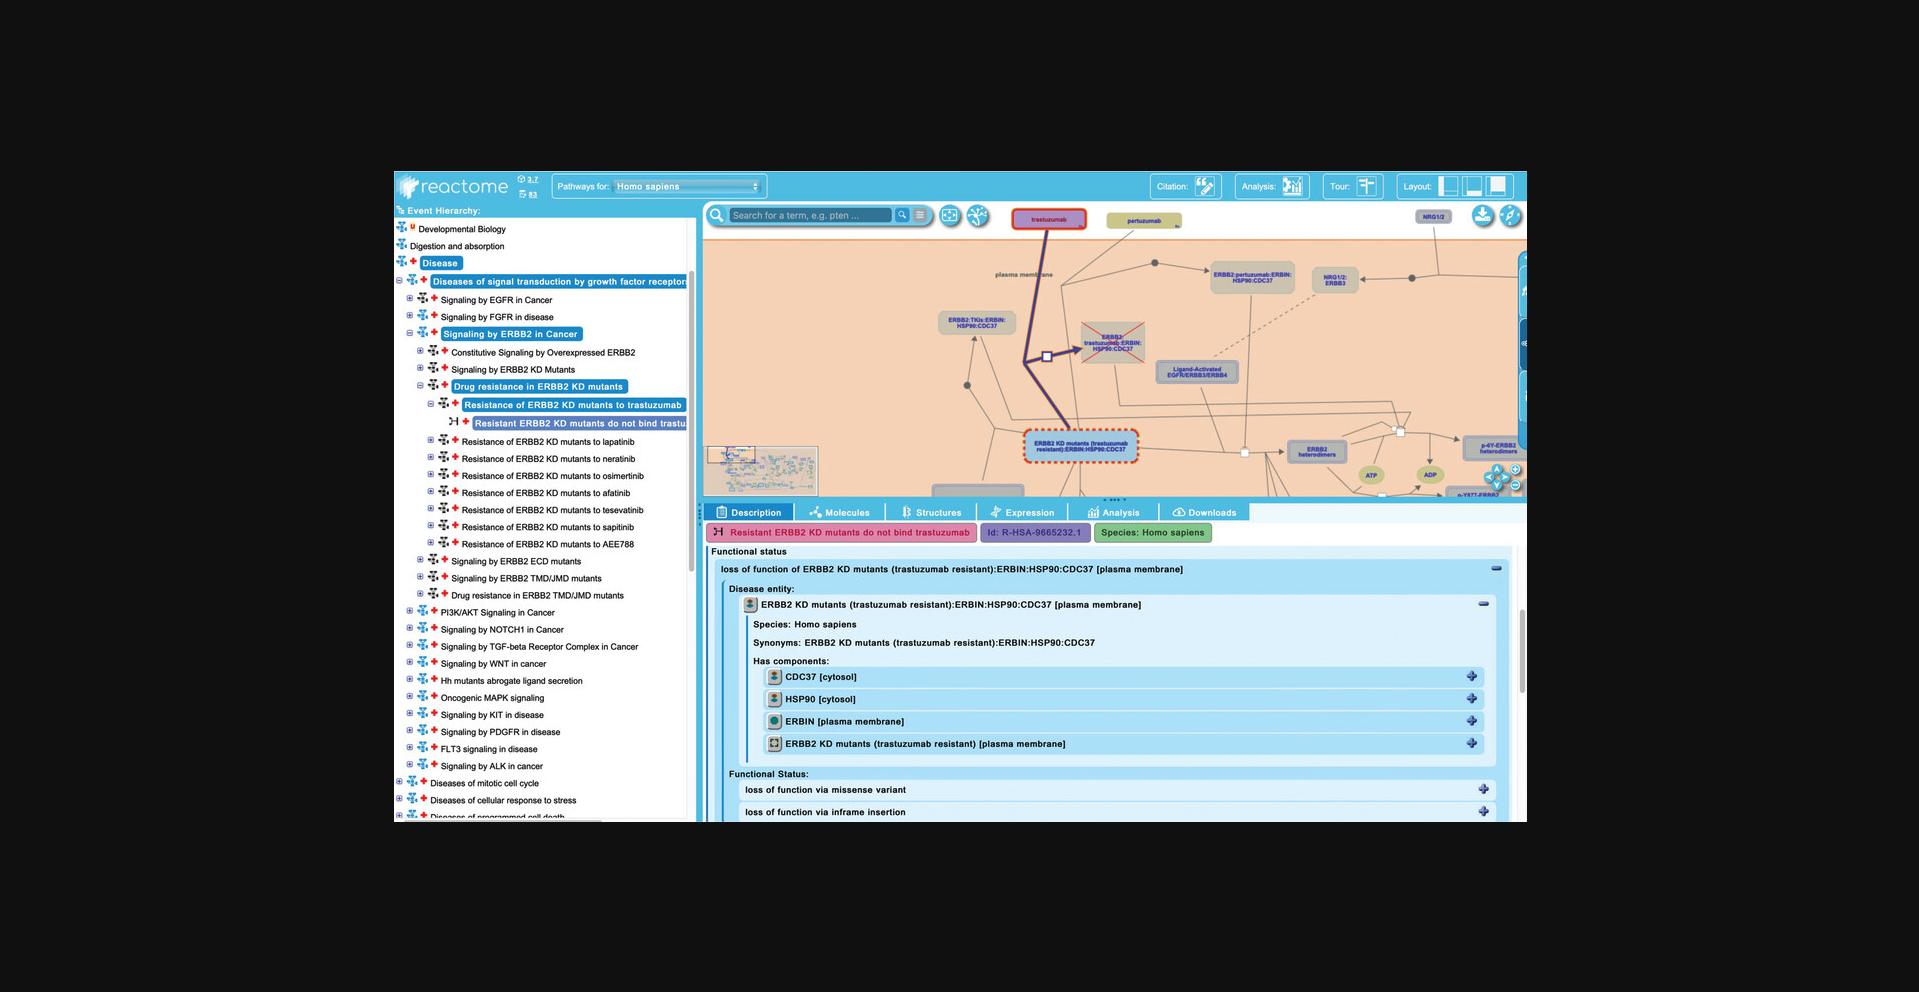
9.Reactome also annotates loss-of-function events, where a protein has lost all or most of its normal functional activity. To explore this, unfurl the third subpathway of “Signaling by ERBB2 in Cancer”, “Drug Resistance in ERBB2 KD mutants”. This reveals a further 8 subpathways, each describing the resistance of sets of ERBB2 KD mutants to 8 different drugs. Select the first pathway, “Resistance of ERBB2 mutants to trastuzumab” and unfurl that pathway to reveal the single “failed reaction”, “Resistant ERBB2 KD mutants do not bind trastuzumab” (Fig. 18).
10.Infectious processes are, by definition, novel events that do not occur in the absence of the initiating pathogen. As such, these are represented in their own diagrams with no corresponding normal pathway. In addition to annotating the infection process itself, Reactome also shows how these infectious agents modulate normal biological processes.
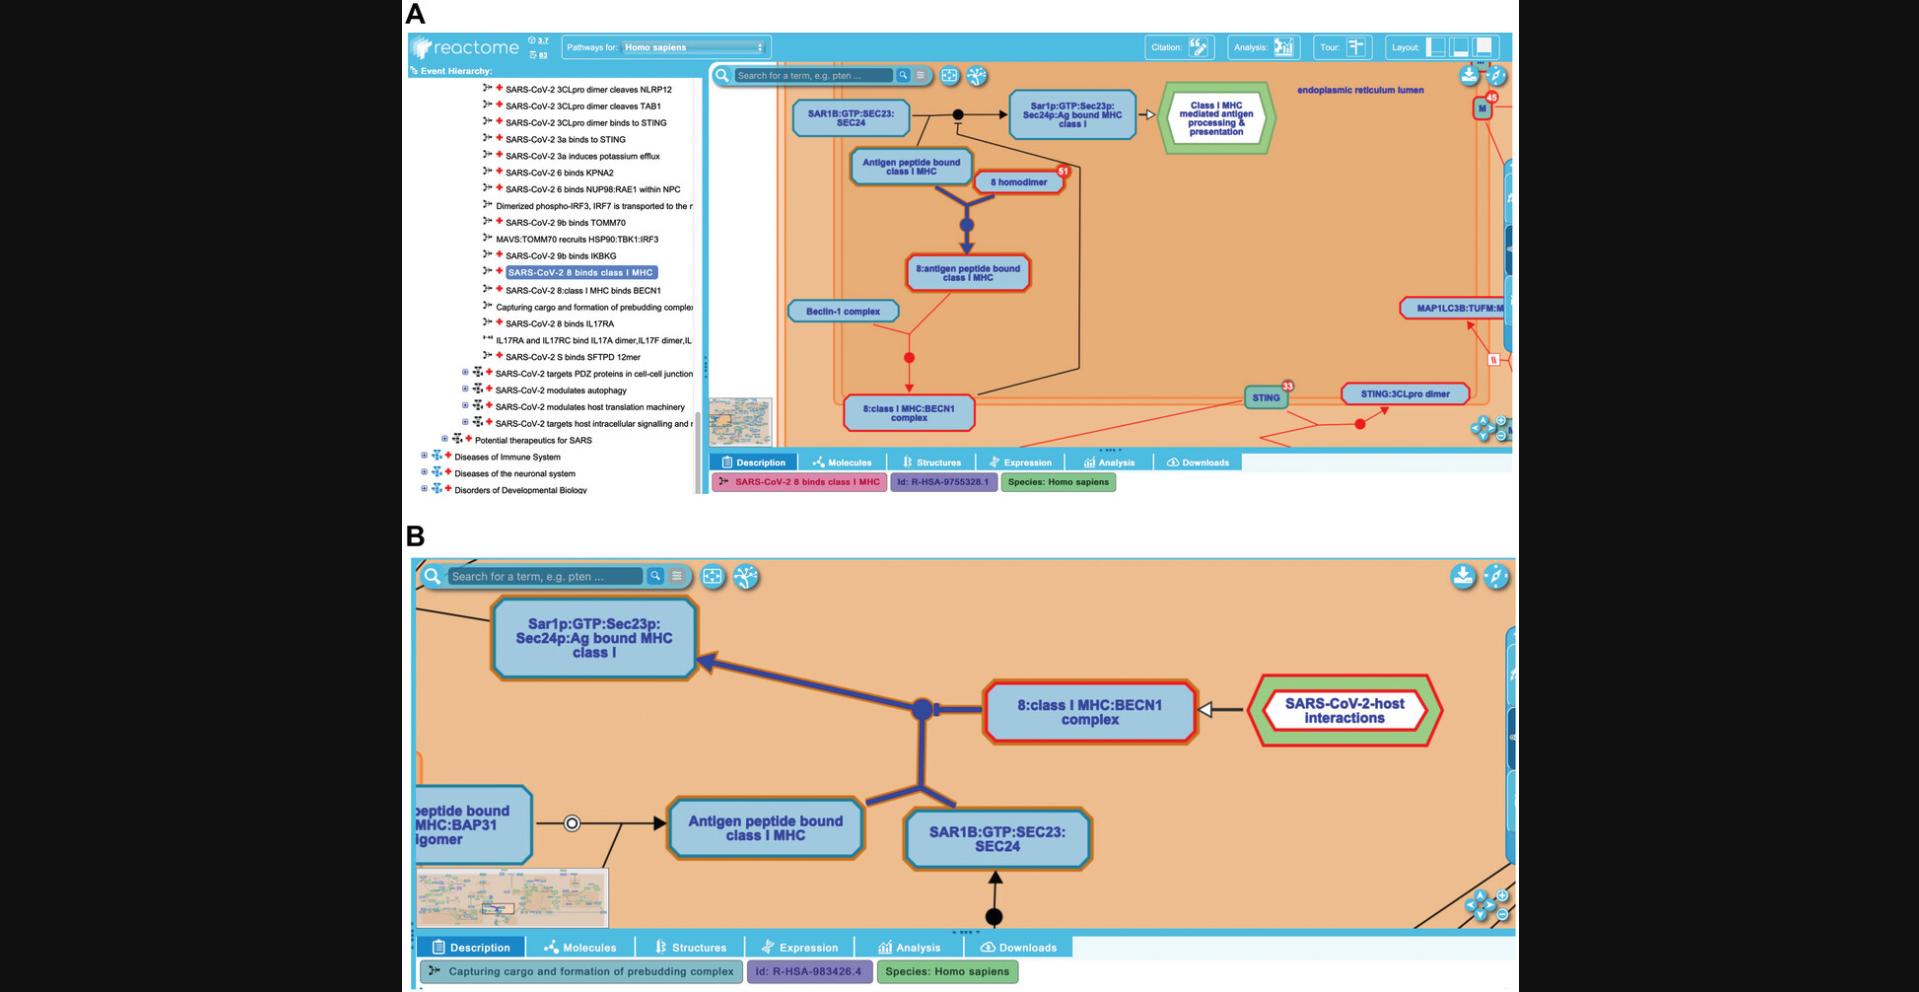
To explore this, unfurl the “Infectious disease” child of “Diseases”, then continue to unfurl “SARS-CoV Infections”, “SARS-CoV-2 Infection”, and “SARS-CoV-2-host interactions”. This reveals an ELV pathway diagram displaying five subpathways. Expand the subpathway “SARS-CoV-2 activates/modulates innate and adaptive immune responses” and click on the reaction “SARS-CoV-2 8 binds class I MHC”, shown in Figure 19A.
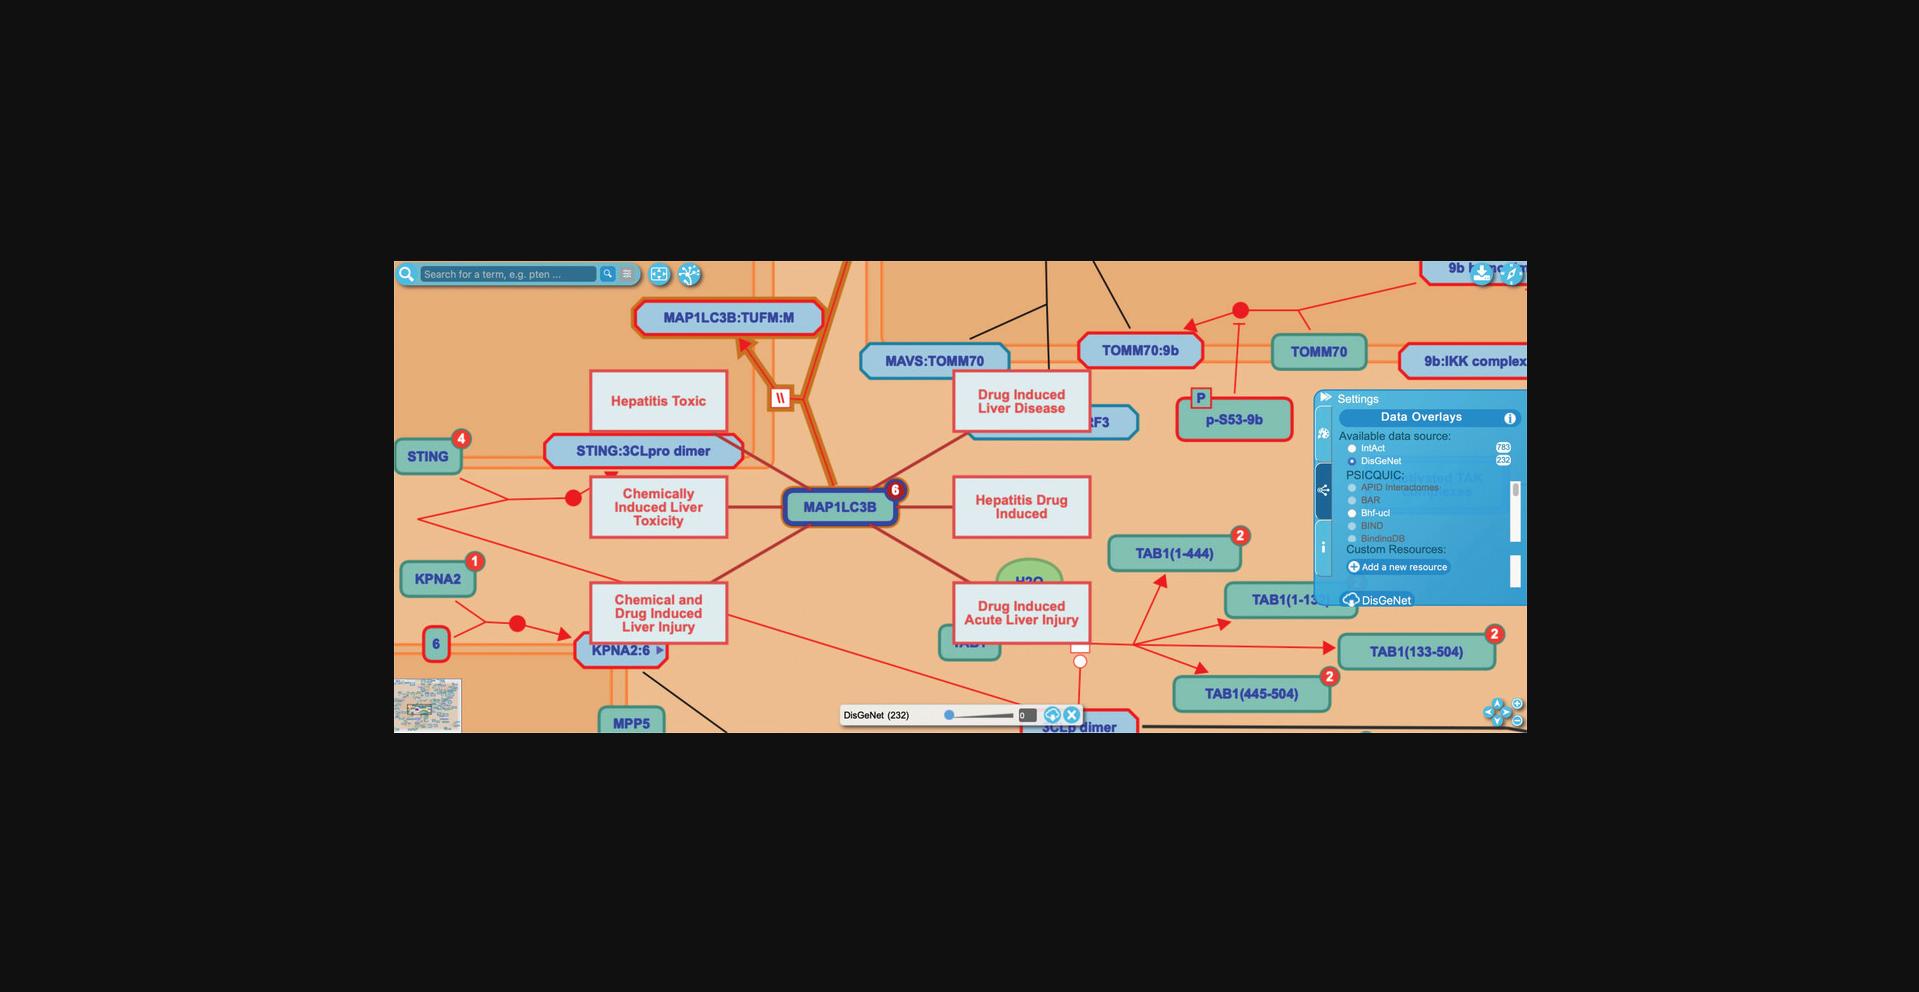
11.Reactome supplements its manual disease annotation with an overlay feature that makes use of data from DisGeNet, a public database of associations between human genes or variants and disease (Piñero et al., 2021). This overlay is similar to the protein interactor overlay from IntAct described in Basic Protocol 1, Step 10 and shown in Figure 9.
To explore this feature within the “SARS-CoV-2 host interactions” pathway diagram, open the interactive panel on the right side of the visualization panel, select the middle tab with the data overlay options, and select “DisGeNet” from the available data sources.
12.Navigate to the reaction “SARS-CoV-2 M protein bind MAP1LC3B” under the “SARS-CoV-2 modulates autophagy” subpathway and click on the red circle on the human protein input MAP1LC3B to reveal the six associated diseases, as shown in Figure 20.
Basic Protocol 3: FINDING THE PATHWAYS INVOLVING A GENE OR PROTEIN
This protocol will describe how to identify pathways and reactions that involve a gene or protein of interest. For the purposes of illustration, the cyclin-dependent kinase 7 gene will be used, which has the following identifiers:
| Protein product: | Common name: Cdk7 |
| UniProtKB (SwissProt): P50613 (CDK7_HUMAN) | |
| Gene: |
HGNC: 1778 Entrez Gene: 1022 |
| GenBank: NM_001799 | |
| Ensembl: ENSG00000134058. |
See Alternate Protocol 1 to search by a database accession number rather than by a common name.
Necessary Resources
Hardware
- Computer capable of supporting a Web browser and an Internet connection
Software
- Any modern Web browser such as Firefox, Safari, and Chrome will work to display Reactome Web pages
1.Point the browser to the Reactome home page at https://reactome.org.
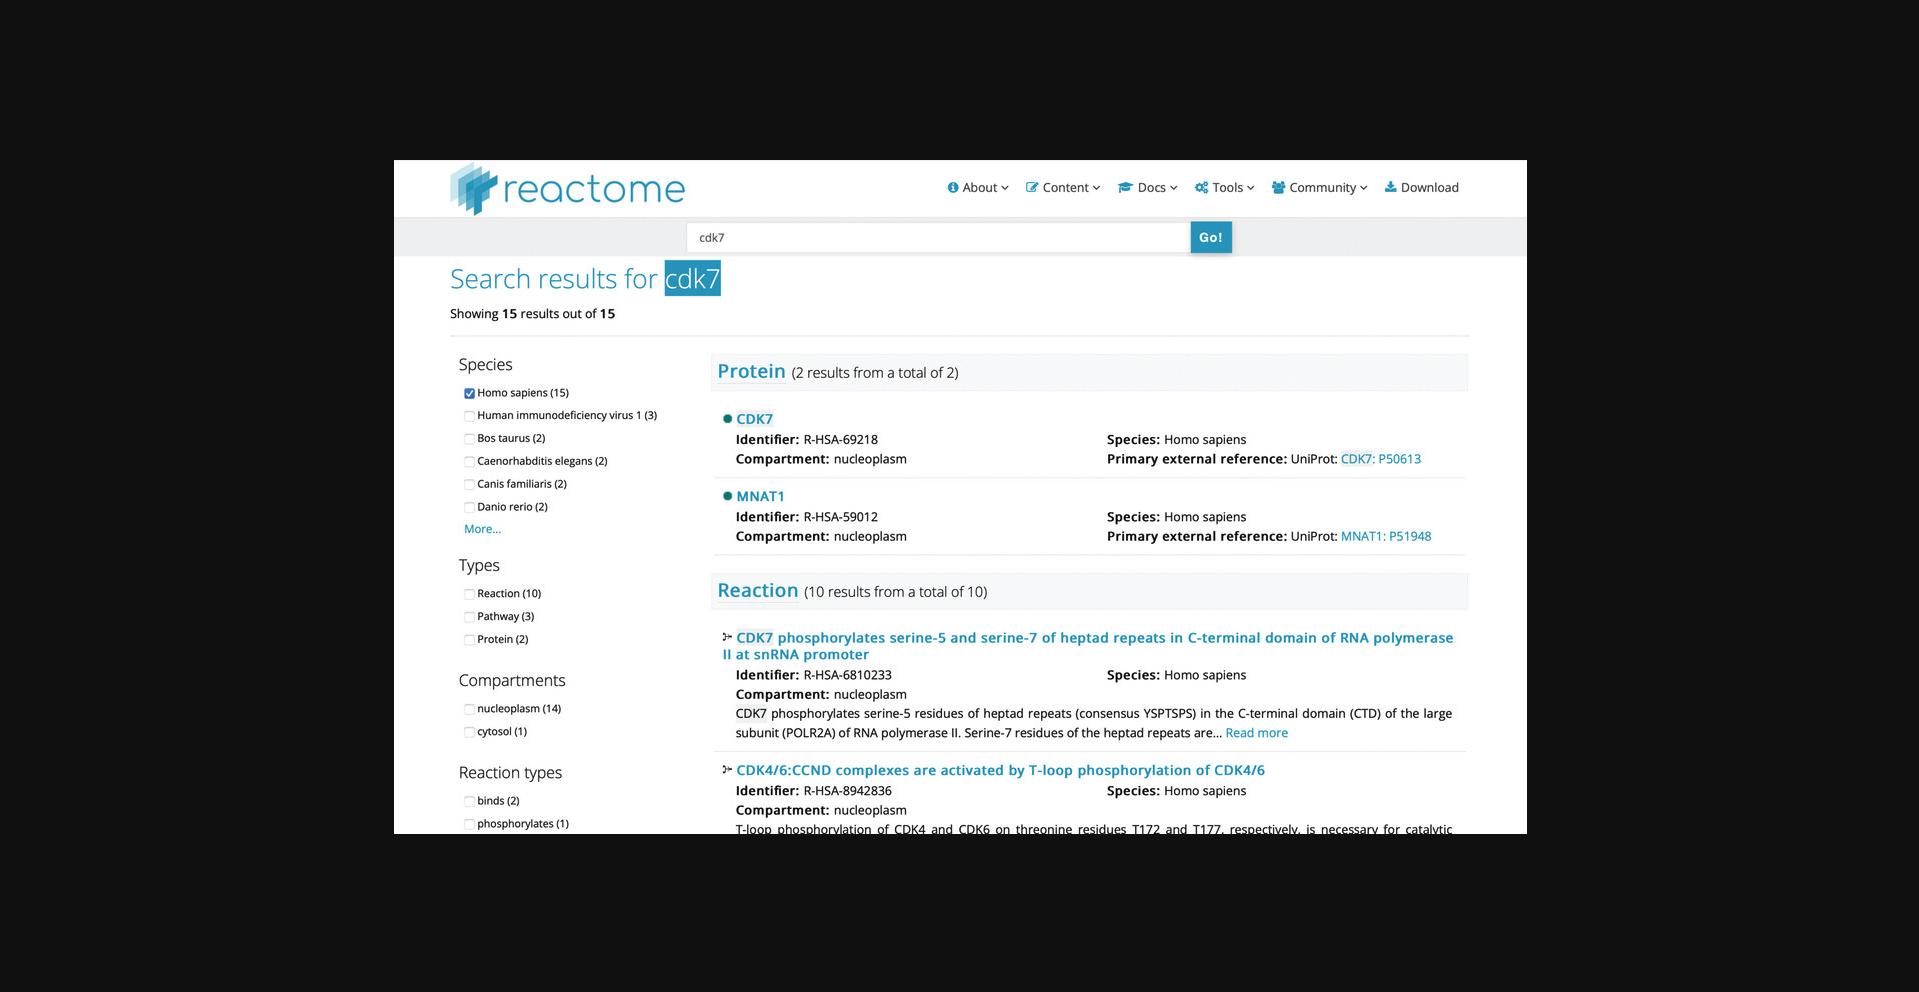
2.On the home page, in the search bar near the top of the page, click the text box, type CDK7, then press the “Go!” button. After a few seconds, you will be presented with a results page similar to Figure 21.
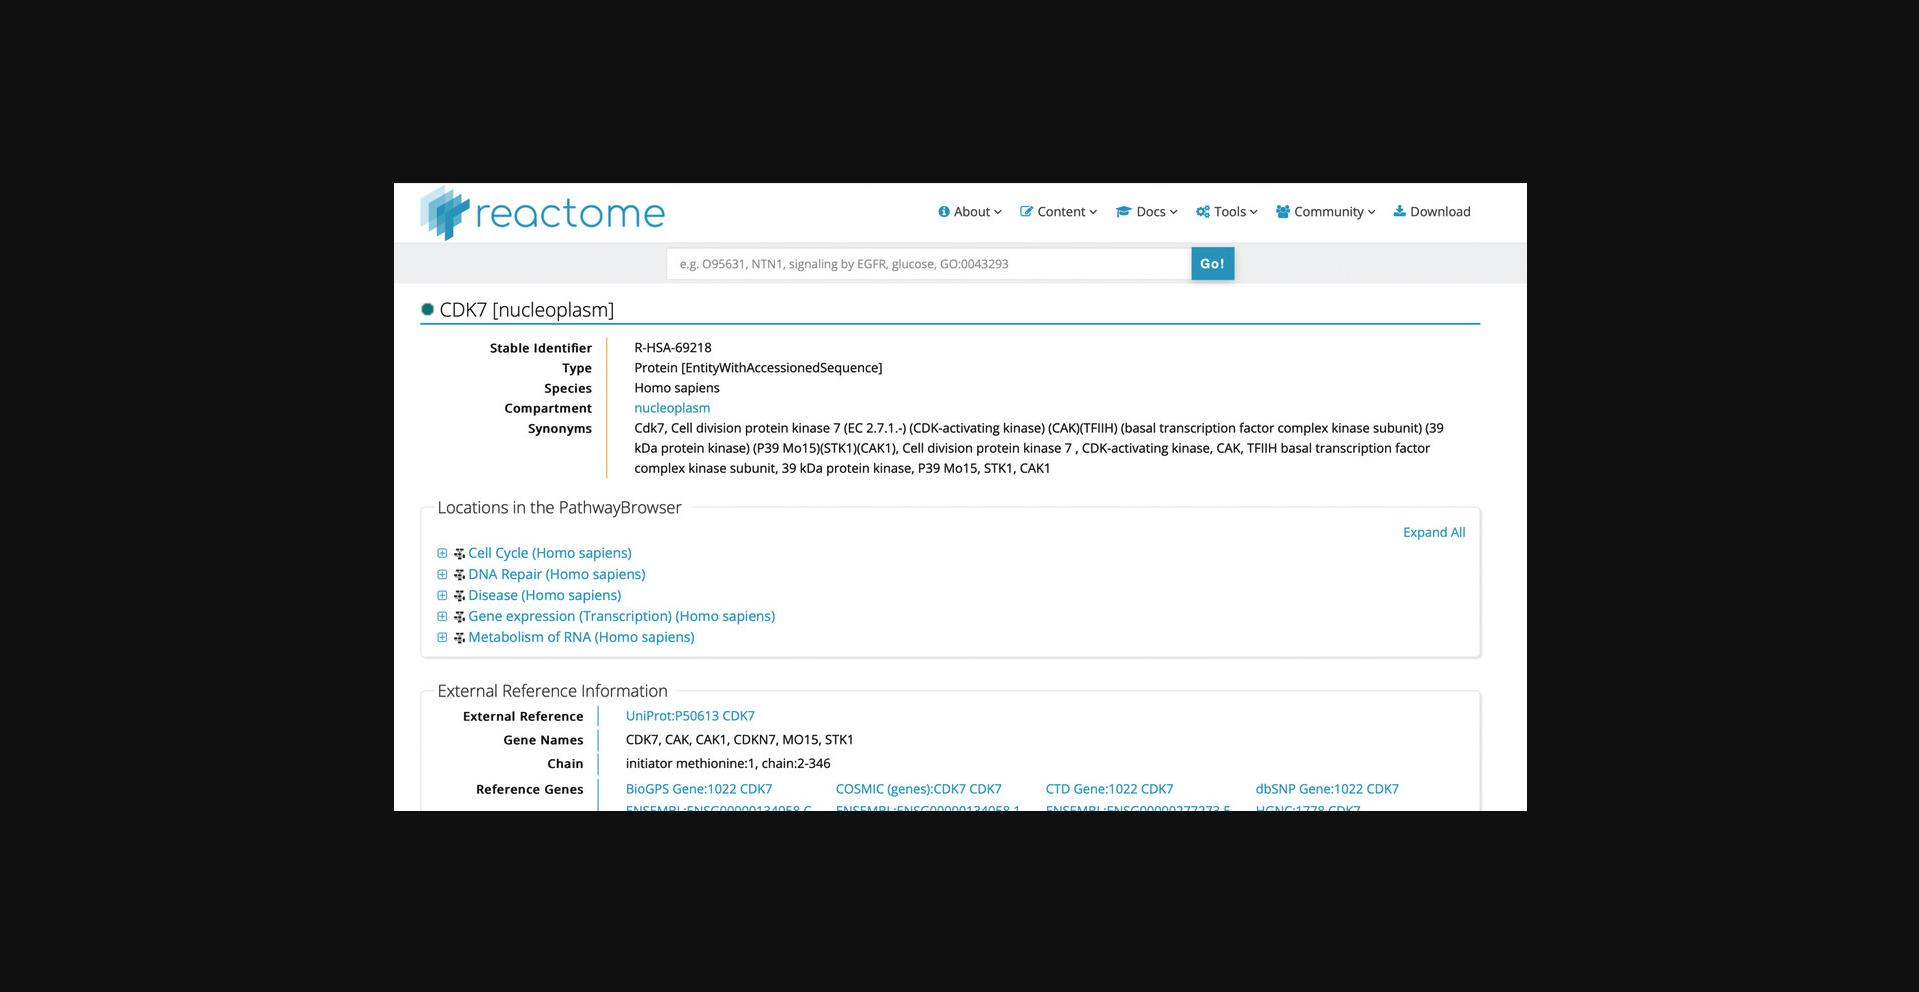
3.Click on the protein “CDK7” hit from the search results to reveal the page shown in Figure 22.
Alternate Protocol 1: FINDING THE PATHWAYS INVOLVING A GENE OR PROTEIN USING UniProtKB (SwissProt), ENSEMBL, OR ENTREZ GENE IDENTIFIER
Instead of searching for a gene or protein using its common name, as described in Basic Protocol 3, one may wish to use the accession number by which it is known in UniProtKB (SwissProt), GenBank, Ensembl, Entrez, or HGNC. The steps for doing so, using a UniProtKB (SwissProt) accession number, are presented here. The same procedure works for GenBank, Ensembl, Entrez or HGNC identifiers. Note that searching with an identifier rather than a gene name provides more targeted information about the protein of interest but does not identify locations in Reactome where the protein is mentioned in summations or synonyms, as described above in Basic Protocol 3.
Necessary Resources
Hardware
- Computer capable of supporting a Web browser and an Internet connection
Software
- Any modern Web browser such as Firefox, Safari, and Chrome will work to display Reactome Web pages
1.Point the browser to the Reactome home page at https://reactome.org.
2.On the home page, in the search bar near the top of the page, click the text box, type P50613, then press the “Go!” button.
3.Clicking on the CDK7 search result loads the reference entity page as shown in Figure 21.
Alternate Protocol 2: USING ADVANCED SEARCH
The simple searches shown in Basic Protocol 3 and Alternate Protocol 1 will suffice for many situations. However, the default search casts a very wide net and may return more hits than one wants. If this is the case, one may wish to use the Advanced Search, which gives much finer control over the search.
Necessary Resources
Hardware
- Computer capable of supporting a Web browser and an Internet connection
Software
- Any modern Web browser such as Firefox, Safari, and Chrome will work to display Reactome Web pages
1.Point the browser to the Reactome home page at https://reactome.org.
2.On the home page under the “Tools” in the Navigation bar, select “Advanced Data Search.”
Basic Protocol 4: USING THE REACTOME PATHWAY ANALYSIS TOOL TO IDENTIFY STATISTICALLY OVERREPRESENTED PATHWAYS
The Pathway Analysis tool allows one to analyze lists of genes, proteins or small molecules by providing services for ID mapping and pathway assignment and overrepresentation analysis. It is a powerful exploratory tool that is linked to the Reactome Pathway Browser. To illustrate how it works, this protocol will describe the analysis of a list of UniProtKB identifiers to identify enriched Reactome pathways.
Necessary Resources
Hardware
- Computer capable of supporting a Web browser and an Internet connection
Software
- Any modern Web browser such as Firefox, Safari, and Chrome will work to display Reactome Web pages
1.Point the browser to the Reactome home page at https://reactome.org.
2.Click on the “Analysis Tools” button on the home page; alternately, select “Analyse gene list” from under the “Tools” dropdown menu in the home page header.
3.Select the UniProtKB accession list sample data from the panel at the right of the analysis window and click the “Continue” button.
4.This moves the analysis panel to the “Options” step, where “project to human” is checked by default. In this mode, any non-human identifiers are converted by the analysis service to their human equivalents. The second option “include interactors” is by default left unchecked; if this option is selected, the analysis will include protein-protein interactions from the IntAct database for all proteins in all pathways, increasing the potential coverage with the query.
Leaving these options set at their default values, click “Analyse!” to reveal the overrepresentation analysis overlaid on the Pathway Overview diagram, as shown in Figure 23.
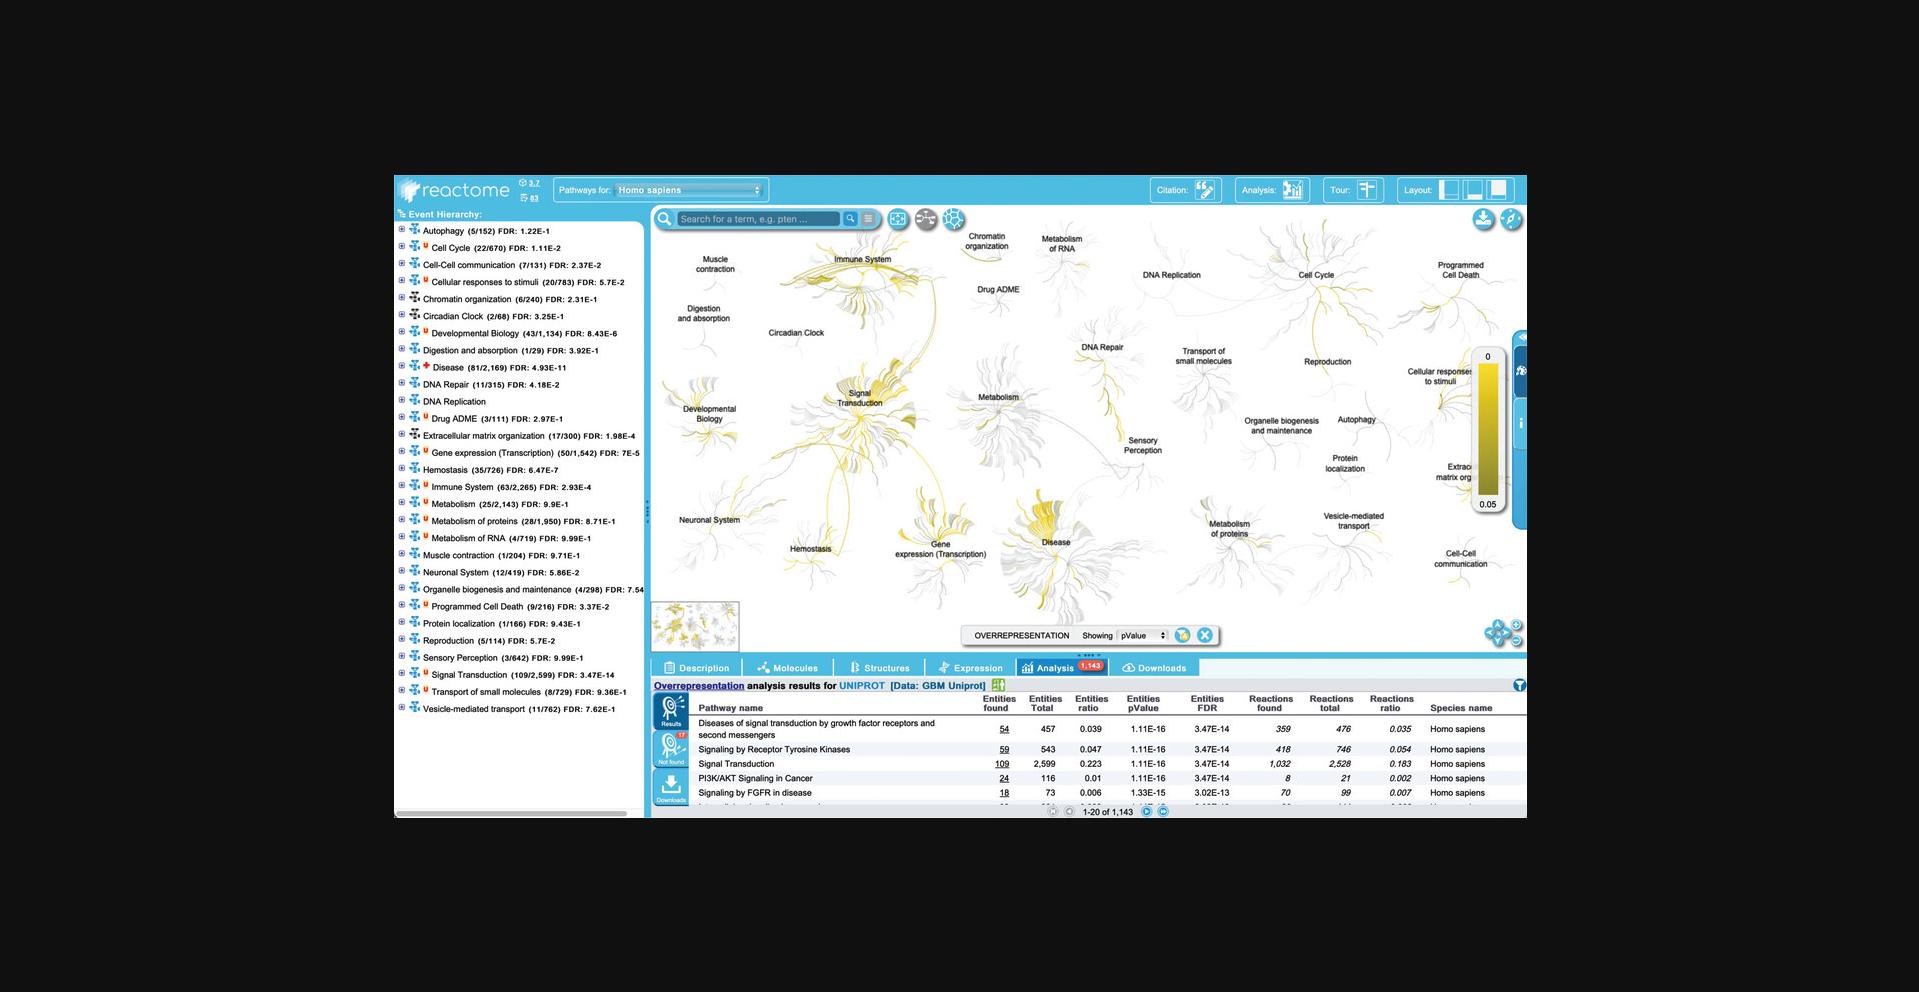
5.Results can be filtered to allow users to customize results based on resource (in cases where the data set contains IDs from multiple resources—in this case, this filter is not relevant because all the IDs in the submitted data set are from UniProtKB). Results can also be filtered on the basis of pathway size, species, p -value, and to include or exclude disease pathways.
Make use of this feature to hide disease pathways from the results, as follows: click on the funnel displayed at the top right of the ranked pathways list in the “Analysis” tab of the Details panel, unchecked the default option “Include disease pathway in the results”, and click apply. The filter can be removed again by clicking on the “x” at the bottom right of the ranked pathway list in the details panel.
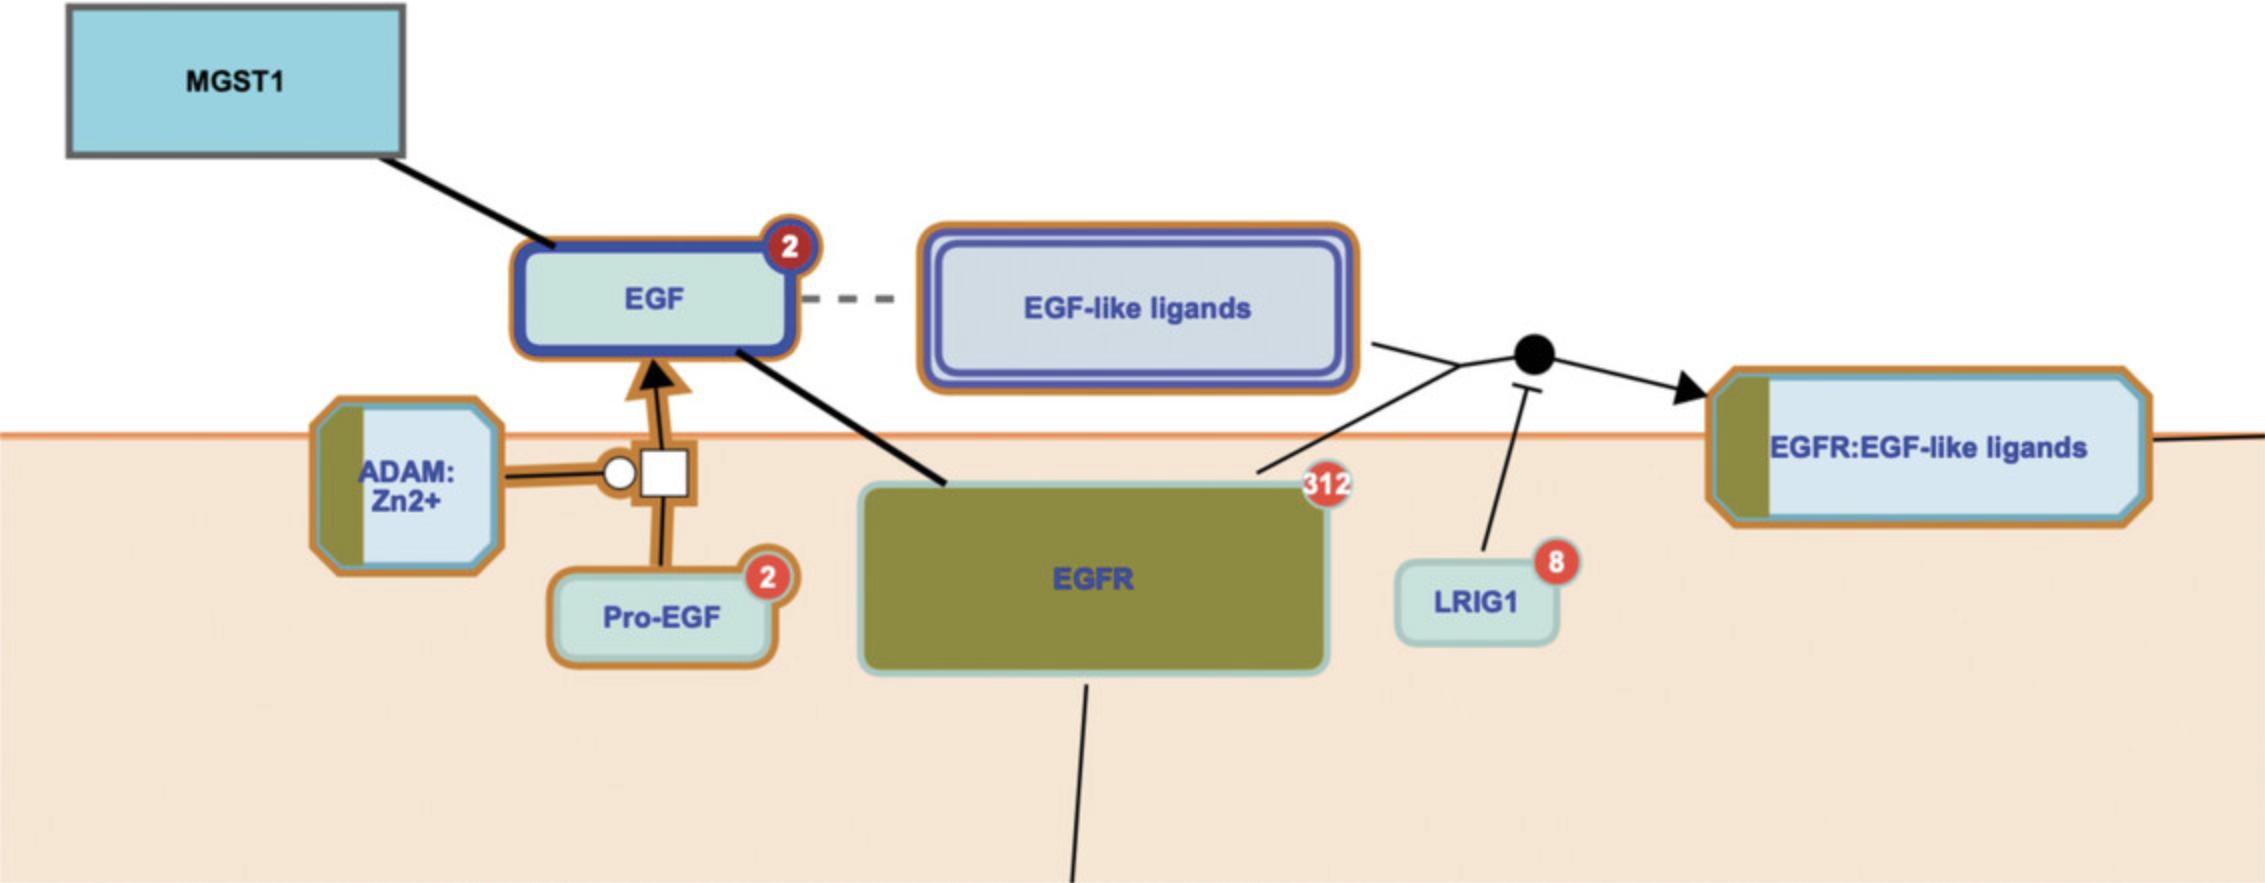
6.The analysis view provides an overview of all the Reactome pathways at once. To see the details of a specific pathway, double click on the node representing the pathway in the ranked list or in the hierarchy. To see this, click on the top pathway, “Signaling by Receptor Tyrosine Kinases”.
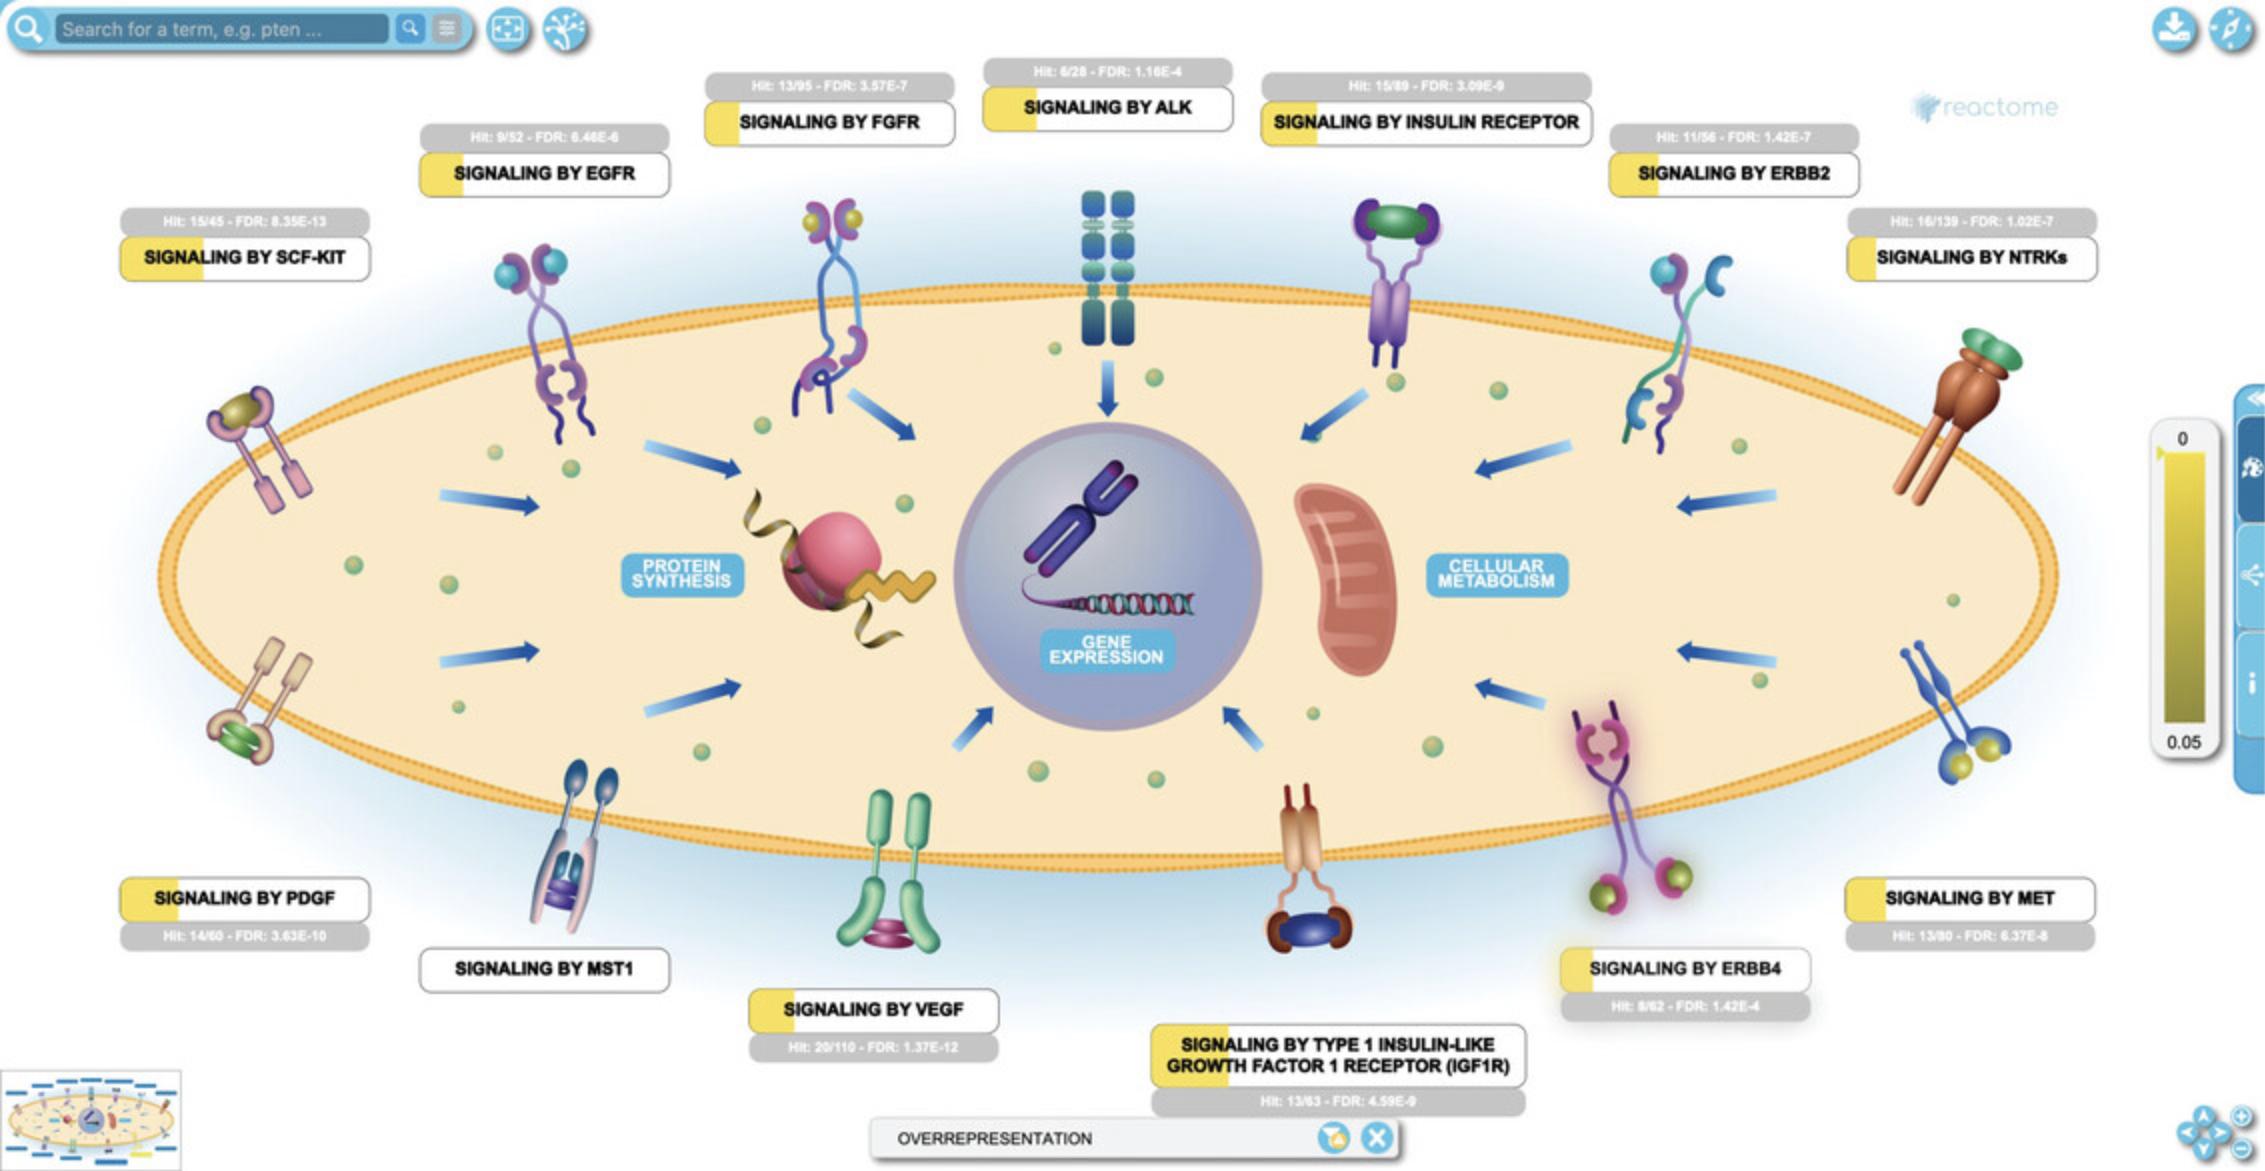
7.Click on the subpathway “Signaling by EGFR” to reveal the reaction-level diagram.
Basic Protocol 5: USING THE REACTOME PATHWAY ANALYSIS TOOL TO OVERLAY EXPRESSION DATA ONTO REACTOME PATHWAY DIAGRAMS
There are two ways to analyze gene expression data in Reactome. The first method, described in this section, uses an appropriately formatted data set uploaded into the ‘Analyze Gene List’ tool described in Protocol 3 above for Overrepresentation analysis.
The second way to analyze gene expression data in Reactome makes use of the Reactome Gene Set Analysis (Reactome GSA) tool, accessed through the “Analyze Gene Expression” button after “Analysis” is selected from the home page. Reactome GSA performs quantitative pathway analyses, increasing the statistical power of the differential gene expression analysis. This tool is out of scope for this tutorial, but is described in detail in the corresponding publication (Griss et al., 2020) and on the Reactome Web site under “Docs”, “User guide”, “Analysis Tools”, “Analysis Gene Expression”).
Necessary Resources
Hardware
- Computer capable of supporting a Web browser and an Internet connection
Software
- Any modern Web browser such as Firefox, Safari, and Chrome will work to display Reactome Web pages
1.Point the browser to the Reactome home page at https://reactome.org.
2.Click on the “Analysis Tools” button on the home page; alternately, select “Analyse gene list” from under the “Tools” dropdown menu in the home page header to open the submission form as described in Basic Protocol 3.
3.Ensure the “Analyse gene list” tool is selected (this is the default tool) and click on the sample data set “Microarray data” from the panel at the right.
4.Click “Continue” after selecting the Microarray data set, and click “Analyse!” from the Options panel, keeping the default settings of “Project to human” checked and “Include Interactors” unchecked.
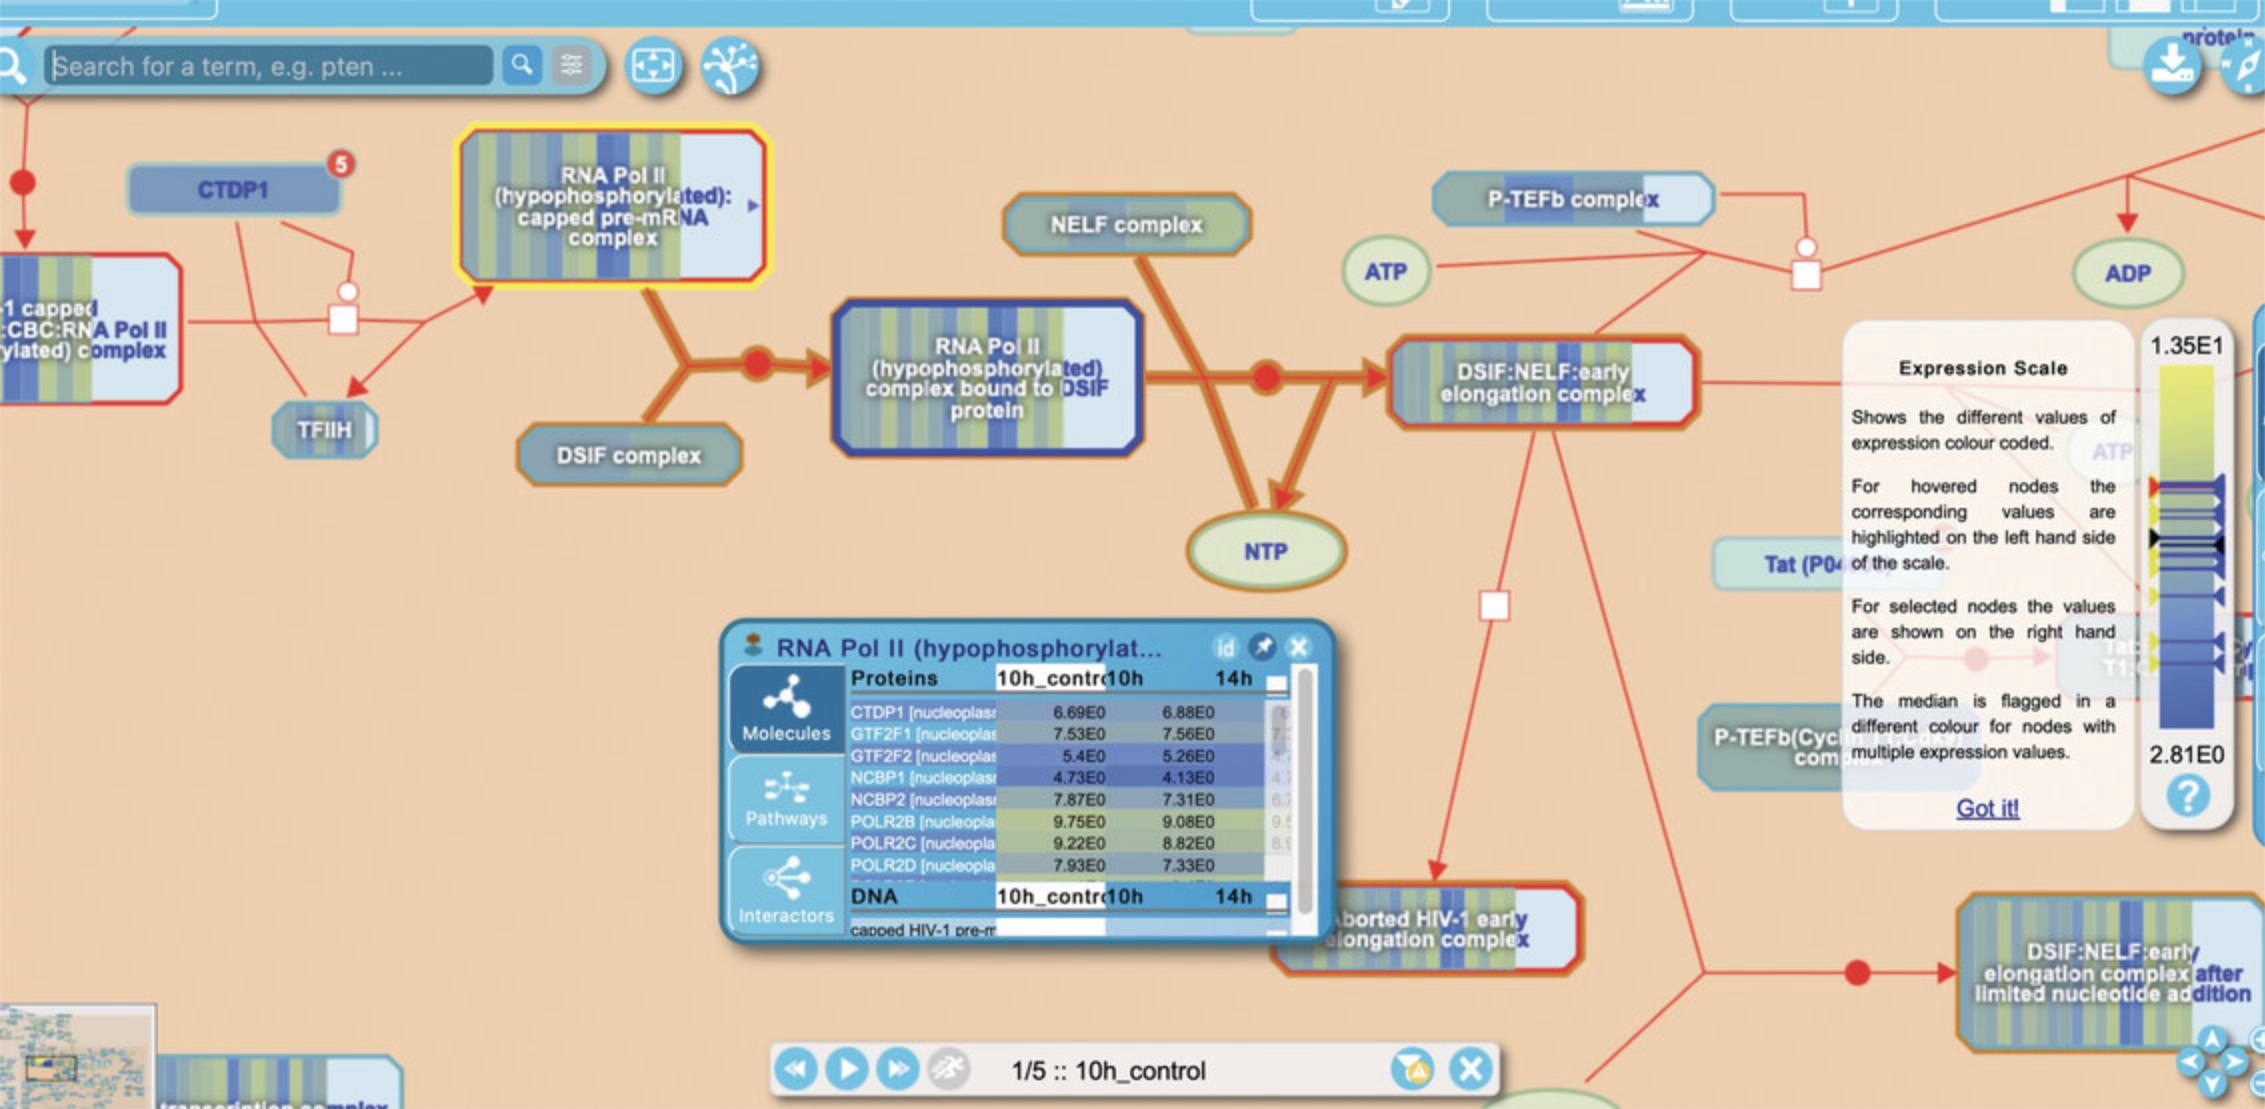
1.- The details panel has additional columns to the right of those described for Overrepresentation, above. These columns contain the submitted expression values or other numerical data. 2.- The “Overrepresentation/pathway coverage” toggle in the bottom of the visualization panel has been replaced by a control panel allowing the user to step forward or backward through the columns of data; alternately, the play button may be selected and the series will be shown automatically. The color overlay on the Pathway Overview is adjusted accordingly.
5.Select the top hit from the details panel “Formation of the HIV-1 Early Elongation Complex” to open the reaction-level diagram.
Basic Protocol 6: COMPARING INFERRED MODEL ORGANISM AND HUMAN PATHWAYS USING THE SPECIES COMPARISON TOOL
The comparative analysis of pathways and biological processes offers important information on their evolution and supports metabolic engineering and the study of human disease. Reactome uses manually curated human pathways to electronically infer equivalent events in 15 other species. The Species Comparison tool allows users to compare the predicted model organism pathways with human ones to find pathways conserved (or not) between both species.
Necessary Resources
Hardware
- Computer capable of supporting a Web browser and an Internet connection
Software
- Any modern Web browser such as Firefox, Safari, and Chrome will work to display Reactome Web pages
1.Point the browser to the Reactome home page at https://reactome.org.
2.Click on the “Analysis Tools” button on the home page and click on the third tool “Species Comparison” to launch the data selection page for the Species Comparison Analysis. Alternatively, select “Species Comparison” from under the “Tools” dropdown menu in the home page header and click on the “Species Comparison” button to the left of the analysis window (note that the “Analyse gene list” tool is selected by default).
3.On the “Species Comparison” page is a selection tool that reveals a drop-down list of species. Select species “Mus musculus” from the drop-down menu and click the “Go!” button to reveal the Reactome-wide pathway conservation data.
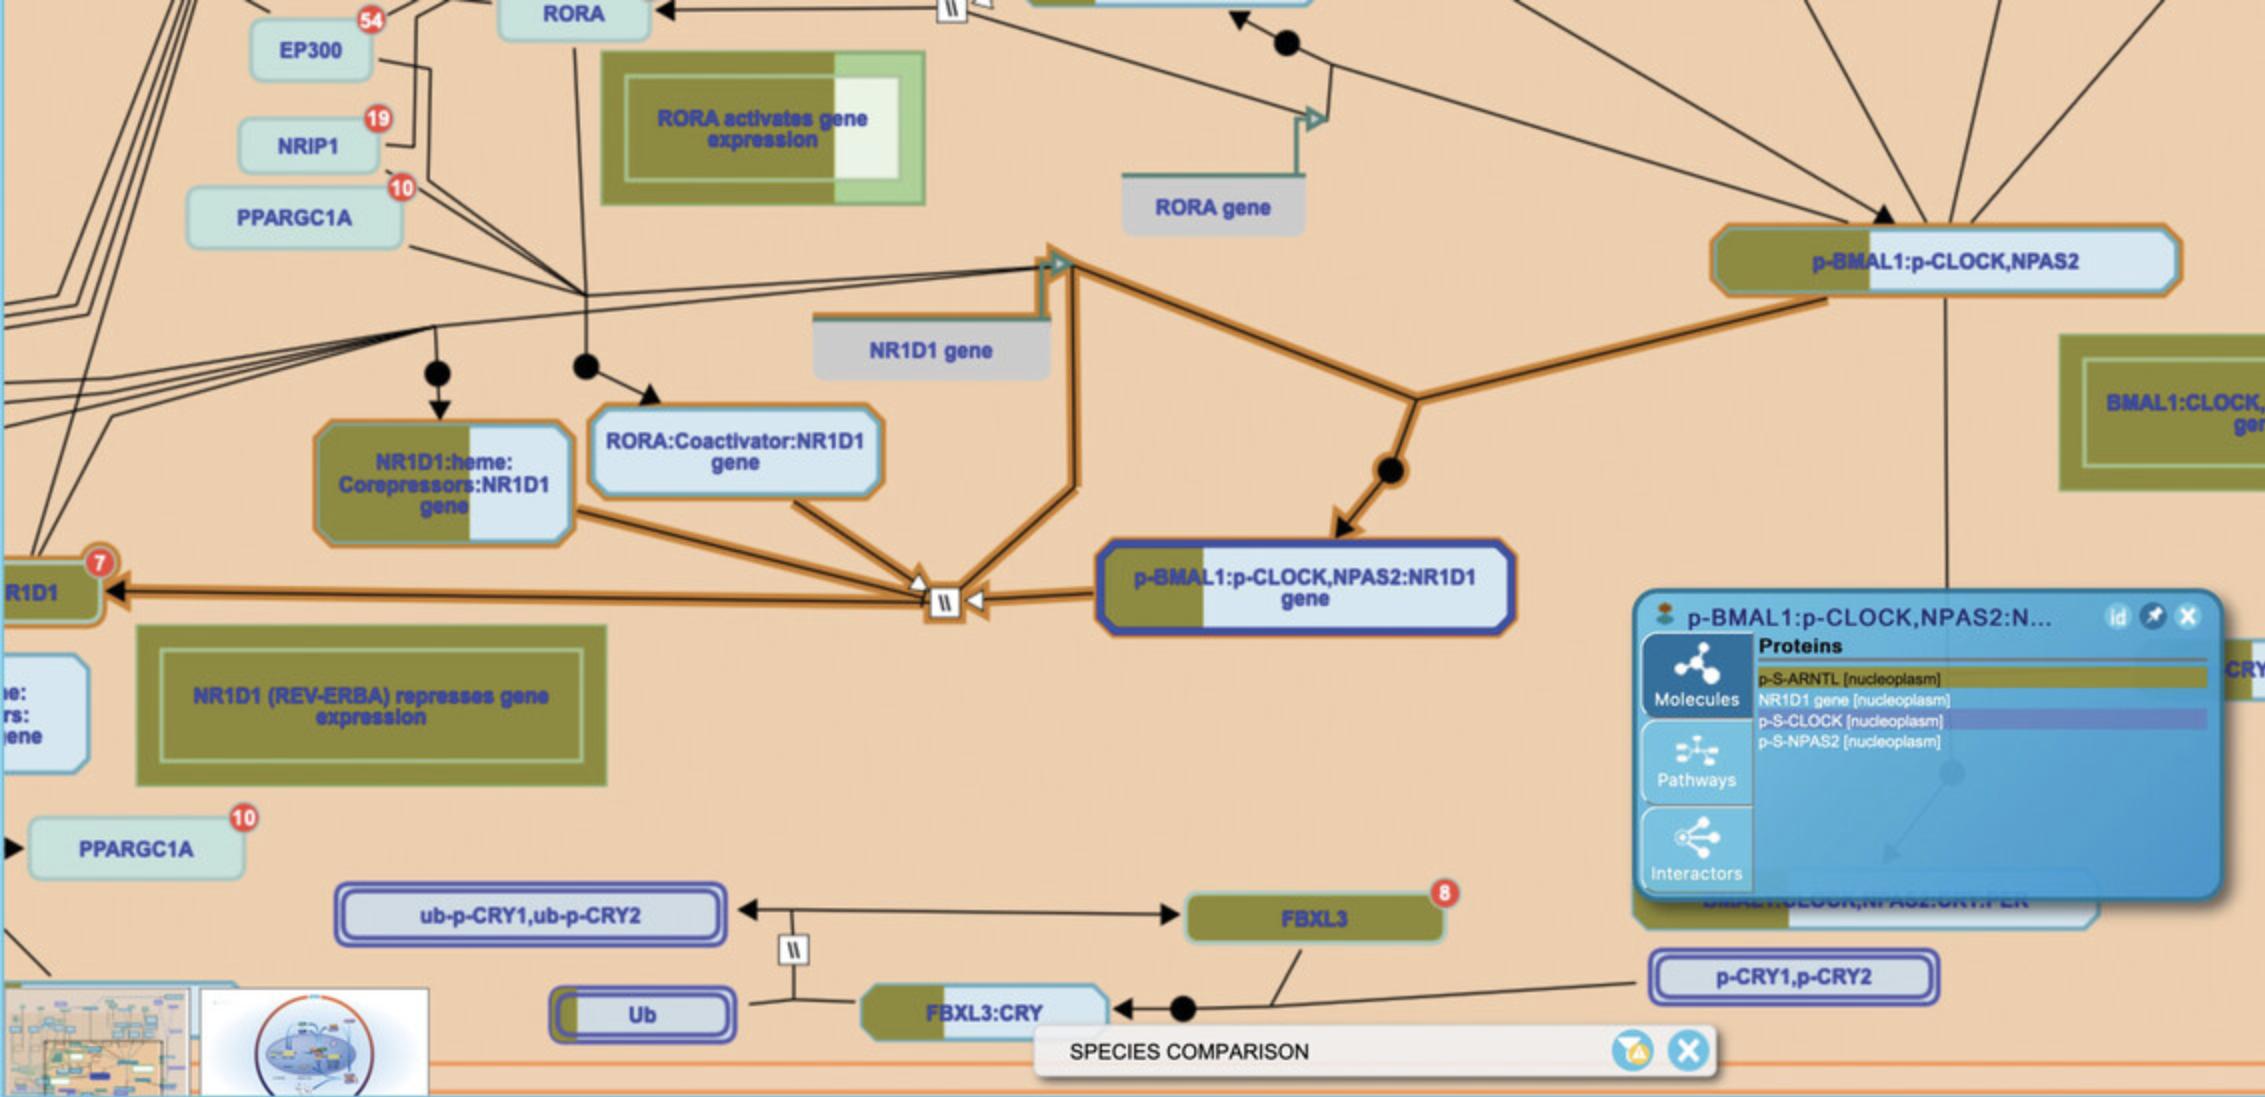
4.Click on “Circadian Clock” in the pathway hierarchy to open the reaction-level diagram. Entities are colored according to their conservation in mouse as described above. Clicking on the small arrowhead at the right of the icon for a set or complex reveals the Contextual Information Panel (CIP), which provides inference detail on each of the components of the entity, as shown in Figure 27.
Basic Protocol 7: COMPARING TISSUE-SPECIFIC EXPRESSION USING THE TISSUE DISTRIBUTION TOOL
Currently, reactions in Reactome represent events that occur within a generic human cell. To facilitate analysis of tissue specific expression, protein expression data has been imported from Human Protein Atlas for overlay on Reactome data. The HPA data reflects the expression of the protein-coding genes in 44 different human tissues and can be visualized through the “Tissue Distribution” analysis tools.
Necessary Resources
Hardware
- Computer capable of supporting a Web browser and an Internet connection
Software
- Any modern Web browser such as Firefox, Safari, and Chrome will work to display Reactome Web pages
1.Point the browser to the Reactome home page at https://reactome.org.
2.Click on the “Analysis Tools” button on the home page and click on the fourth tool “Tissue Distribution” to launch the data selection page for the analysis. Alternatively, select “Tissue Distribution” from under the “Tools” dropdown menu in the home page header and click on the “Tissue Distribution” button to the left of the analysis window (note that the “Analyse gene list” tool is selected by default).
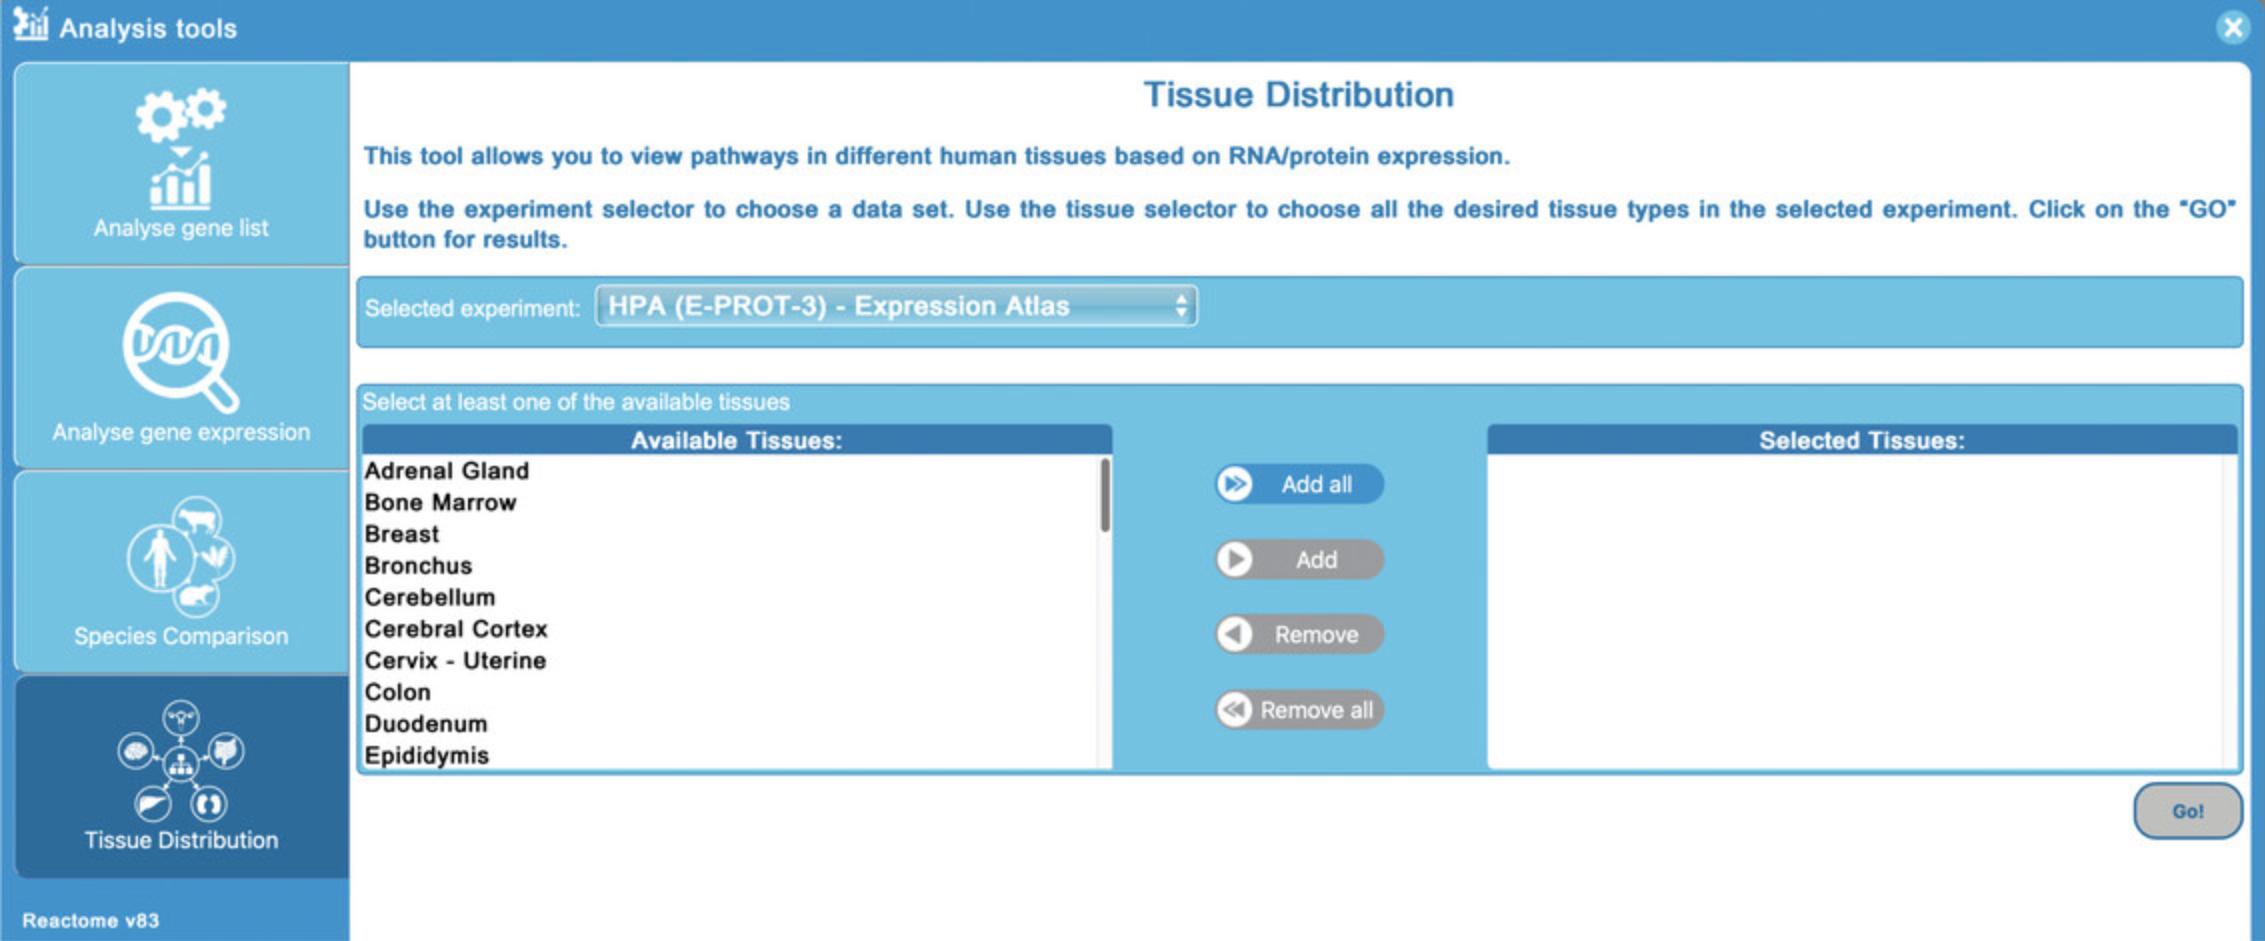
3.For this protocol, select all the tissues using the “Add all” button, and then click “Go!”.
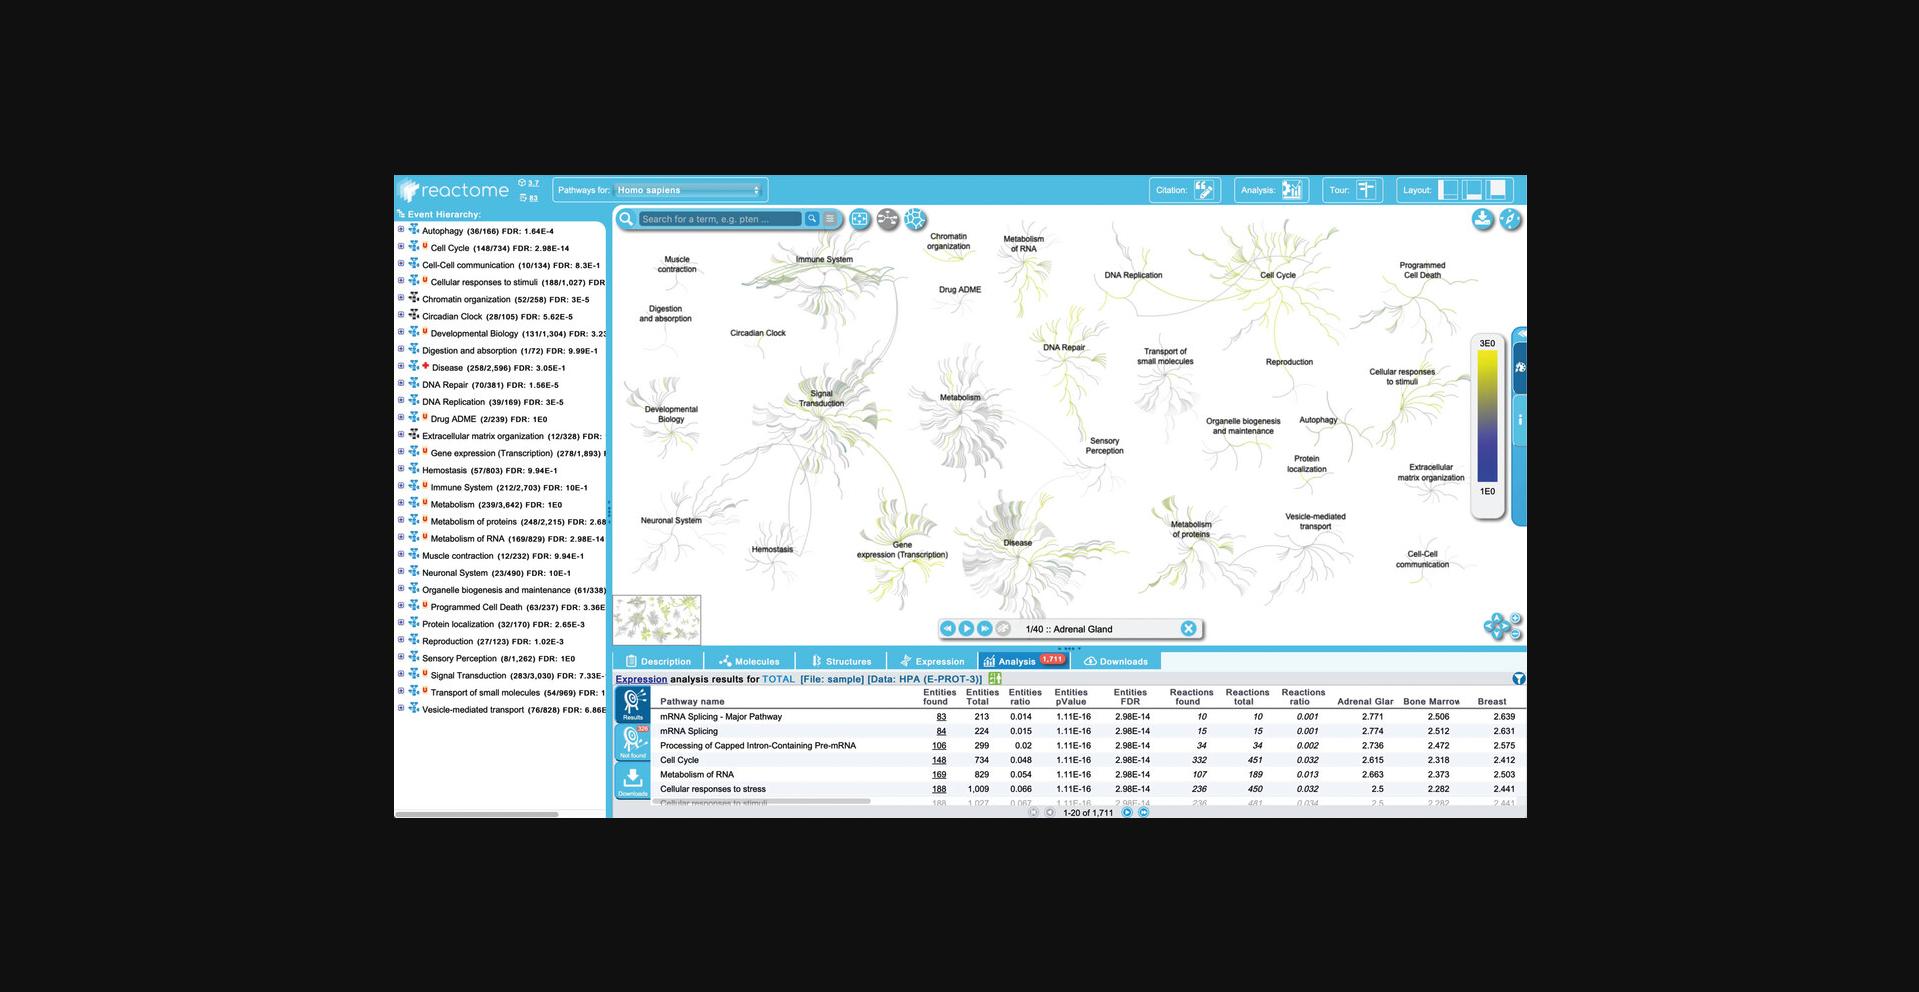
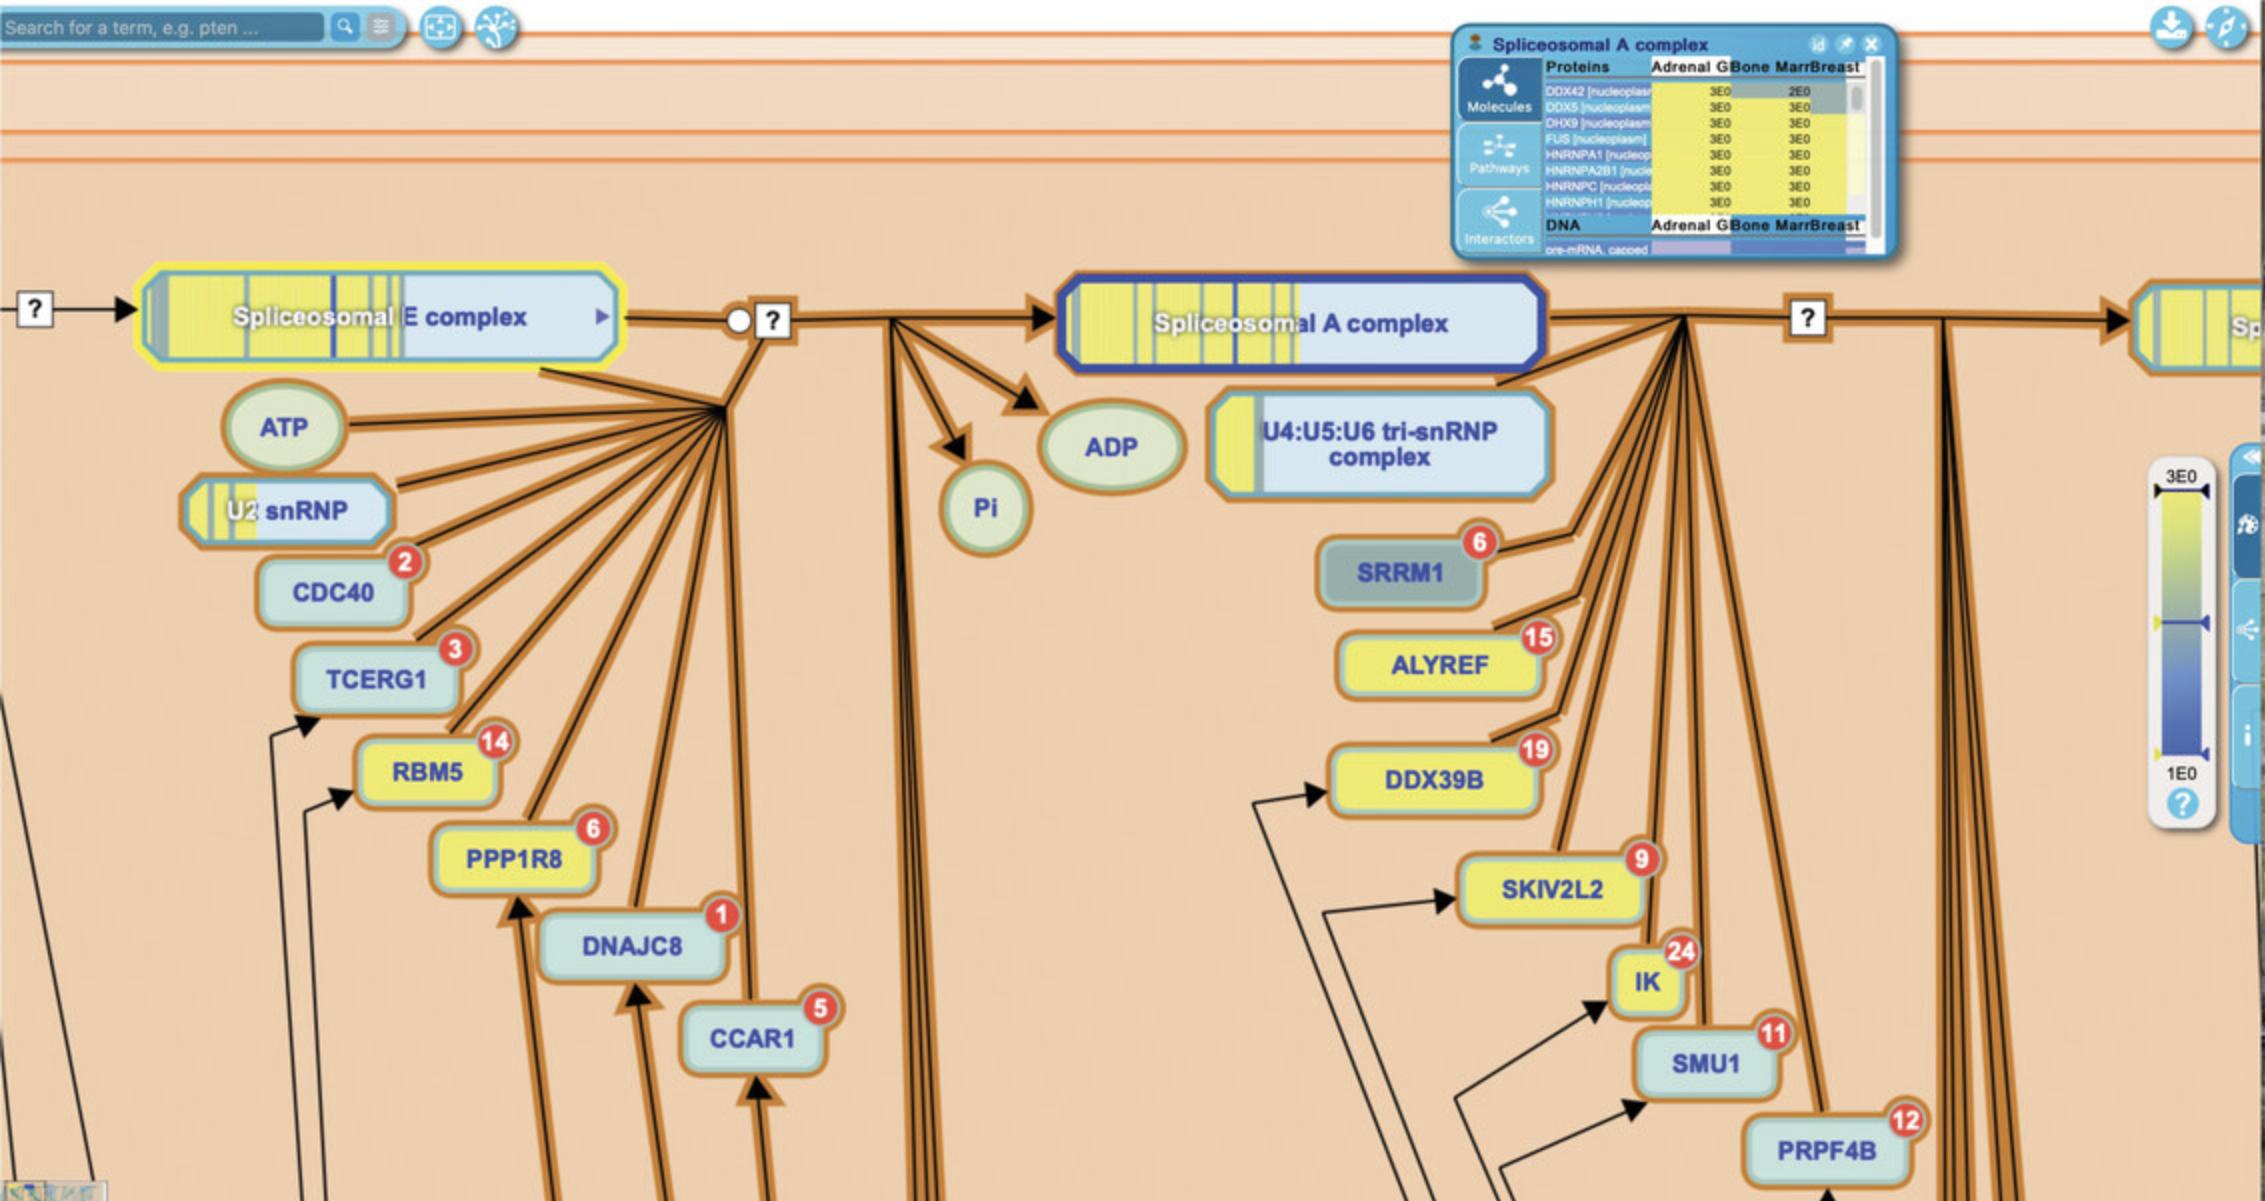
4.Click on “mRNA Splicing - Major Pathway” to open the reaction-level diagram.
COMMENTARY
Background Information
The Reactome project is a collaboration between the Ontario Institute for Cancer Research, NYU Langone Health, the Oregon Health and Science University, and the European Bioinformatics Institute that aims to collect detailed information on all human pathways (Gillespie et al., 2022; Jassal et al., 2020). Reactome pathways are manually curated from the scientific literature by PhD-level curators and peer-reviewed by external experts in the field before being released to the Web site. Reactome's comprehensive data model allows for the detailed capture of molecular level events and all annotations are extensively cross-referenced to other databases and ontologies. All assertions are backed by experimental evidence, either directly from human systems or manually inferred from experiments in model organisms when there is high-quality protein similarity data to suggest that the same reaction is likely to occur in humans. Reactome is a fully open access and open-source project. All the software developed for use in Reactome is available for download and redistribution, and the data itself is available in a variety of formats. The Download link on the Reactome Web site provides instructions for obtaining data and software. The robustness, high quality and reliability of the Reactome database is reflected in its status as both an Elixir core resource and a Global Core Biodata Resource.
Reactome uses a simple scheme for describing biological pathways in which all molecular interactions are defined as reactions. A reaction takes a series of inputs and transforms them into a series of outputs, where inputs and outputs can be any type of molecular compound. Pathways consist of a series of reactions in a given area of biology that are linked where possible by shared inputs and outputs in a chain of preceding and following events. For those reactions that are mediated by catalysts, the catalyst enzyme and its activity are noted. Reactions are also annotated using the cellular compartment in which they occur, and the data model is additionally able to support tissue- or cell-type-specific annotations.
Reactome functions both as a human-friendly online resource, complete with textbook-style illustrations, human-readable summaries and Web-based tools, and as a powerful computer-readable graph database with content and tools accessible through APIs (Fabregat et al., 2018; Griss et al., 2020; Sidiropoulos et al., 2017).
As of Version 83 (December 2022), Reactome covers 11,442 unique proteins in 14,471 reactions and 2610 pathways. This represents ∼56% of the human genome, a number conservatively estimated by dividing the number of human UniProtKB entries that take part in Reactome reactions by the total number of human entries in the latest Ensembl human genome build. Reactome's coverage is extended by the highly used Cytoscape app, ReactomeFIViz, which augments manually curated information with high quality functional interactions predicted in the literature (Wu et al., 2014). The Reactome FIViz tool supports a suite of analyses, including pathway enrichment, visualization of drug target interactions, disease discovery, and analysis of single cell RNA sequencing data sets (Blucher et al., 2019; Haw et al., 2020; Wu & Haw, 2017; documentation and user guide here).
Reactome is related to several other pathway databases, but has distinct methodologies and aims, and is distinguished from other pathway databases due to its particular constellation of attributes: robust, detailed data model, human-pathway focus, manual curation, and expert peer-review, completely open source and open access, and actively maintained.
HumanCyc, NCI-PID and Panther Pathways (Mi & Thomas, 2009; Romero et al., 2005; Schaefer et al., 2009) are reaction-centric pathway databases that are similar to Reactome, although the user interface and underlying database technology are quite different in detail. HumanCyc primarily focuses on intermediate metabolism, whereas Panther Pathways and NCI-PID emphasize signaling pathways. Active curation of NCI-PID was stopped in 2012. Panther Pathways allows their pathway data, but not their source code or software, to be used and redistributed freely; use of HumanCyc data or tools requires a subscription and/or a license.
The Kyoto Encyclopedia of Genes and Genomes, or KEGG (Kanehisa et al., 2004), features an extensive set of user-friendly biological pathway maps that are openly available for personal use; however, a license is required for programmatic access, academic and commercial uses. The BioCarta project (http://www.biocarta.com) represents human biology as a series of colorful high-resolution diagrams. Unlike Reactome or the other projects mentioned, these diagrams are the end product of the project; there is no underlying database. The focus of BioCarta is to be an education and visualization tool, rather than to support data mining and pattern discovery.
Wikipathways (Pico et al., 2008) is a community-driven pathway database, built upon the foundations of Wikipedia, which allows community members to freely contribute and edit pathway diagrams. In 2016, an ongoing collaboration between Wikipathways and Reactome was initiated that sees Reactome pathways converted into Wikipathway-compatible formats, extending the coverage of Wikipathways as well as the potential reach of Reactome pathways (Bohler et al., 2016). Another pathway resource, Pathway Commons, integrates pathway and interaction data from twenty-two databases, including many of those listed here.
The availability of different pathway resources with varied coverage and aims can pose a challenge to a biologist, who faces the daunting task of visiting each of these sites in an attempt to fill in the holes in one database's coverage with information from the others. The BioPAX project (http://www.biopax.org) has improved this situation by creating a standardized file format for representing biological pathways and reactions. Reactome and many of the other pathway databases have committed to exporting their data in BioPAX format. This has enabled databases to exchange pathways and to co-curate data, thereby accelerating the rate at which the gaps in pathway knowledge are closed.
Reactome, like other pathway databases, accelerates scientific discovery by assisting in identifying patterns in large-scale data sets that are difficult to discern from simple inspection.
Reactome's visualization and analysis tools help bioinformaticians, bench scientists and clinicians make potentially unanticipated connections between diverse biological domains, leading to new insights and fruitful areas of investigation. These studies reveal the value of pathway databases such as Reactome in uncovering novel relationships and interactions between genes and contributing to translational research by providing insight on potentially clinically actionable targets in disease.
Acknowledgements
The Reactome project is supported by grants from the U.S. National Institutes of Health (U24 HG0012198; U01 CA239069; U41 HG003751; U54GM114833), as well as grants from the European Bioinformatics Institute (EMBL-EBI), Open Targets and the University of Toronto.
Author Contributions
Karen Rothfels : data curation, writing: original draft; Marija Milacic : data curation, writing: review and editing; Lisa Matthews : project administration, supervision, writing: review and editing; Robin Haw : project administration, supervision, writing: review and editing; Cristoffer Sevilla : visualization; Marc Gillespie : data curation; Ralf Stephan: data curation; Chuqiao Gong : software; Eliot Ragueneau : software; Bruce May : data curation; Veronica Shamovsky : data curation; Adam Wright : software; Joel Weiser : software; Deidre Beavers : software; Patrick Conley : software; Krishna Tiwari : data curation; Bijay Jassal : data curation; Johannes Griss : software, visualization; Andrea Senff-Ribeiro : data curation; Timothy Brunson : software; Robert Petryszak : software; Henning Hermjakob : conceptualization, funding acquisition, project administration, supervision; Peter D'Eustachio : conceptualization, funding acquisition, project administration, supervision, writing: review and editing; Guanming Wu : conceptualization, funding acquisition, project administration, software, supervision, visualization, writing: review and editing; Lincoln Stein : conceptualization, funding acquisition, project administration, supervision.
Conflict of Interest
None declared.
Open Research
Data Availability Statement
The data that support the protocol are openly available at the Reactome Web site (https://reactome.org; https://doi.org/10.3180/19341792) and can be downloaded at https://reactome.org/download-data.
Literature Cited
- Armstrong, D. R., Berrisford, J. M., Conroy, M. J., Gutmanas, A., Anyango, S., Choudhary, P., Clark, A. R., Dana, J. M., Deshpande, M., Dunlop, R., Gane, P., Gáborová, R., Gupta, D., Haslam, P., Koča, J., Mak, L., Mir, S., Mukhopadhyay, A., Nadzirin, N., … Velankar, S. (2020). PDBe: Improved findability of macromolecular structure data in the PDB. Nucleic Acids Research , 48(D1), D335–D343. https://doi.org/10.1093/nar/gkz990
- Bansal, P., Morgat, A., Axelsen, K. B., Muthukrishnan, V., Coudert, E., Aimo, L., Hyka-Nouspikel, N., Gasteiger, E., Kerhornou, A., Neto, T. B., Pozzato, M., Blatter, M. -C., Ignatchenko, A., Redaschi, N., & Bridge, A. (2022). Rhea, the reaction knowledgebase in 2022. Nucleic Acids Research , 50(D1), D693–D700. https://doi.org/10.1093/nar/gkab1016
- Benjamini, Y., & Hochberg, Y. (1995). Controlling the false discovery rate: A practical and powerful approach to multiple testing. Journal of the Royal Statistical Society. Series B (Methodological) , 57(1), 289–300.
- Blucher, A. S., McWeeney, S. K., Stein, L., & Wu, G. (2019). Visualization of drug target interactions in the contexts of pathways and networks with ReactomeFIViz. F1000Research , 8, 908. https://doi.org/10.12688/f1000research.19592.1
- Bohler, A., Wu, G., Kutmon, M., Pradhana, L. A., Coort, S. L., Hanspers, K., Haw, R., Pico, A. R., & Evelo, C. T. (2016). Reactome from a WikiPathways perspective. PLoS Computational Biology , 12(5), e1004941. https://doi.org/10.1371/journal.pcbi.1004941
- Eilbeck, K., Lewis, S. E., Mungall, C. J., Yandell, M., Stein, L., Durbin, R., & Ashburner, M. (2005). The sequence ontology: A tool for the unification of genome annotations. Genome Biology , 6(5), R44. https://doi.org/10.1186/gb-2005-6-5-r44
- Fabregat, A., Sidiropoulos, K., Garapati, P., Gillespie, M., Hausmann, K., Haw, R., Jassal, B., Jupe, S., Korninger, F., Mckay, S., Matthews, L., May, B., Milacic, M., Rothfels, K., Shamovsky, V., Webber, M., Weiser, J., Williams, M., Wu, G., … D'eustachio, P. (2016). The Reactome pathway Knowledgebase. Nucleic Acids Research , 44(D1), D481–D487. https://doi.org/10.1093/nar/gkv1351
- Fabregat, A., Korninger, F., Viteri, G., Sidiropoulos, K., Marin-Garcia, P., Ping, P., Wu, G., Stein, L., D'eustachio, P., & Hermjakob, H. (2018). Reactome graph database: Efficient access to complex pathway data. PLoS Computational Biology , 14(1), e1005968. https://doi.org/10.1371/journal.pcbi.1005968
- Gillespie, M., Jassal, B., Stephan, R., Milacic, M., Rothfels, K., Senff-Ribeiro, A., Griss, J., Sevilla, C., Matthews, L., Gong, C., Deng, C., Varusai, T., Ragueneau, E., Haider, Y., May, B., Shamovsky, V., Weiser, J., Brunson, T., Sanati, N., … D'eustachio, P. (2022). The reactome pathway knowledgebase 2022. Nucleic Acids Research , 50(D1), D687–D692. https://doi.org/10.1093/nar/gkab1028
- Griss, J., Viteri, G., Sidiropoulos, K., Nguyen, V., Fabregat, A., & Hermjakob, H. (2020). ReactomeGSA - Efficient multi-omics comparative pathway analysis. Molecular & Cellular Proteomics: MCP, 19(12), 2115–2125. https://doi.org/10.1074/mcp.TIR120.002155
- Hastings, J., Owen, G., Dekker, A., Ennis, M., Kale, N., Muthukrishnan, V., Turner, S., Swainston, N., Mendes, P., & Steinbeck, C. (2016). ChEBI in 2016: Improved services and an expanding collection of metabolites. Nucleic Acids Research , 44(D1), D1214–D1219. https://doi.org/10.1093/nar/gkv1031
- Haw, R., Loney, F., Ong, E., He, Y., & Wu, G. (2020). Perform pathway enrichment analysis using ReactomeFIViz. Methods in Molecular Biology (Clifton, N.J.) , 2074, 165–179. https://doi.org/10.1007/978-1-4939-9873-9_13
- Jassal, B., Matthews, L., Viteri, G., Gong, C., Lorente, P., Fabregat, A., Sidiropoulos, K., Cook, J., Gillespie, M., Haw, R., Loney, F., May, B., Milacic, M., Rothfels, K., Sevilla, C., Shamovsky, V., Shorser, S., Varusai, T., Weiser, J., … D'eustachio, P. (2020). The reactome pathway knowledgebase. Nucleic Acids Research , 48(D1), D498–D503. https://doi.org/10.1093/nar/gkz1031
- Kanehisa, M., Goto, S., Kawashima, S., Okuno, Y., & Hattori, M. (2004). The KEGG resource for deciphering the genome. Nucleic Acids Research , 32(Database issue), D277–D280. https://doi.org/10.1093/nar/gkh063
- Le Novère, N., Hucka, M., Mi, H., Moodie, S., Schreiber, F., Sorokin, A., Demir, E., Wegner, K., Aladjem, M. I., Wimalaratne, S. M., Bergman, F. T., Gauges, R., Ghazal, P., Kawaji, H., Li, L., Matsuoka, Y., Villéger, A., Boyd, S. E., Calzone, L., … Kitano, H. (2009). The systems biology graphical notation [published correction appears in Nat Biotechnol. 2009 Sep;27(9):864]. Nature Biotechnology , 27(8), 735–741. https://doi.org/10.1038/nbt.1558
- Mi, H., & Thomas, P. (2009). PANTHER pathway: An ontology-based pathway database coupled with data analysis tools. Methods in Molecular Biology (Clifton, N.J.) , 563, 123–140. https://doi.org/10.1007/978-1-60761-175-2_7
- Pico, A. R., Kelder, T., van Iersel, M. P., Hanspers, K., Conklin, B. R., & Evelo, C. (2008). WikiPathways: Pathway editing for the people. PLoS Biology , 6(7), e184. https://doi.org/10.1371/journal.pbio.0060184
- Piñero, J., Saüch, J., Sanz, F., & Furlong, L. I. (2021). The DisGeNET cytoscape app: Exploring and visualizing disease genomics data. Computational and Structural Biotechnology Journal , 19, 2960–2967. https://doi.org/10.1016/j.csbj.2021.05.015
- Romero, P., Wagg, J., Green, M. L., Kaiser, D., Krummenacker, M., & Karp, P. D. (2005). Computational prediction of human metabolic pathways from the complete human genome. Genome Biology , 6(1), R2. https://doi.org/10.1186/gb-2004-6-1-r2
- Schaefer, C. F., Anthony, K., Krupa, S., Buchoff, J., Day, M., Hannay, T., & Buetow, K. H. (2009). PID: The Pathway Interaction Database. Nucleic Acids Research , 37(Database issue), D674–D679. https://doi.org/10.1093/nar/gkn653
- Schriml, L. M., Mitraka, E., Munro, J., Tauber, B., Schor, M., Nickle, L., Felix, V., Jeng, L., Bearer, C., Lichenstein, R., Bisordi, K., Campion, N., Hyman, B., Kurland, D., Oates, C. P., Kibbey, S., Sreekumar, P., Le, C., Giglio, M., & Greene, C. (2019). Human disease ontology 2018 update: Classification, content and workflow expansion. Nucleic Acids Research , 47(D1), D955–D962. https://doi.org/10.1093/nar/gky1032
- Sidiropoulos, K., Viteri, G., Sevilla, C., Jupe, S., Webber, M., Orlic-Milacic, M., Jassal, B., May, B., Shamovsky, V., Duenas, C., Rothfels, K., Matthews, L., Song, H., Stein, L., Haw, R., D'eustachio, P., Ping, P., Hermjakob, H., & Fabregat, A. (2017). Reactome enhanced pathway visualization. Bioinformatics (Oxford, England) , 33(21), 3461–3467. https://doi.org/10.1093/bioinformatics/btx441
- Wu, G., Dawson, E., Duong, A., Haw, R., & Stein, L. (2014). ReactomeFIViz: A Cytoscape app for pathway and network-based data analysis. F1000Research , 3, 146. https://doi.org/10.12688/f1000research.4431.2
- Wu, G., & Haw, R. (2017). Functional interaction network construction and analysis for disease discovery. Methods in Molecular Biology (Clifton, N.J.) , 1558, 235–253. https://doi.org/10.1007/978-1-4939-6783-4_11

