Using TraceFinder and Excel software to evaluate and report multi-analyte targeted LC-MS data acquired on an ThermoScientific Exploris 240 Orbitrap
Natalie ZM Homer, Scott G Denham, Margaux Billen, Joanna Simpson
Excel
Evaluate LC-MS data
Data analysis
High Resolution Mass Spectrometry
ThermoFisher Exploris 240 Orbitrap
TraceFinder
Targeted analysis
Quantitative analysis
Abstract
In our lab we focus on targeted analysis and have found that acquiring LC-HRMS data using Xcalibur software and assessing the data using TraceFinder software is the most robust and flexible approach.
This protocol describes our approach to evaluating LC-HRMS data that has been collected in Xcalibur software, on LC-HRMS instruments including ThermoScientific Exploris mass spectrometers. It describes how to build a processing method in TraceFinder and using it to evaluate a full scan analysis data set acquired in Xcalibur software.
The LC-HRMS data set must contain a calibration curve and unknowns analysed as a batch using the same Acquisition method in Xcalibur. The results from TraceFinder are then transferred to Microsoft Excel to summarise the calculated amounts of the analytes of interest in the samples as a final result.
Before start
Acquire a dataset in Xcalibur and use the raw file in TraceFinder.
Steps
Creating a compound database in TraceFinder
In TraceFinder, navigate to the 'Method Development' tab in the bottom left corner of the screen.
Select 'Compound Database' on the left-hand side. The screen that pops up looks like this:
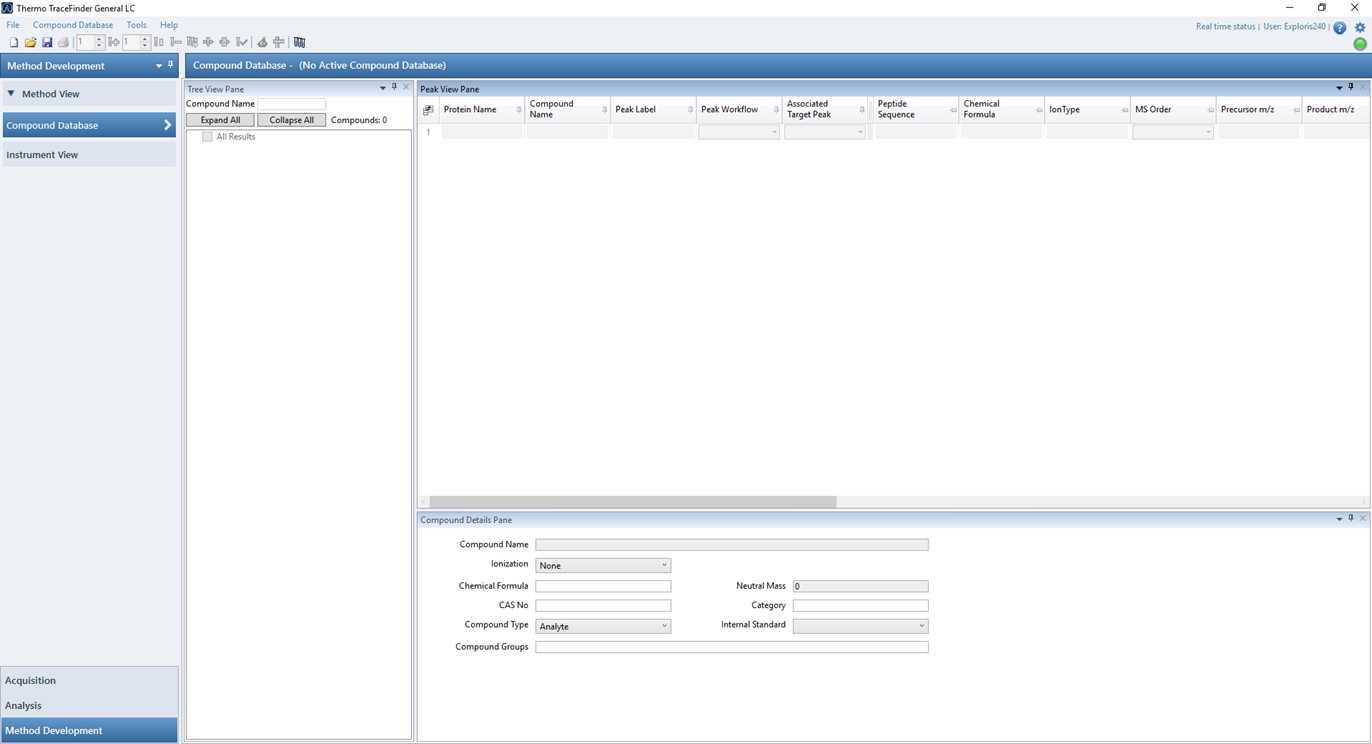
Go to File > New Small Molecule Compound Database
A new screen pops up where you can give a name to your new compound database.
Build your compound database as seen in this example:
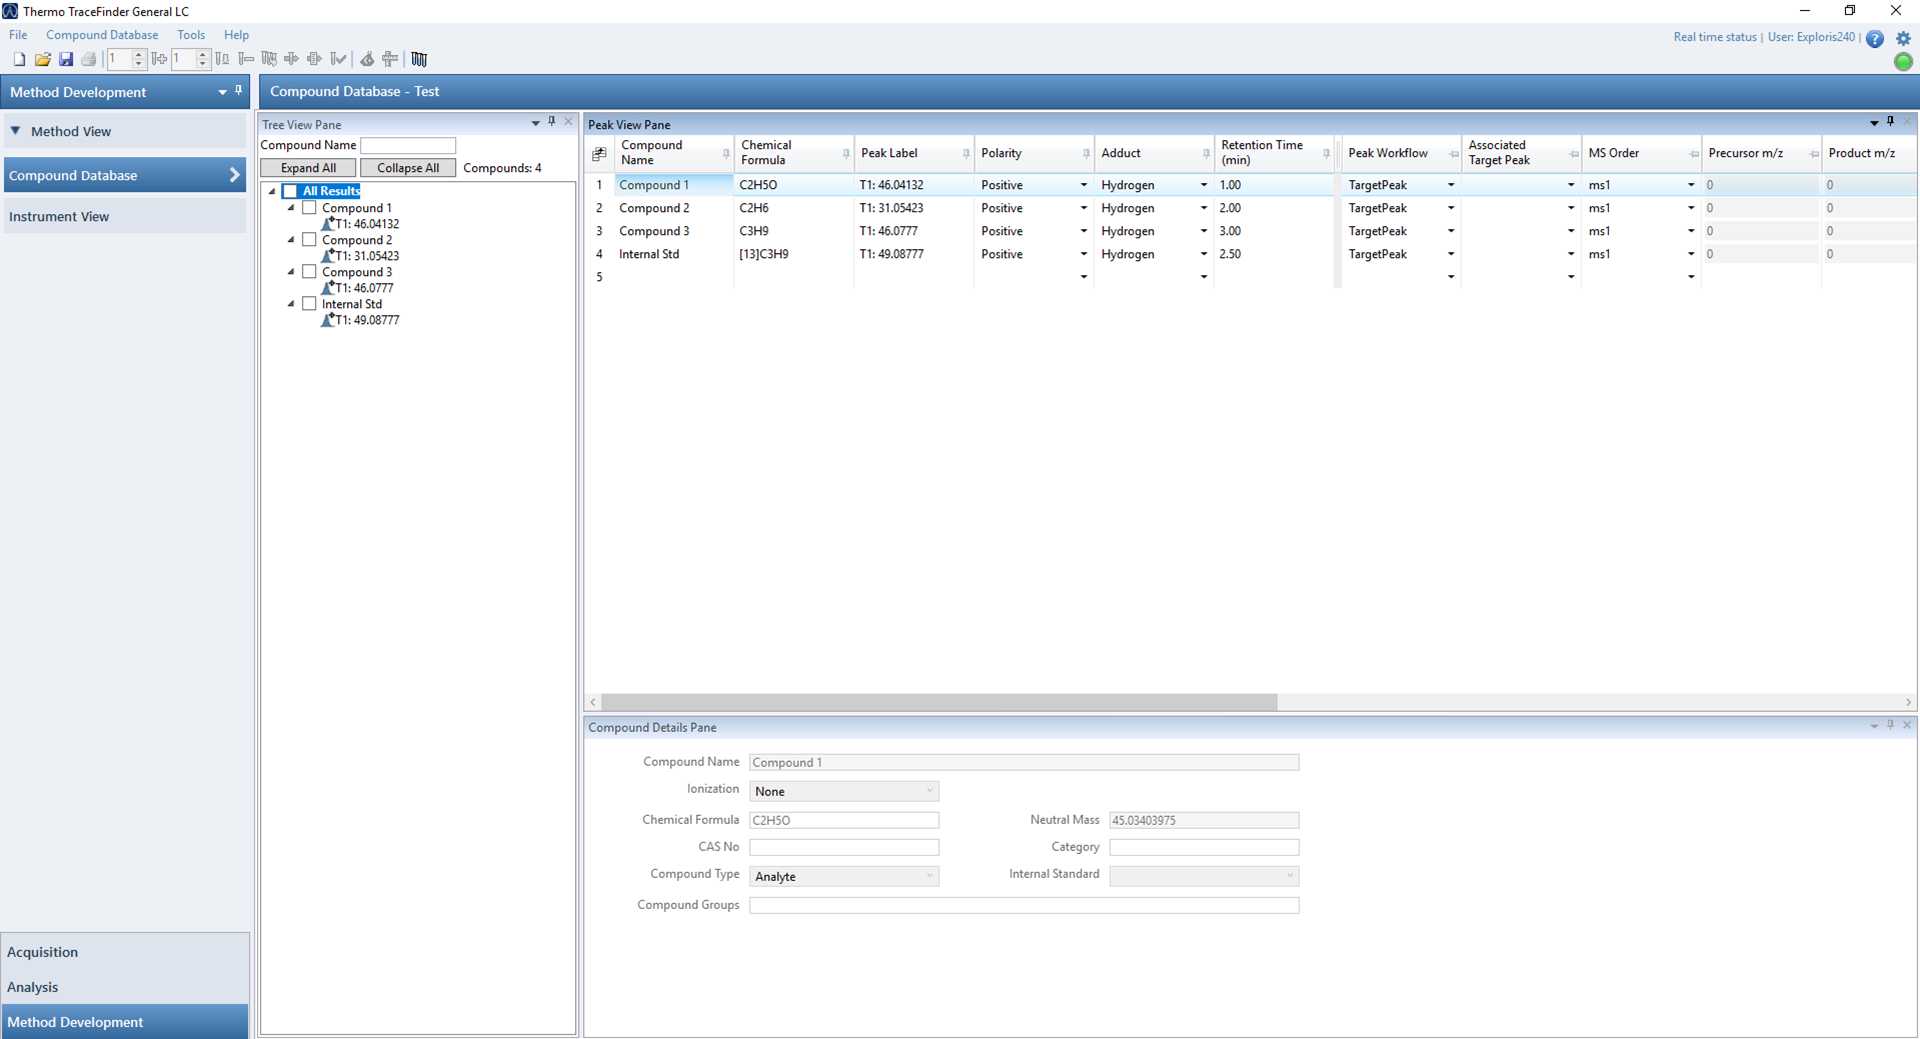
- Enter each individual compound that should be analysed + all internal standards in the method and enter the chemical formula, the polarity, the adduct and the expected retention time for each of the compounds.
Select each individual compound in the Tree View Pane on the left hand side and fill in the 'Compound Details Pane' on the bottom:
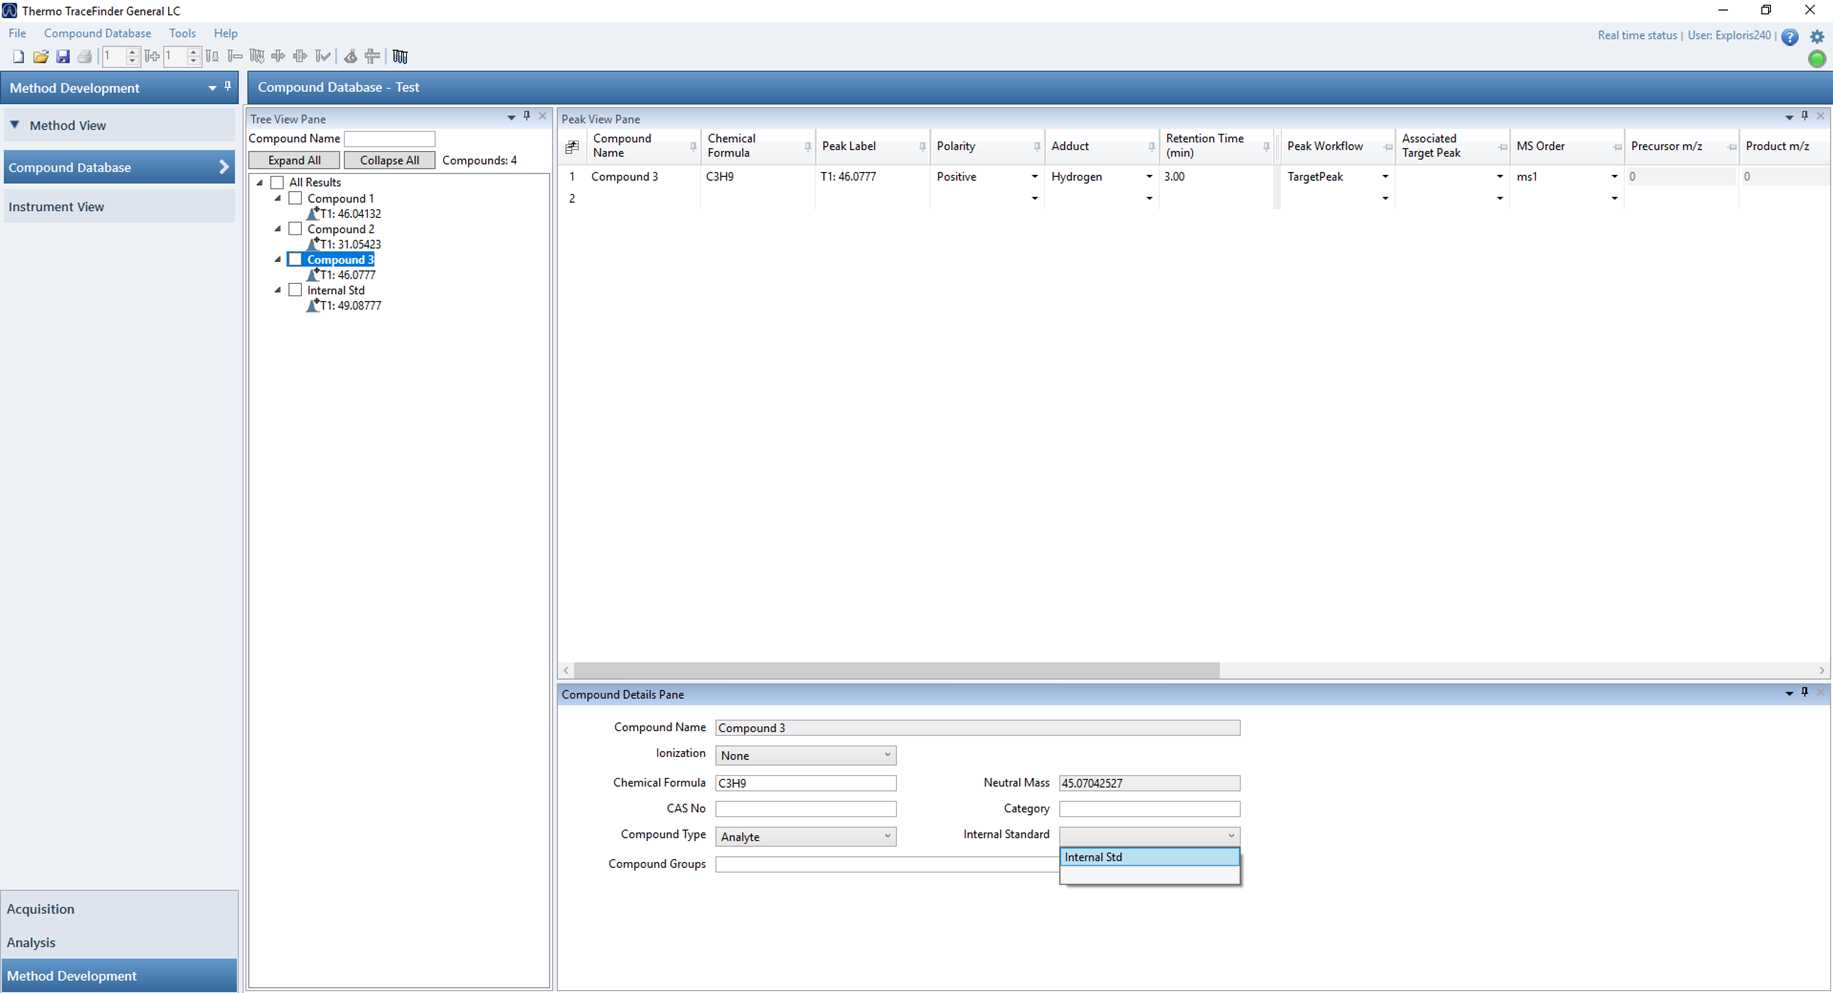
- For the internal standard(s), select 'Internal Standard' for compound type in de lower tab and fill in the ISTD concentration as 1.
- For the analytes, select 'Analyte' for compound type in the lower tab.
Save the compound database.
Go to File > Save Compound Database.
Creating a processing method in TraceFinder
Go to the 'Method View' tab on the left hand side.
Select File > New > Master method...
The following screen will pop up:
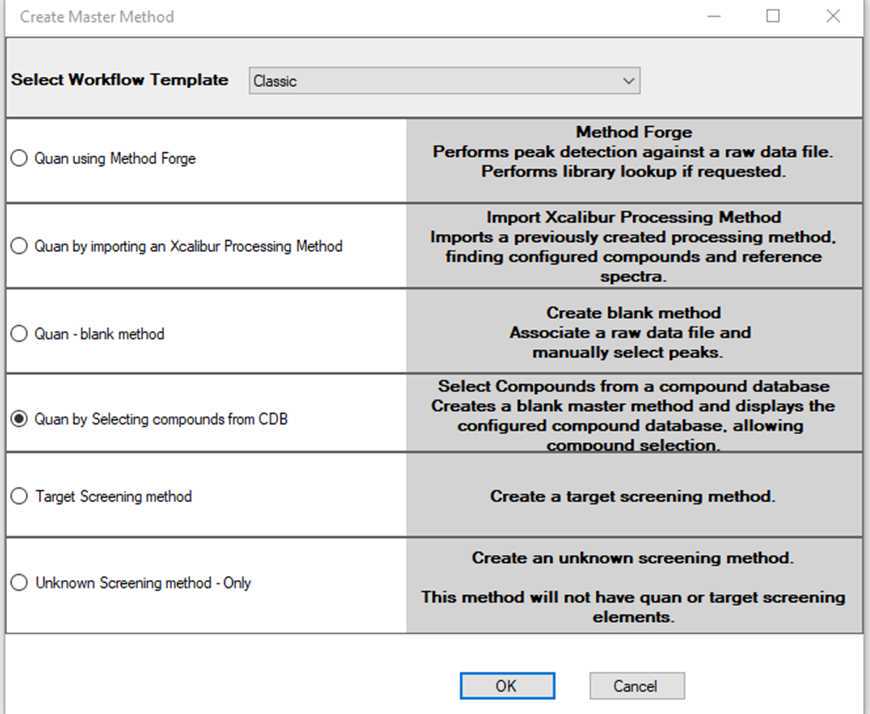
Select the option 'Quan by Selecting compounds from CDB' and click on 'OK'.
The following screen will pop up:
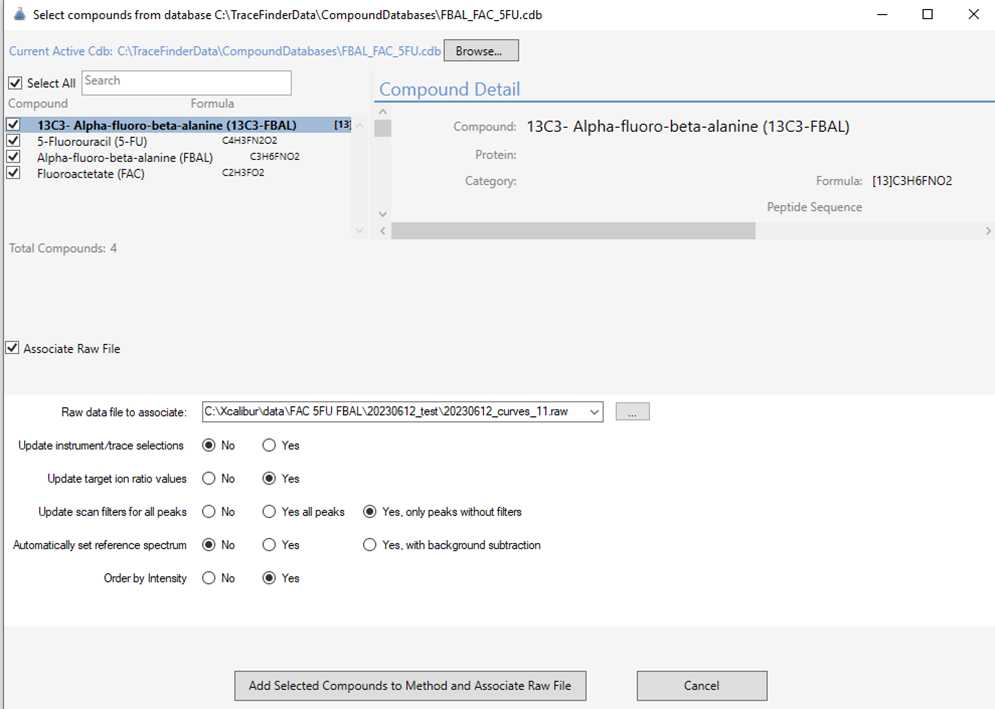
- Using the browse function, select your prepared compound library.
- Tick the 'Select All' and 'Associate Raw Datafile' boxes.
- Select a datafile from a mid-high standard on the calibration curve.
- Use the settings as displayed in the screenshot above.
- Click on 'Add Selected Compounds to Method and Associate Raw File'
Save your Master Method by selecting File > Save as...
Navigate to the 'Compounds' tab on the left hand side. The screen should look like this:
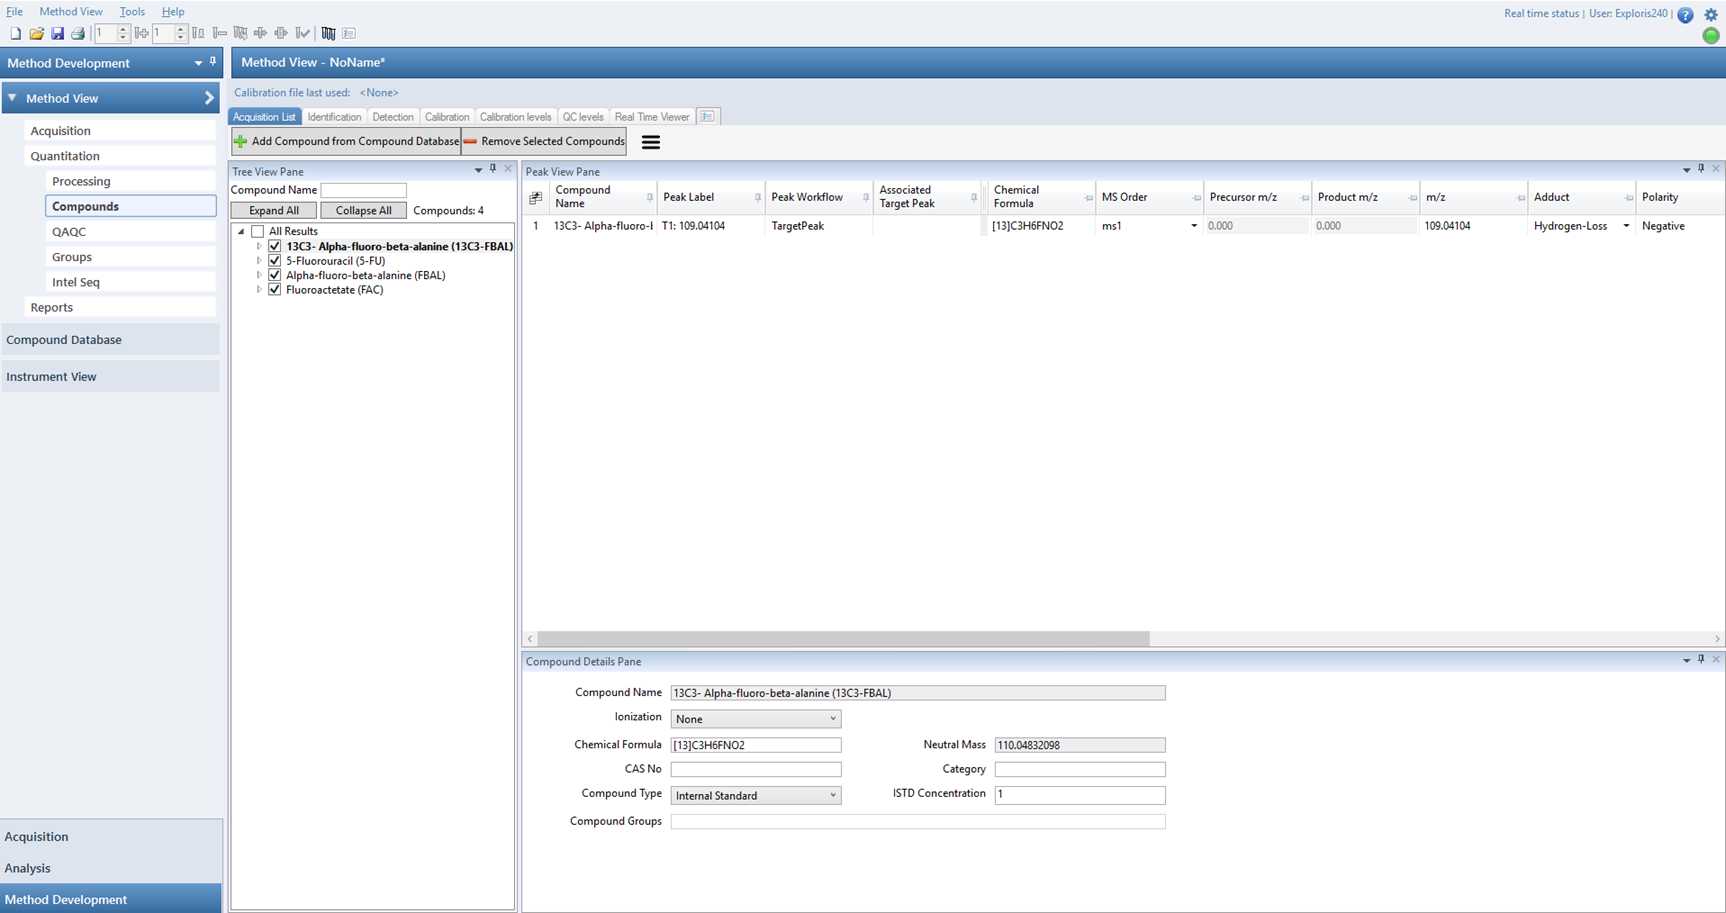
You are currently in the 'Acquisition List' tab on top. Here:
- Select the each individual compound and check that the chemical formula, the polarity, the adduct and the expected retention time are all correct.
- For the analytes, select which internal standard should be used for each individual analyte.
Navigate to the 'Detection' tab on top. The screen should look like this:
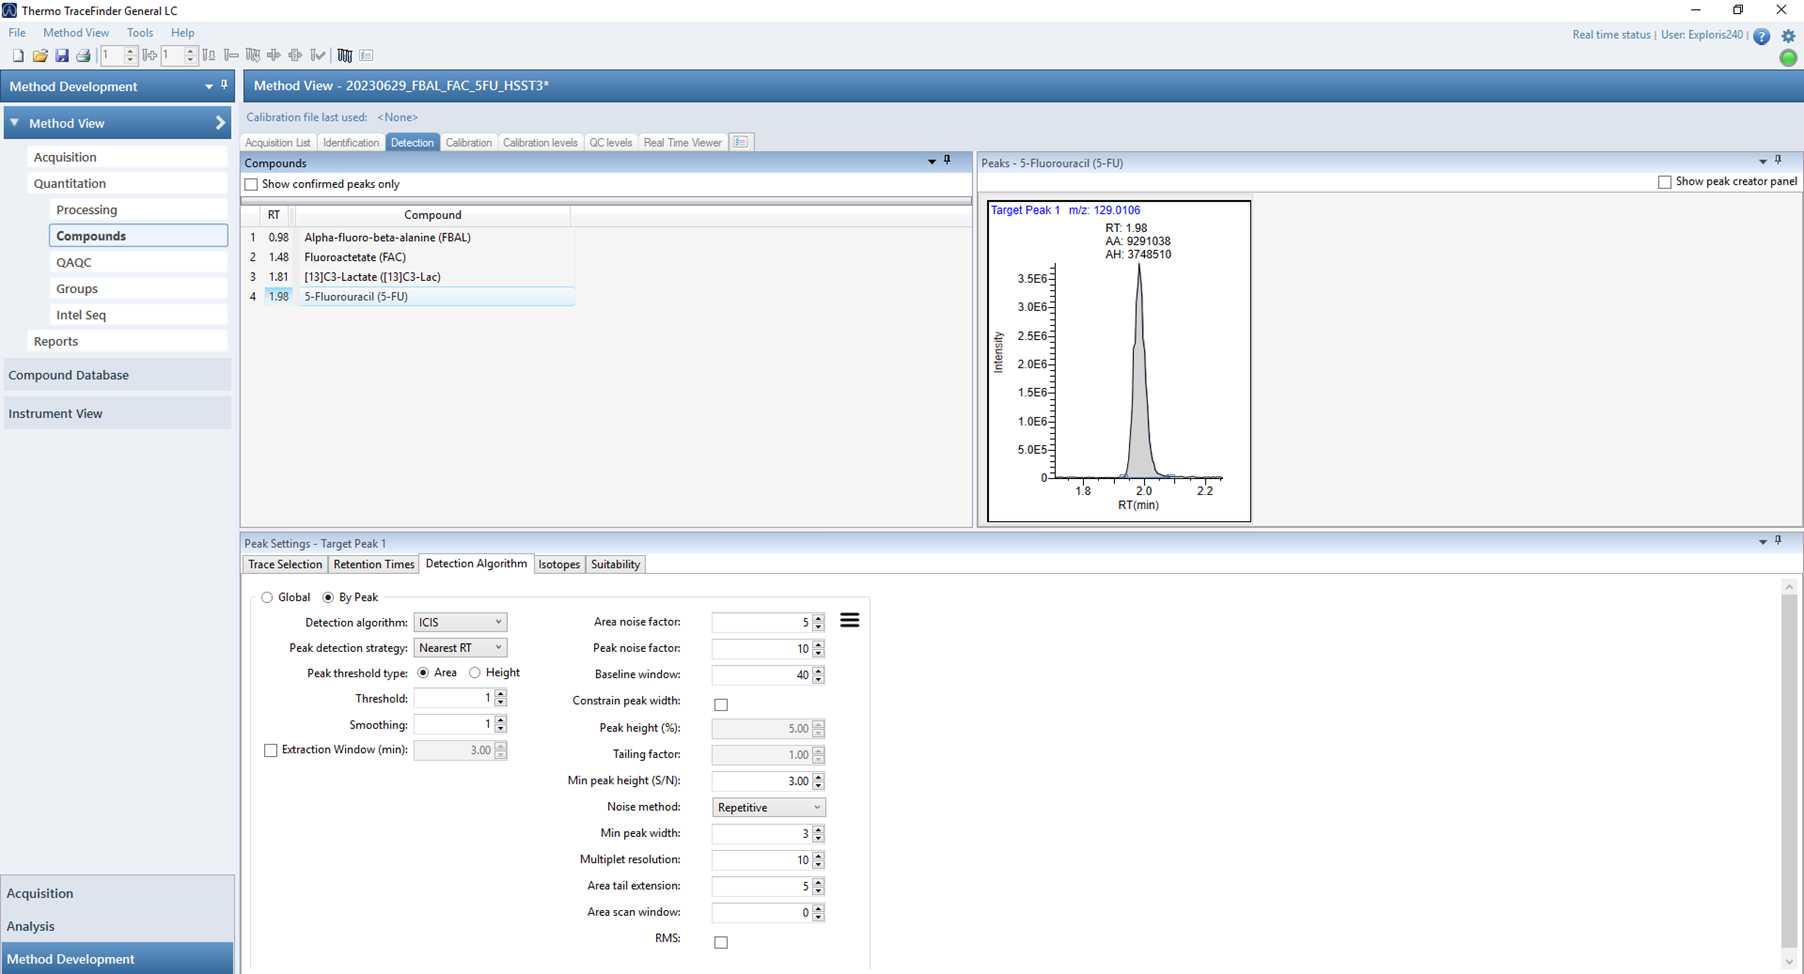
Here, you can alter the parameters for peak detection in your method, such as the expected retention times, the retention time window, the detection algorithm used and more.
Navigate to the 'Calibration' tab on top. The screen should look like this:
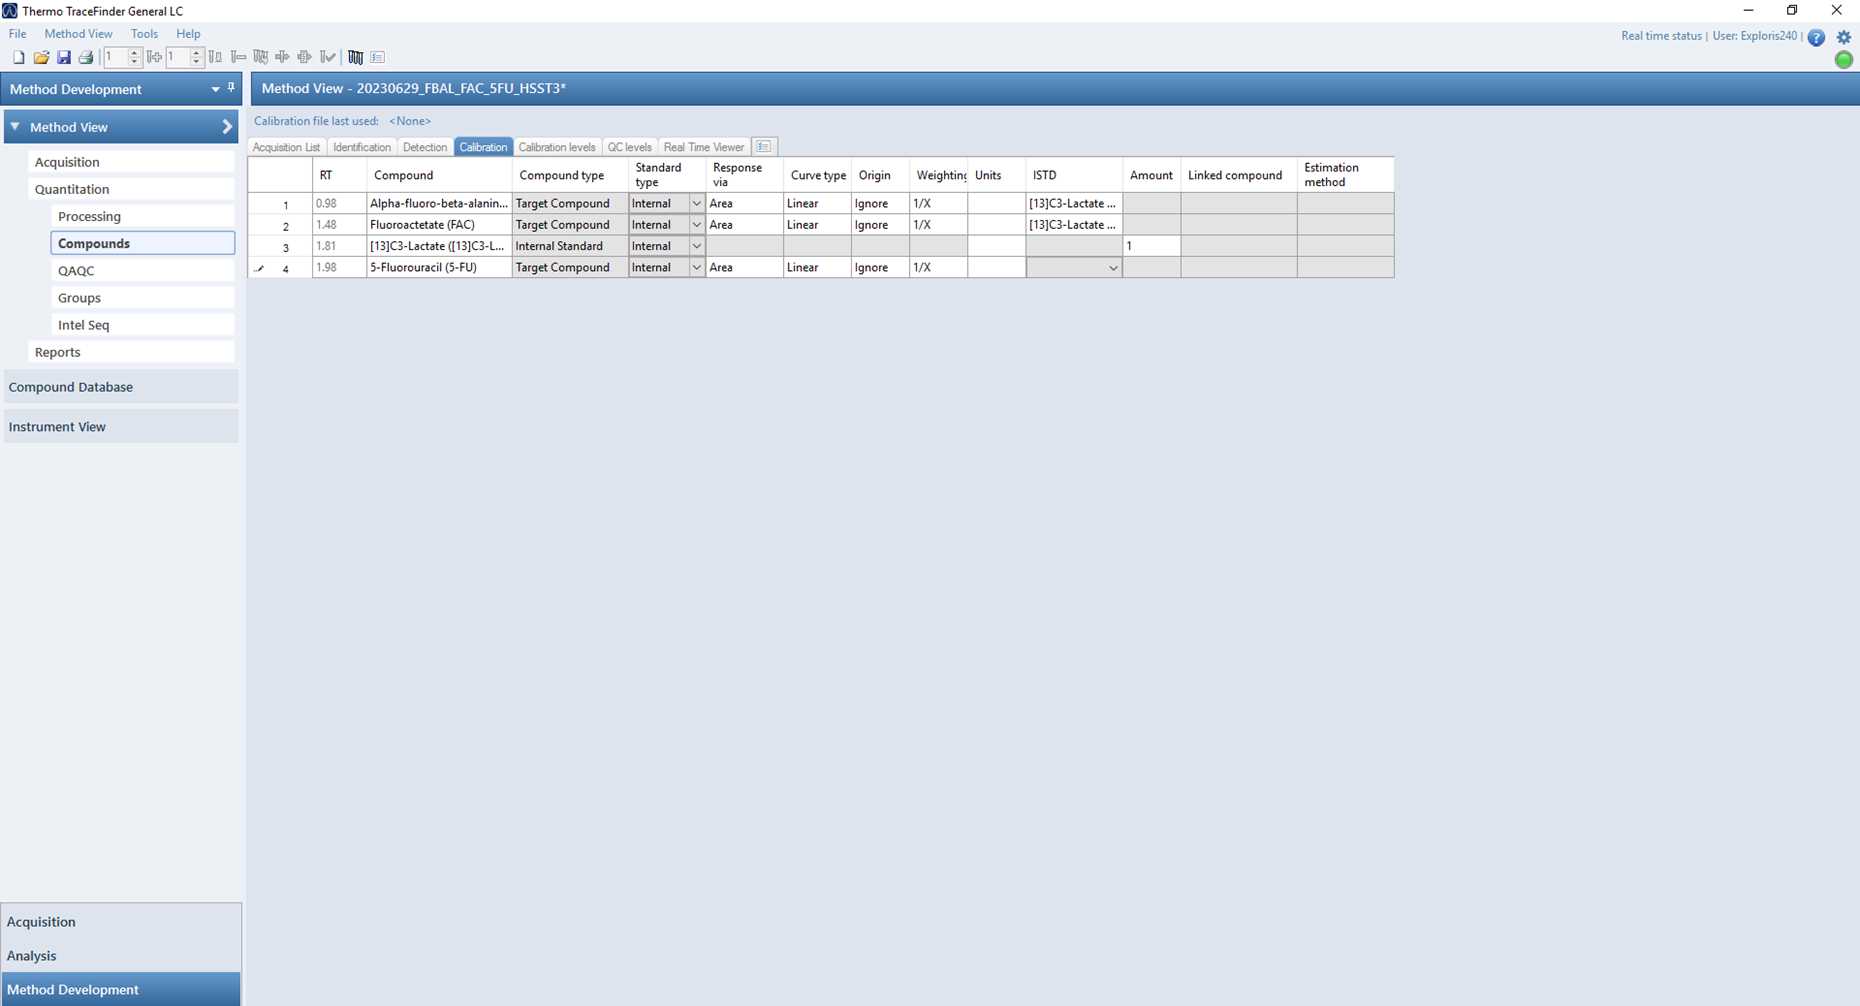
- Check that the information in this tab is correct.
- Select 'Linear' as the curve type and '1/X' as the weighting.
- Again, select the appropriate internal standard for each analyte.
Navigate to the 'Calibration levels' tab on top. The screen should look like this:
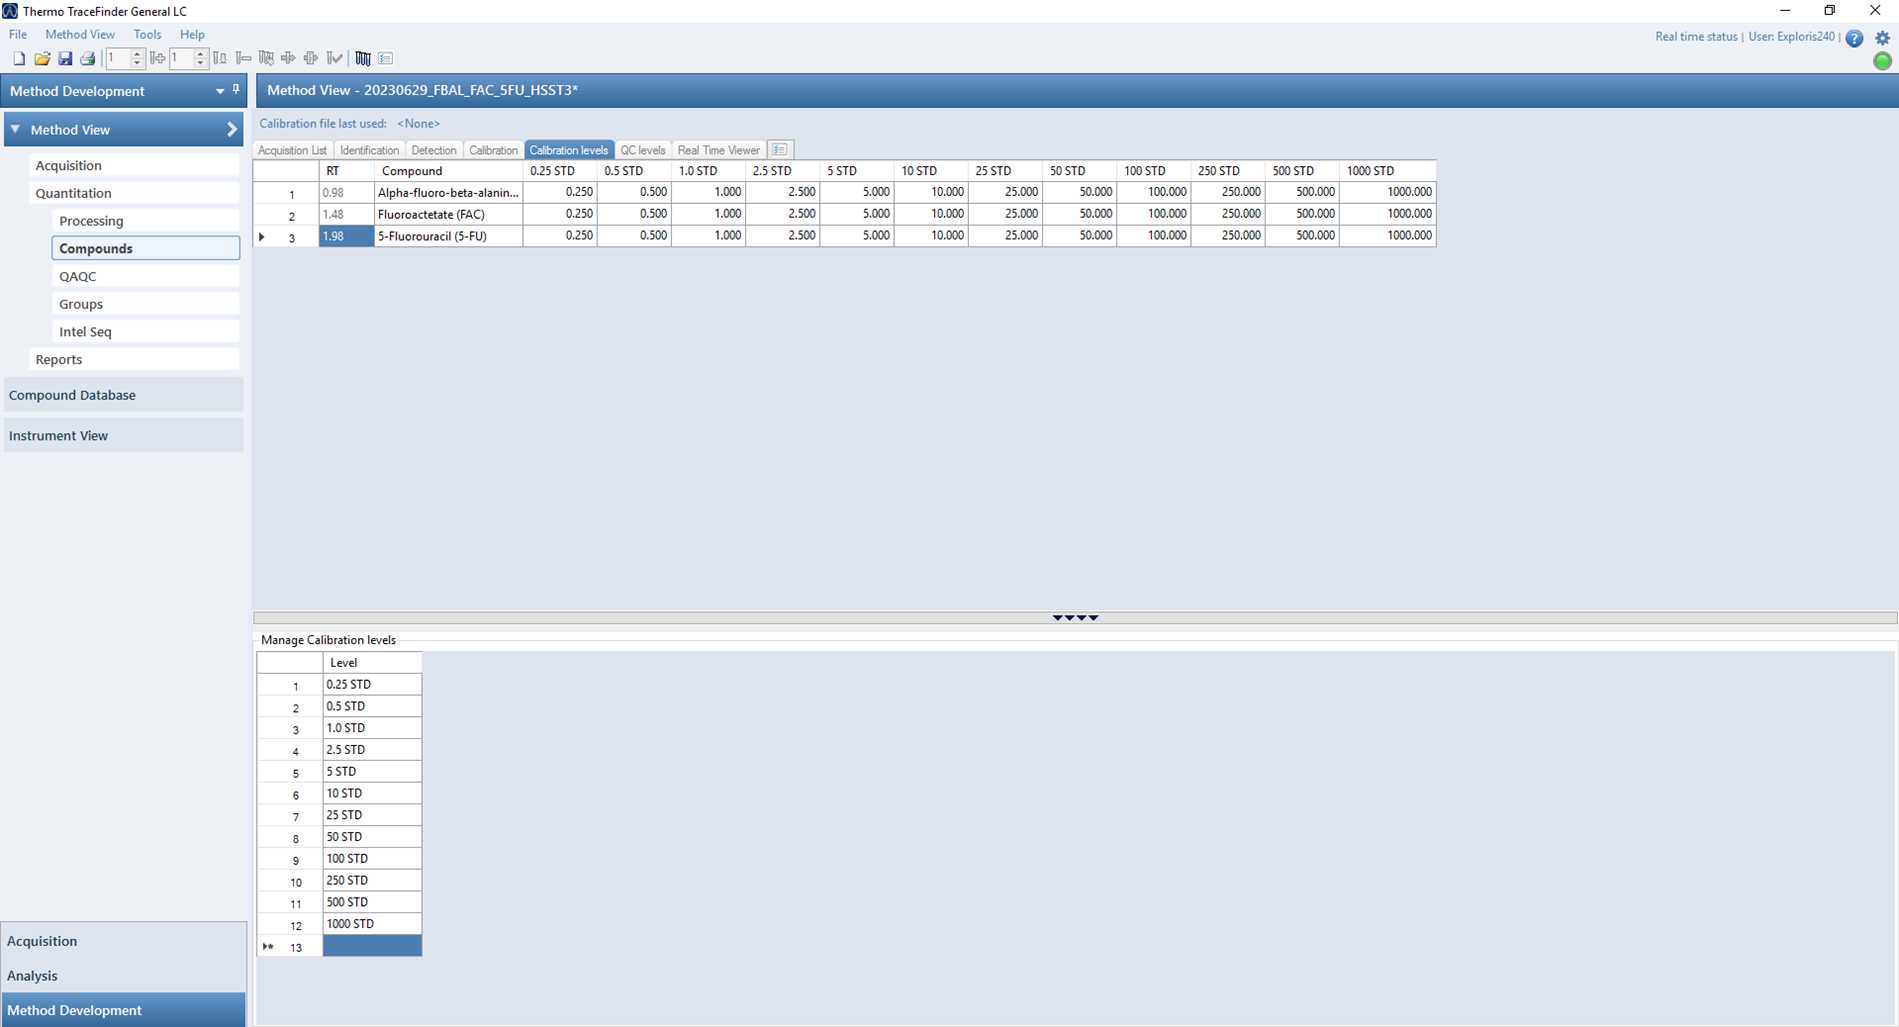
- Enter the names of all calibration levels in the 'Manage Calibration levels' tab at the bottom of the screen.
- For each individual analyte, fill in the concentration associated with each calibration level.
Save your Master Method by selecting File > Save.
Using TraceFinder to process Xcalibur acquired LC-MS data
In TraceFinder, navigate to the 'Analysis' tab in the bottom left corner of the screen.
Select File > New > Batch
A screen pops up where you can save your new batch.
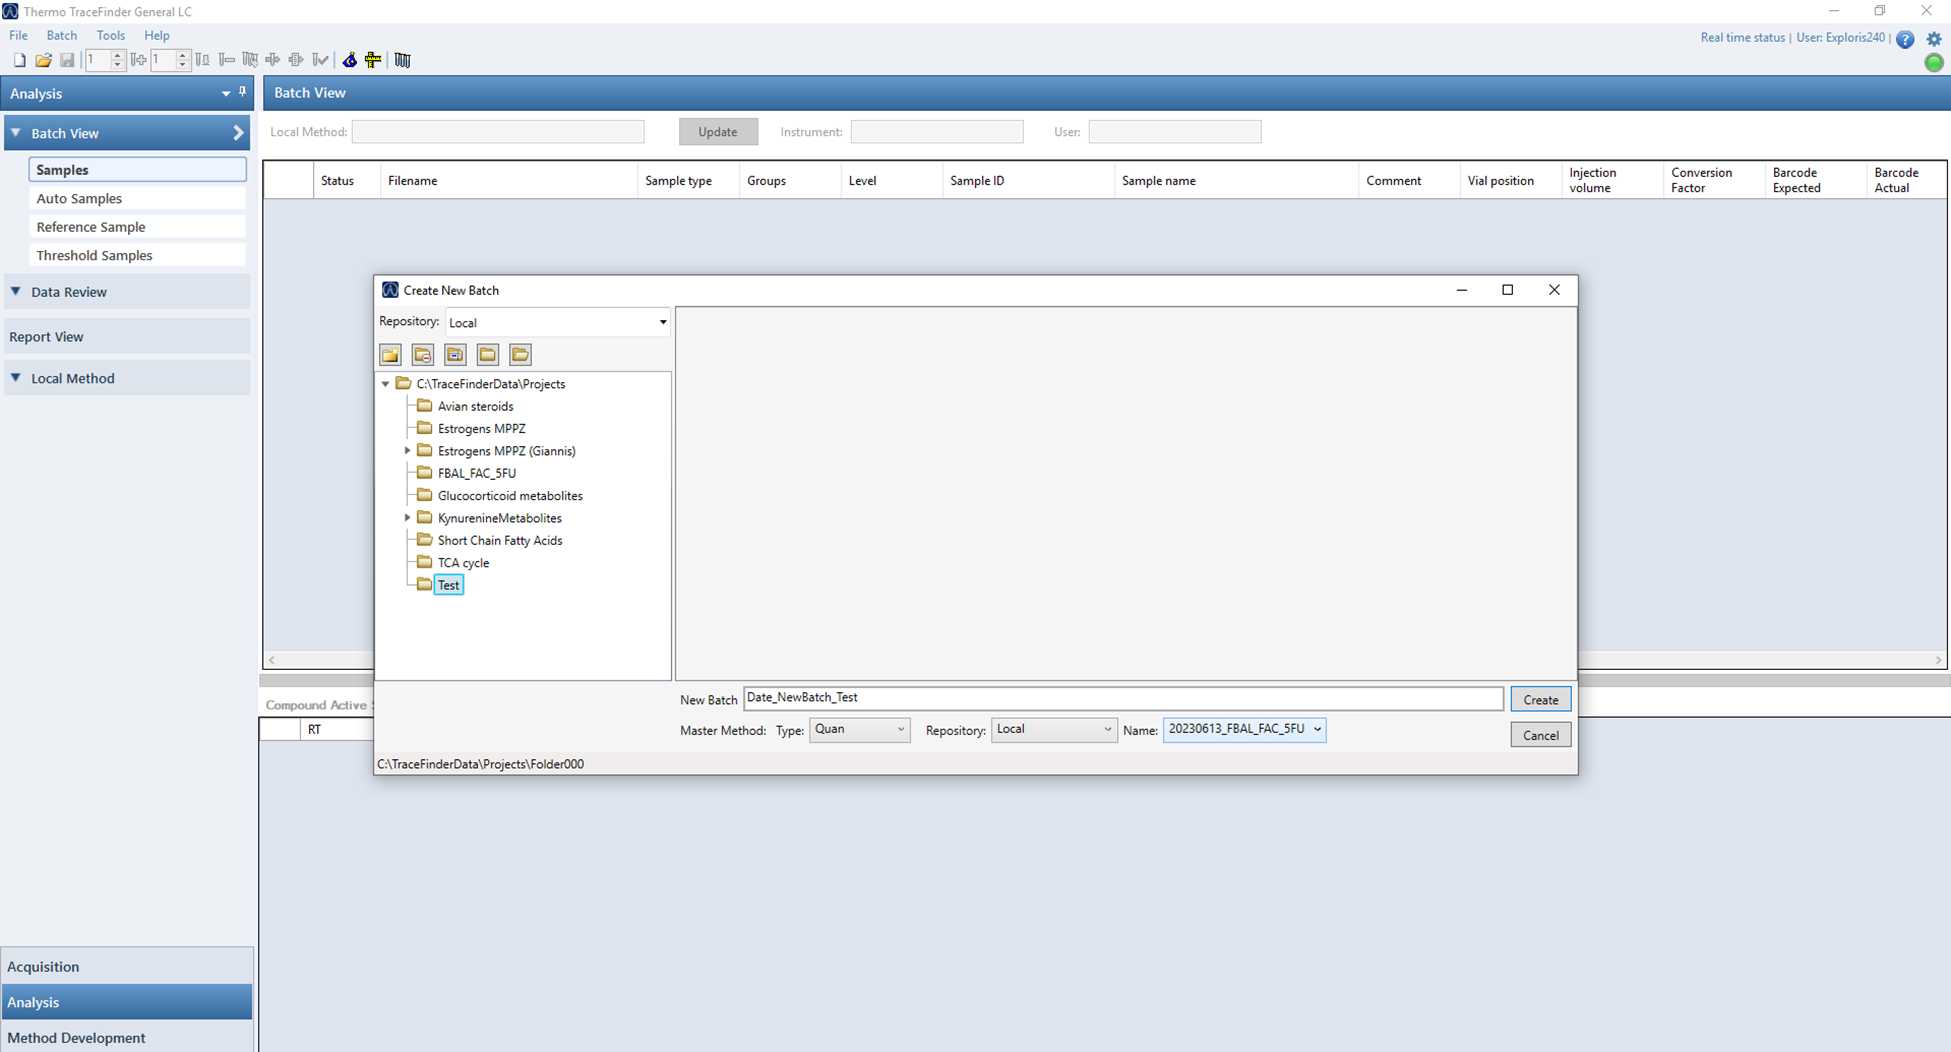
Select a folder, give the new batch a name, select the Master Method you designed and select 'Create'.
Go to Batch > Import samples
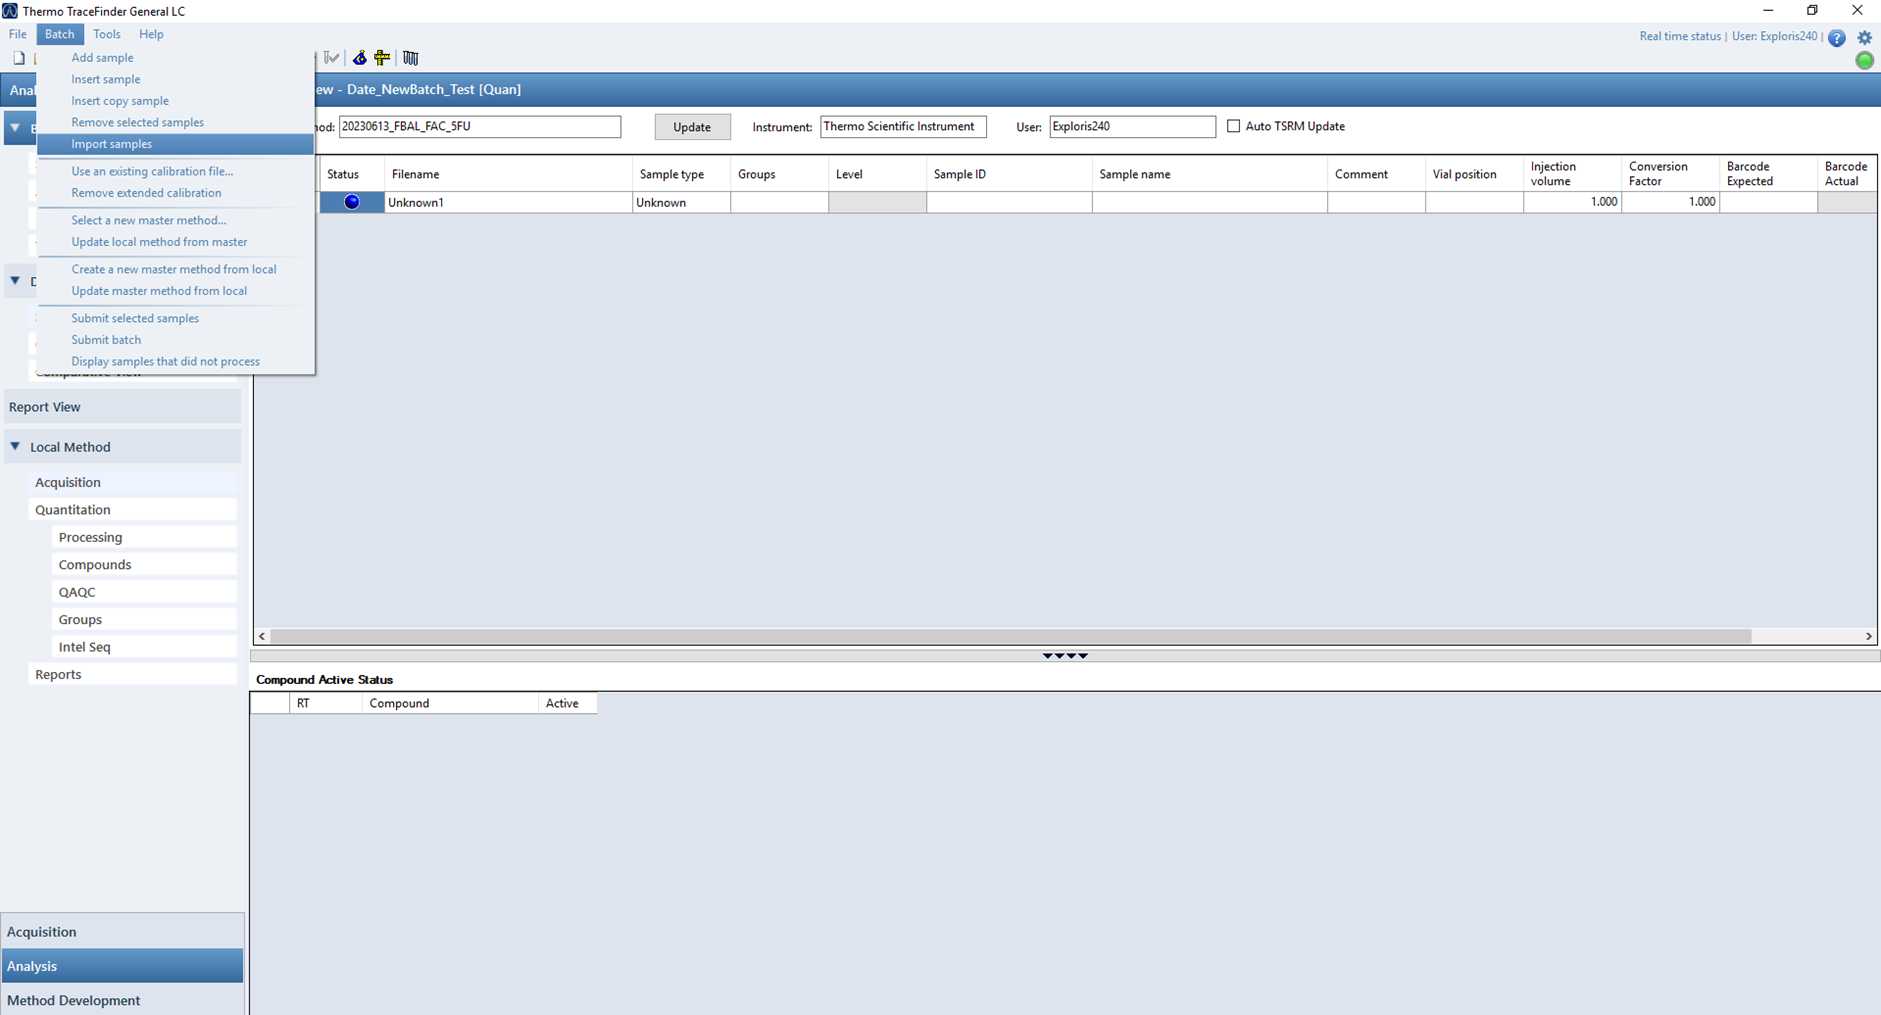
- Browse to the SLD file of the data set that you want to process.
- All samples in the SLD file will be imported into Tracefinder.
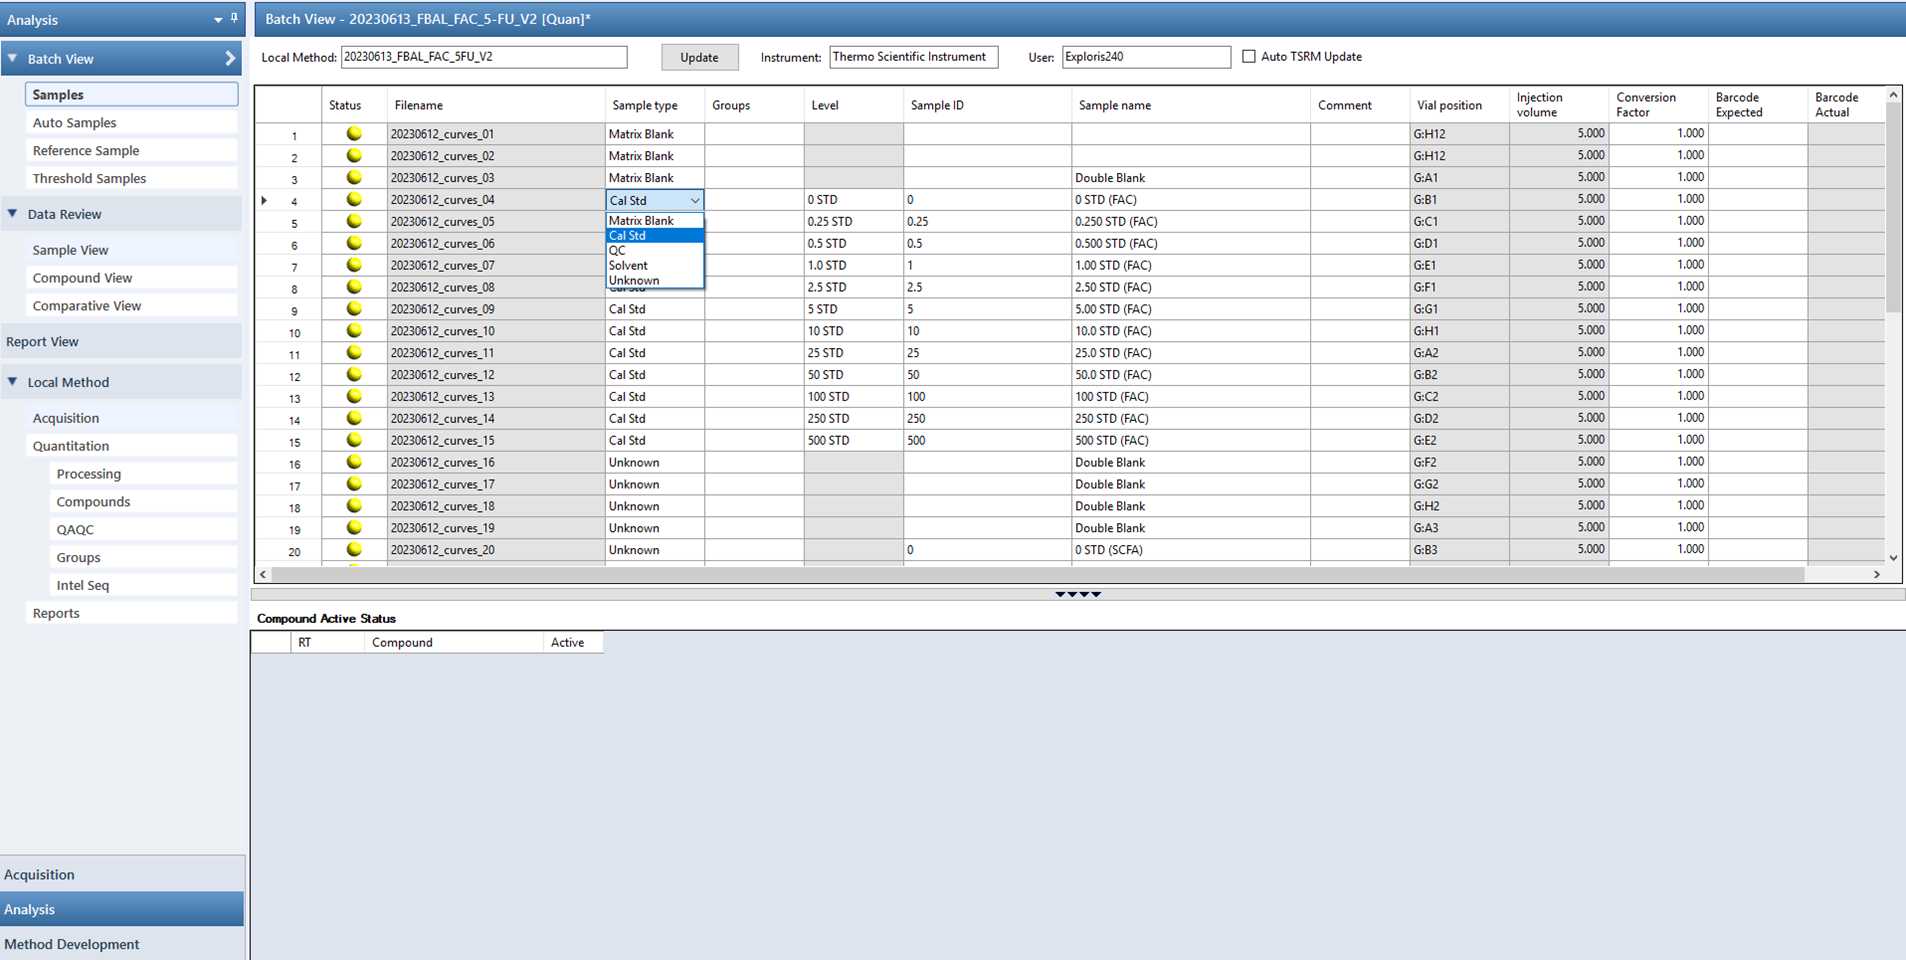
- Delete the topmost sample which is labeled 'Unknown' by right mouse click > remove selected samples.
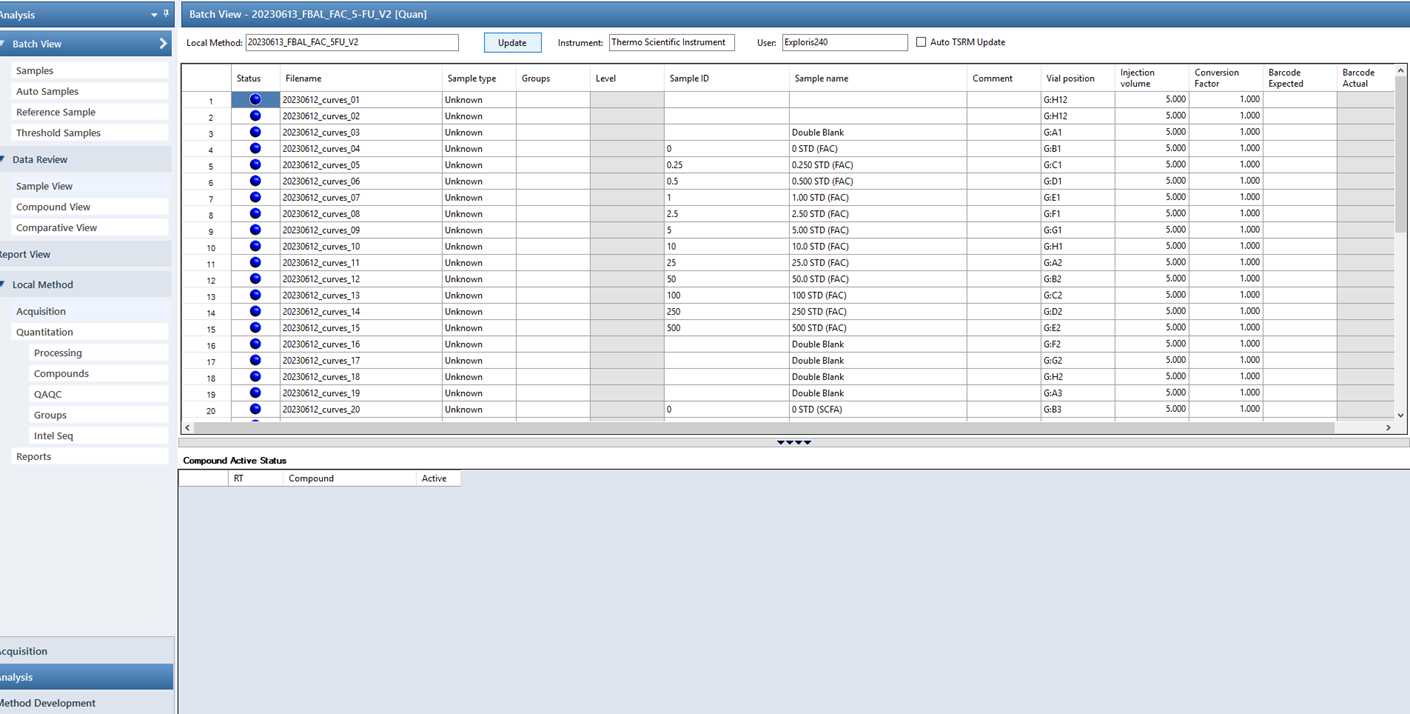
- Select the correct calibration level for each of the standards.
- At this point of processing, 'sample status' should be blue.
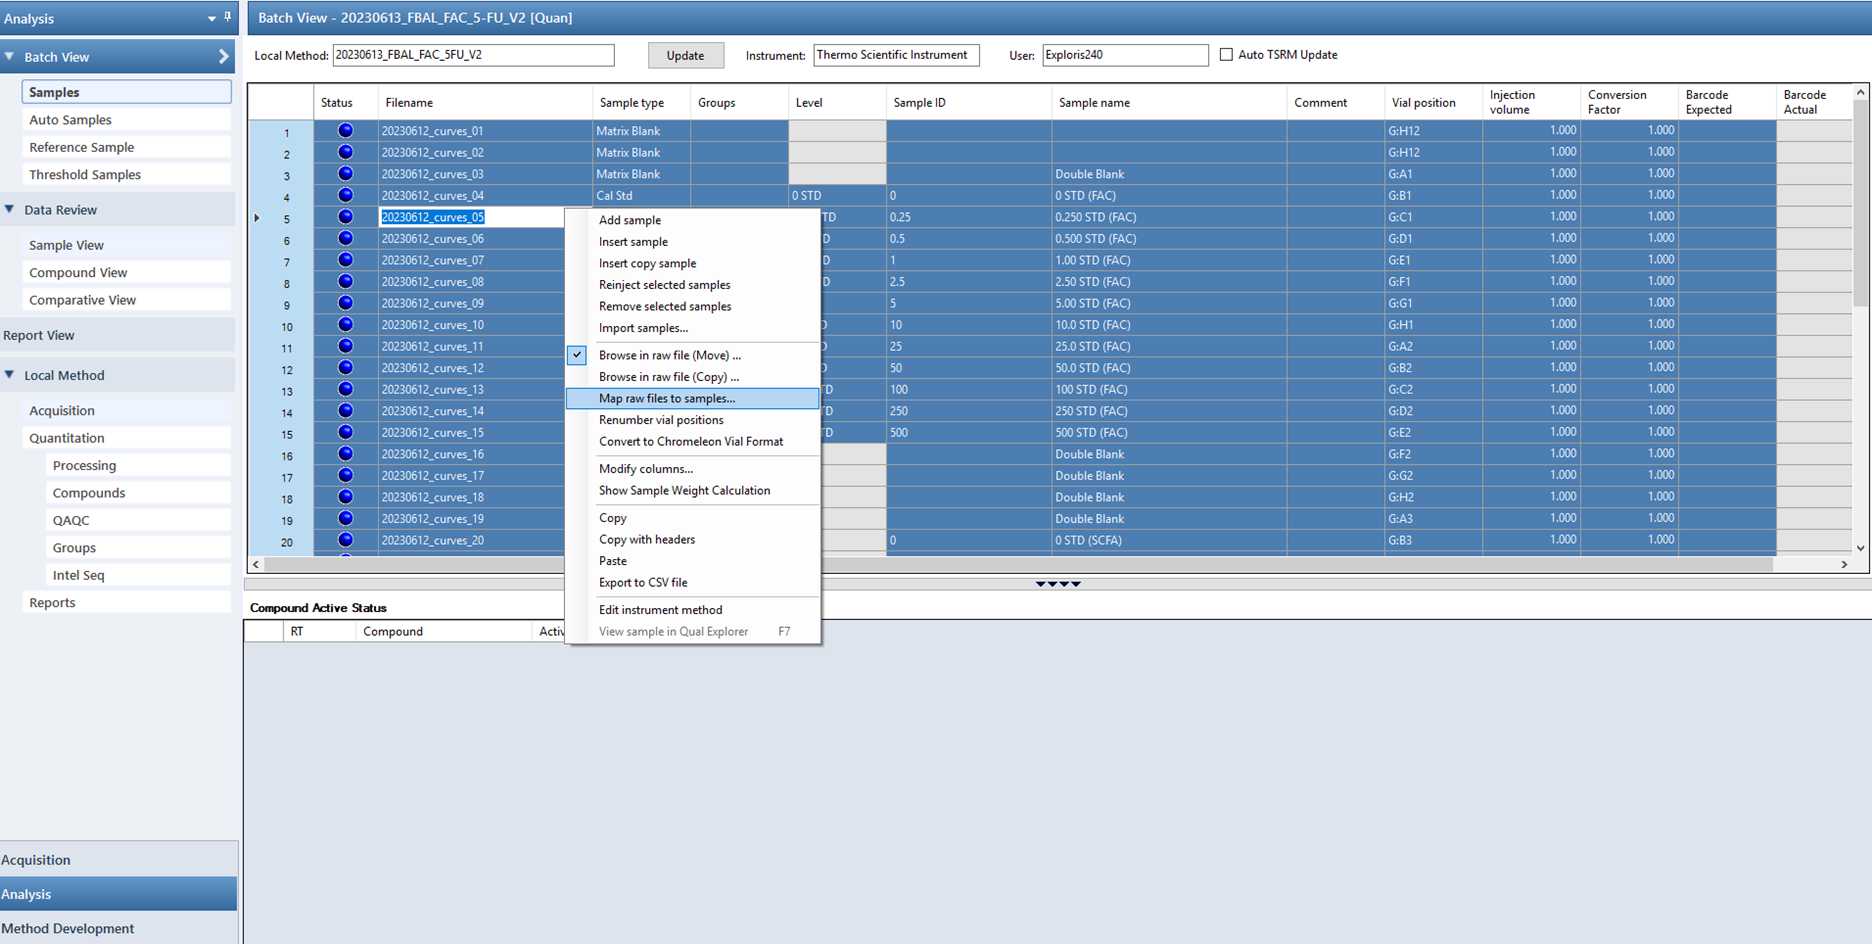
- Right click on one of the samples and select 'Map raw files to samples...'
- Select all raw files which appear in the windows file explorer window that pops up.
- The raw files should now be linked to each individual sample in the batch. At this point of processing, 'sample status' should turn yellow.
Submit your batch for processing by clicking on the following icon at the top of the screen:
The following screen should pop up:
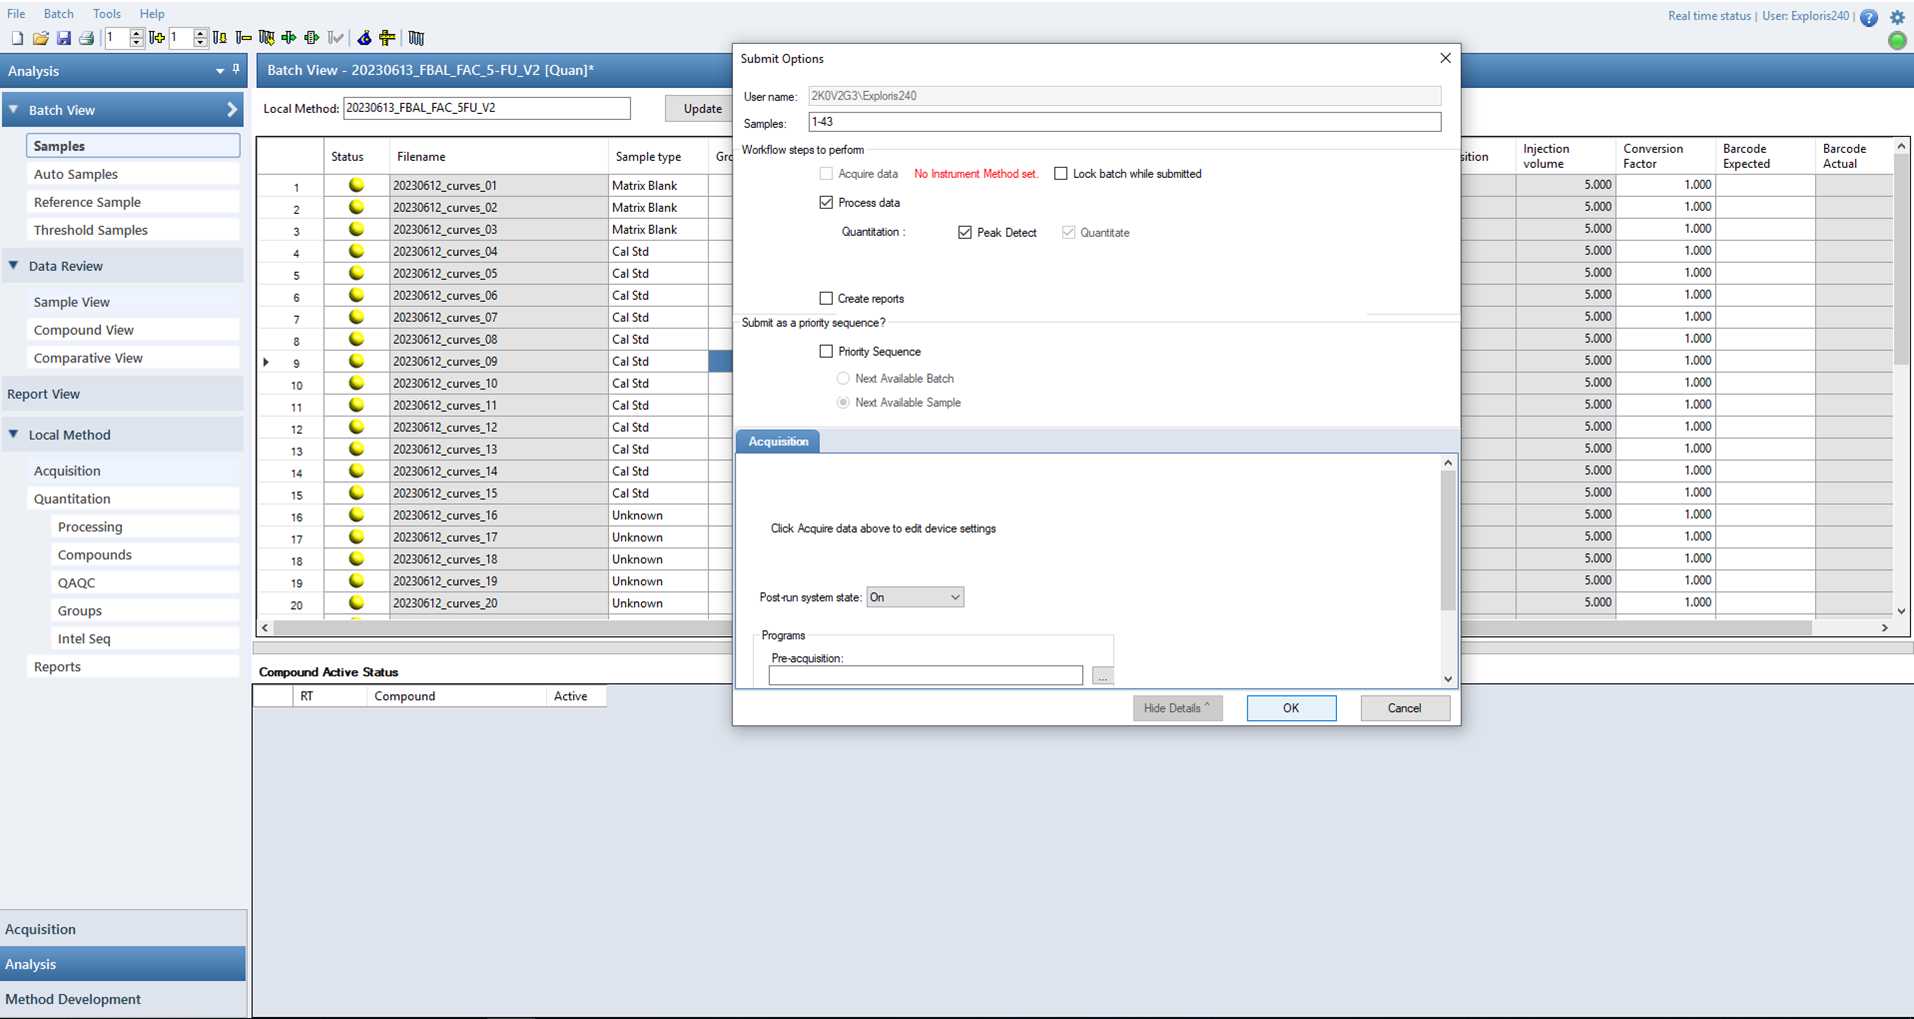
- Click on 'OK' and all data should now be processed according to your master method.
- At this point of processing, 'sample status' should turn green.
Using TraceFinder to evaluate Xcalibur acquired LC-MS data
In TraceFinder, go to the 'Compound View' tab on the left hand side.
Here, each analyte can be evaluated in each sample.
- Check that all peaks have integrated and that there are peak areas for each analyte - reassign retention time if it is not quite picking the peak and visually assess peak area and retention time to ensure that the correct peaks have been integrated.
- Check the calibration curves for accuracy (<20%) and exclude those points that are outwith. Ensure there are a minimum of 6 points in each calibration curve and that they have a regression coefficient R>0.99.
Once you are satisfied with all calibration curves and the data of each sample, go to File > Save... to save your results.
Transferring TraceFinder alphanumeric data into Excel to summarise results
Go to File > Export data to > CSV or Excel...
A screen pops up:
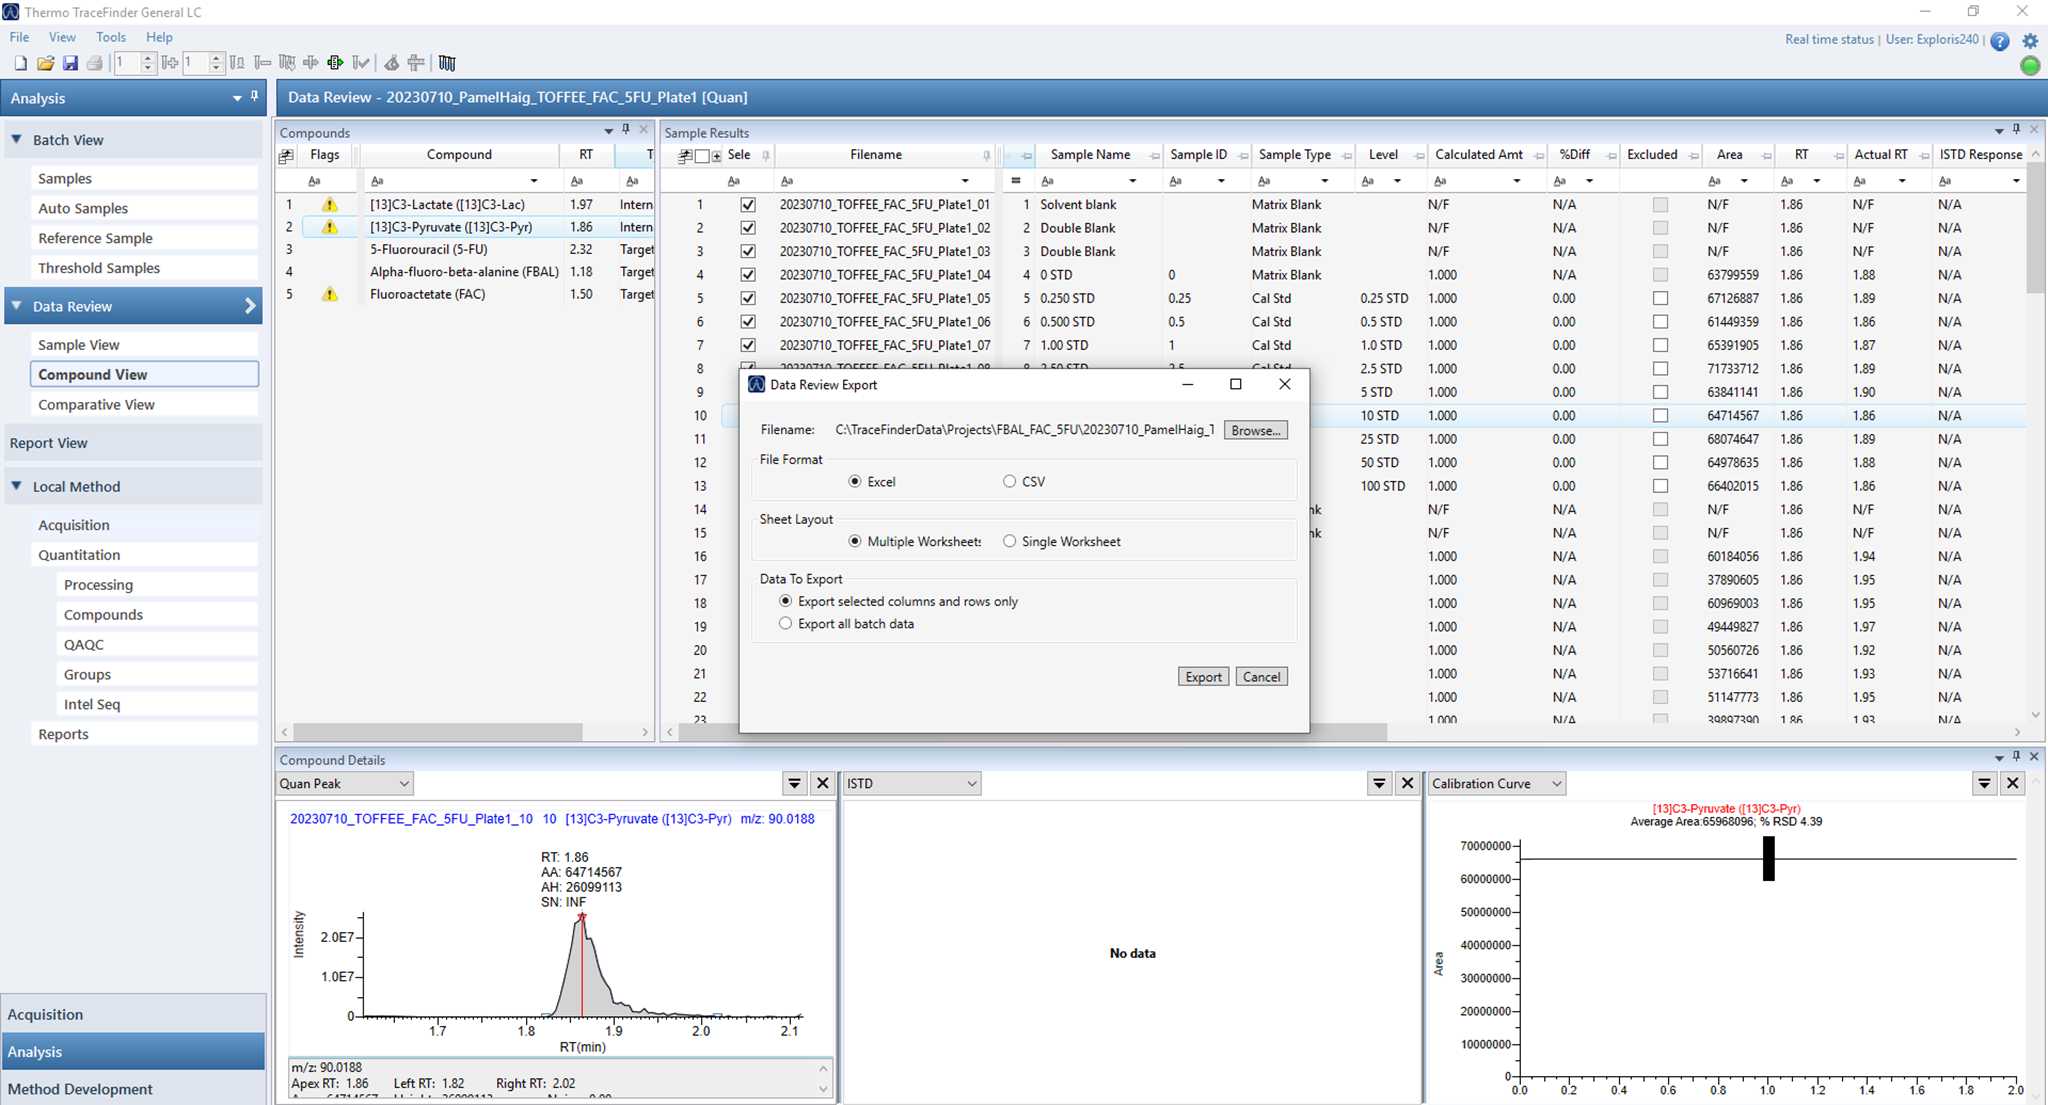
- Select 'Excel' as the file format.
- Select 'Multiple Worksheets' as the sheet layout.
- Select 'Export selected columns and rows only' as data to export.
Open the exported Excel file. All analytes should be sorted in individual tabs.
Create a new tab and call it 'Summary'.
Copy the sample names from one of the analyte tabs, and paste into the summary tab. Then return to the Analyte tab and copy the '[Analyte name] ng' column. Repeat this copying of the [Analyte name] ng column until all analytes in the excel file, have been copied. This results in a Summary table that is the major results of the analysis in terms of concentration.
If the calibration curve units are ng and the sample extracted has been a volume, add a column ahead of all analyte concentrations, include the volume extracted for each sample and then use this column to calculate the ng/mL amount by dividing the ‘calculated amount’ by the volume (uL) and multiply by 1000 to give the ng/mL amount of each analyte.
Save the excel file in the appropriate folder.
