Trinity College Botanic Garden long-term monitoring program
Midori Yajima, Michelle Murray, Jennifer McElwain, Stephen Waldren
Long-term
monitoring
plant
ecology
stomatal conductance
pollution
PM10
PM2.5
trees
climate change
botanic garden
Disclaimer
The protocol for measuring stomatal conductance, and water use efficiency in the field has been adapted from
Murray M, Soh WK, Yiotis C, Batke S, Parnell AC, Spicer RA, Lawson T, Caballero R, Wright IJ, Purcell C and McElwain JC (2019). Convergence in Maximum Stomatal Conductance of C3Woody Angiosperms in Natural Ecosystems Across Bioclimatic Zones. Front. Plant Sci.10:558. doi: 10.3389/fpls.2019.00558
Soh WK, Yiotis C, Murray M, Parnell A, Wright IJ, Spicer RA, Lawson T, Caballero R, McElwain JC (2019). Rising CO2 drives divergence in water use efficiency of evergreen and deciduous plants. Sci. Adv. 5, eaax7906
The protocol for quantifying PM interception has been adapted from
Baldacchini C, Castanheiro A, Maghakyan N, Sgrigna G, Verhelst J, Alonso R, Amorim JH., Bellan P, Ðunisijević BD, et al. (2017) How does the amount and composition of PM deposited on Platanus acerifolia leaves change across different cities in Europe? Environmental science and technology / American Chemical Society - ISSN 0013-936X - 51:3, p. 1147-1156
Abstract
Botanic gardens hold large, documented, and accessible collections of living plants. These represent unique subsets of taxa from different biogeographical regions growing under common environmental conditions, connecting people to global plant research and conservation efforts while offering a place beneficial for human health and wellbeing. Despite Botanic Gardens being an ideal setting for climate change research, their potential for comparative, long-term studies and outreach in the field is still underutilised. As part of its ten year strategy, Trinity College Botanic Garden (TCBG) aims to tap this potential and establish a programme for long-term (>30 years) monitoring of key physiological performances in its living woody plant collection. The programme will also assess particulate pollution (PM10 and PM2.5) interception by the same trees, pairing climate change and urban green research. Importantly, the project will include the design of a transferable protocol, produce vouchered herbarium specimens as a future historical archive and as a pedagogical tool, and support the garden outreach strategy, so as to nurture its link with both Trinity College Dublin and local communities, ensuring the garden’s legacy into the future.
Steps
Stomatal conductance
When End of the growing season (July, not later than mid-August)
Leaf selection
1.1.1 Select 3 leaves per tree
1.1.2 Per each leaf
- Tag leaf with a ribbon a code that will work as leaf ID (e.g. the first leaf measured on Arbutus unedo will be AU01)
- Make note of leaf orientation (the N/S/E/W direction the leaf is facing)
- Make note of GPS position of the tree (if new tree from the ones already used)
Porometry
1.2.1 1.2.1 Take 1 porometry reading x each leaf x each tree
- Once per day between 08:30 h and 14:00h
- Over 3-5 consecutive days. Repeat approximately at the same time every day (to account the natural day-to-day variability in gs for each species under ambient conditions) following same order of trees and leaves measured
Note
Equipment-related:Calibrate every day or if temp changes of ca 15 degreesMeasure at the prevailing microclimate condition of that dayMeasure in automatic mode - measures continuously and derive best estimate for leafLeaves-related:Measure at the interveinal areolae at mid-lamina of the abaxial surface. In the case of compound leaves, measure the terminal leaflet; for larger leaves clamp the sensor as far onto the leaf as possible, taking care to avoid damage to the leaf marginMeasure leaves at the the same position in the crown (e.g. base level, arm reach), to normalise for WUE and gs changes with tree heightMeasure always at the same position (e.g. right blade of leaf that face me)During the measuremets:Minimise interfering with the leaves (look away or wear mask to avoid changing CO2 conditions locally, move the leaf as little as possibleName the reading with leaf ID
1.2.2 1.2.2 At each tree measure and take note also of
- Temp (°C), RH% at each tree with thermo-hygrometer
- Solar radiation at each leaf with ceptometer's small sensor
- Any other condition met while taking the measurements (e.g. sudden wind, moving the leaves too much)
Download results
- Convert in .csv format
- Clean data (variable names lowercase, no spaces, keep only relevant info, add meatadata taken in the field i.e. temp, rh, notes). Final dataset should look like " Expected results" below
Download metadata
- Take weather data from the garden MET station, readings from the 30 days before the monitoring (monitoring days included)
- Clean data. Final dataset should look like " Expected result" below
Leaf Area Index
When During porometry, after taking stomatal conductance readings. It may not be possible to take LAI for each tree, depending on their local conditions (e.g. for trees that are shaded by other trees)
LAI readings
TBD
Elemental analysis/ Water Use Efficiency
When Immediately after the last day of porometryCollection needs to be after a period of 5 to 10 days of no rain and low winds, to avoid particulates to being washed away
Leaf selection
Same 3 leaves x tree used for porometry
Leaf collection and dehydration
2.2.1 Pick leaves and tag them with the same code used previously
2.2.2 Press in plant press for approx. 2 weeks, changing newspapers regularly or Oven dry or Oven dry at 50-60 °C for 2 days
2.2.3 Sort dried leaves in separate envelopes reporting leaf ID
Elemental analysis in the lab
TBD
Water Use Efficiency
TBD
Particulate Matter analysis
When Collection must be immediately after the last day of porometry, or soon after. It has to be after a period of 5 to 10 days of no rain and low winds, to avoid particulates to be washed away
Leaf selection
- 3 leaves x tree , choosing leaves close to the ones used for porometry/ elemental analysis (same branch, similar dimension and orientation if possible)
Leaf collection and dehydration
3.2.1 Pick leaves and tag them with the same code used previously + progressive numbering (i.e. sample ID that will be used in Scanning Electron Microscopy (SEM) later)
3.2.2 Wrap leaves in lint-free tissue to avoid contamination from paper fibers or other sources while pressing
3.2.3 Press in plant press for approx. 2 weeks, changing newspapers regularly or leave the press in oven at 50-60 °C for 2 days. Leaves need to be pressed so that can be imaged correctly under the SEM later
3.2.4 Sort dried leaves in separate envelopes reporting leaf ID and sample ID, keeping them wrapped in lint free tissue
Samples preparation in the Centre for Microscopy and Analysis lab
3.3.1 Cut 1 sample of 0.5 x 0.5 cm ca from each leaf with single edged blade
3.3.2 Prepare SEM stubs with conductive tabs
3.3.3 Using tweezers, mount 1 sample x stub and press firmly with lint-free tissue
3.3.4 Paint the edges of the sample with carbon paint (pure graphene) to prevent curling while in the SEM
3.3.5 Mark the bottom of the stub with the sample ID
3.3.6 Leave samples mounted on the stubs to dry out for 1-2 days
3.3.7 Carbon coat samples at 20 nm thickness
Analyses using TESCAN MIRA3 TIGER SEM
3.4.1 Set microscope settings
3.4.2 Map samples
For each sample, pick 3 sub-sample areas at random at low magnification and increase resolution at 800 X
For each sub-sample
- Take micrographs using Secondary Electron light (SE) (optional)
- Map samples with Energy Dispersive X-Ray Spectroscopy (EDS) using Back Scattered Electron light. Map will be performed using the integrated AZtec software
- Label sub-samples as A, B, C (so e.g. sample 1, will have 1A, 1B, 1C)
3.4.3 Save project in double copy
Analyses using offline computer
3.5.1 Download saved project and open with AZtec
3.5.2 Set feature analysis settings
For each sub-sample
3.5.2 Select PM on the sample surface by tresholding image to select features by their appearance (PM will be distinguishable from the background, can be selected highlighting lighter part of the spectrum for heavy metals, darker for carbon-based particulates)
3.5.3 Adjust filter settings to better select PM (e.g. use erosion filer if feature is bigger than actual PM when observed in the background). If filter settings still highlight features not corresponding to any actual PM, manually delete the features that do not match
3.5.4 Extract data on highlighted features, showing morphological and chemical information as in "Expected result" below
3.5.5 Copy-paste data on spreadsheet
Download results
- Convert in .csv format
- Clean data. See "Expected results" below
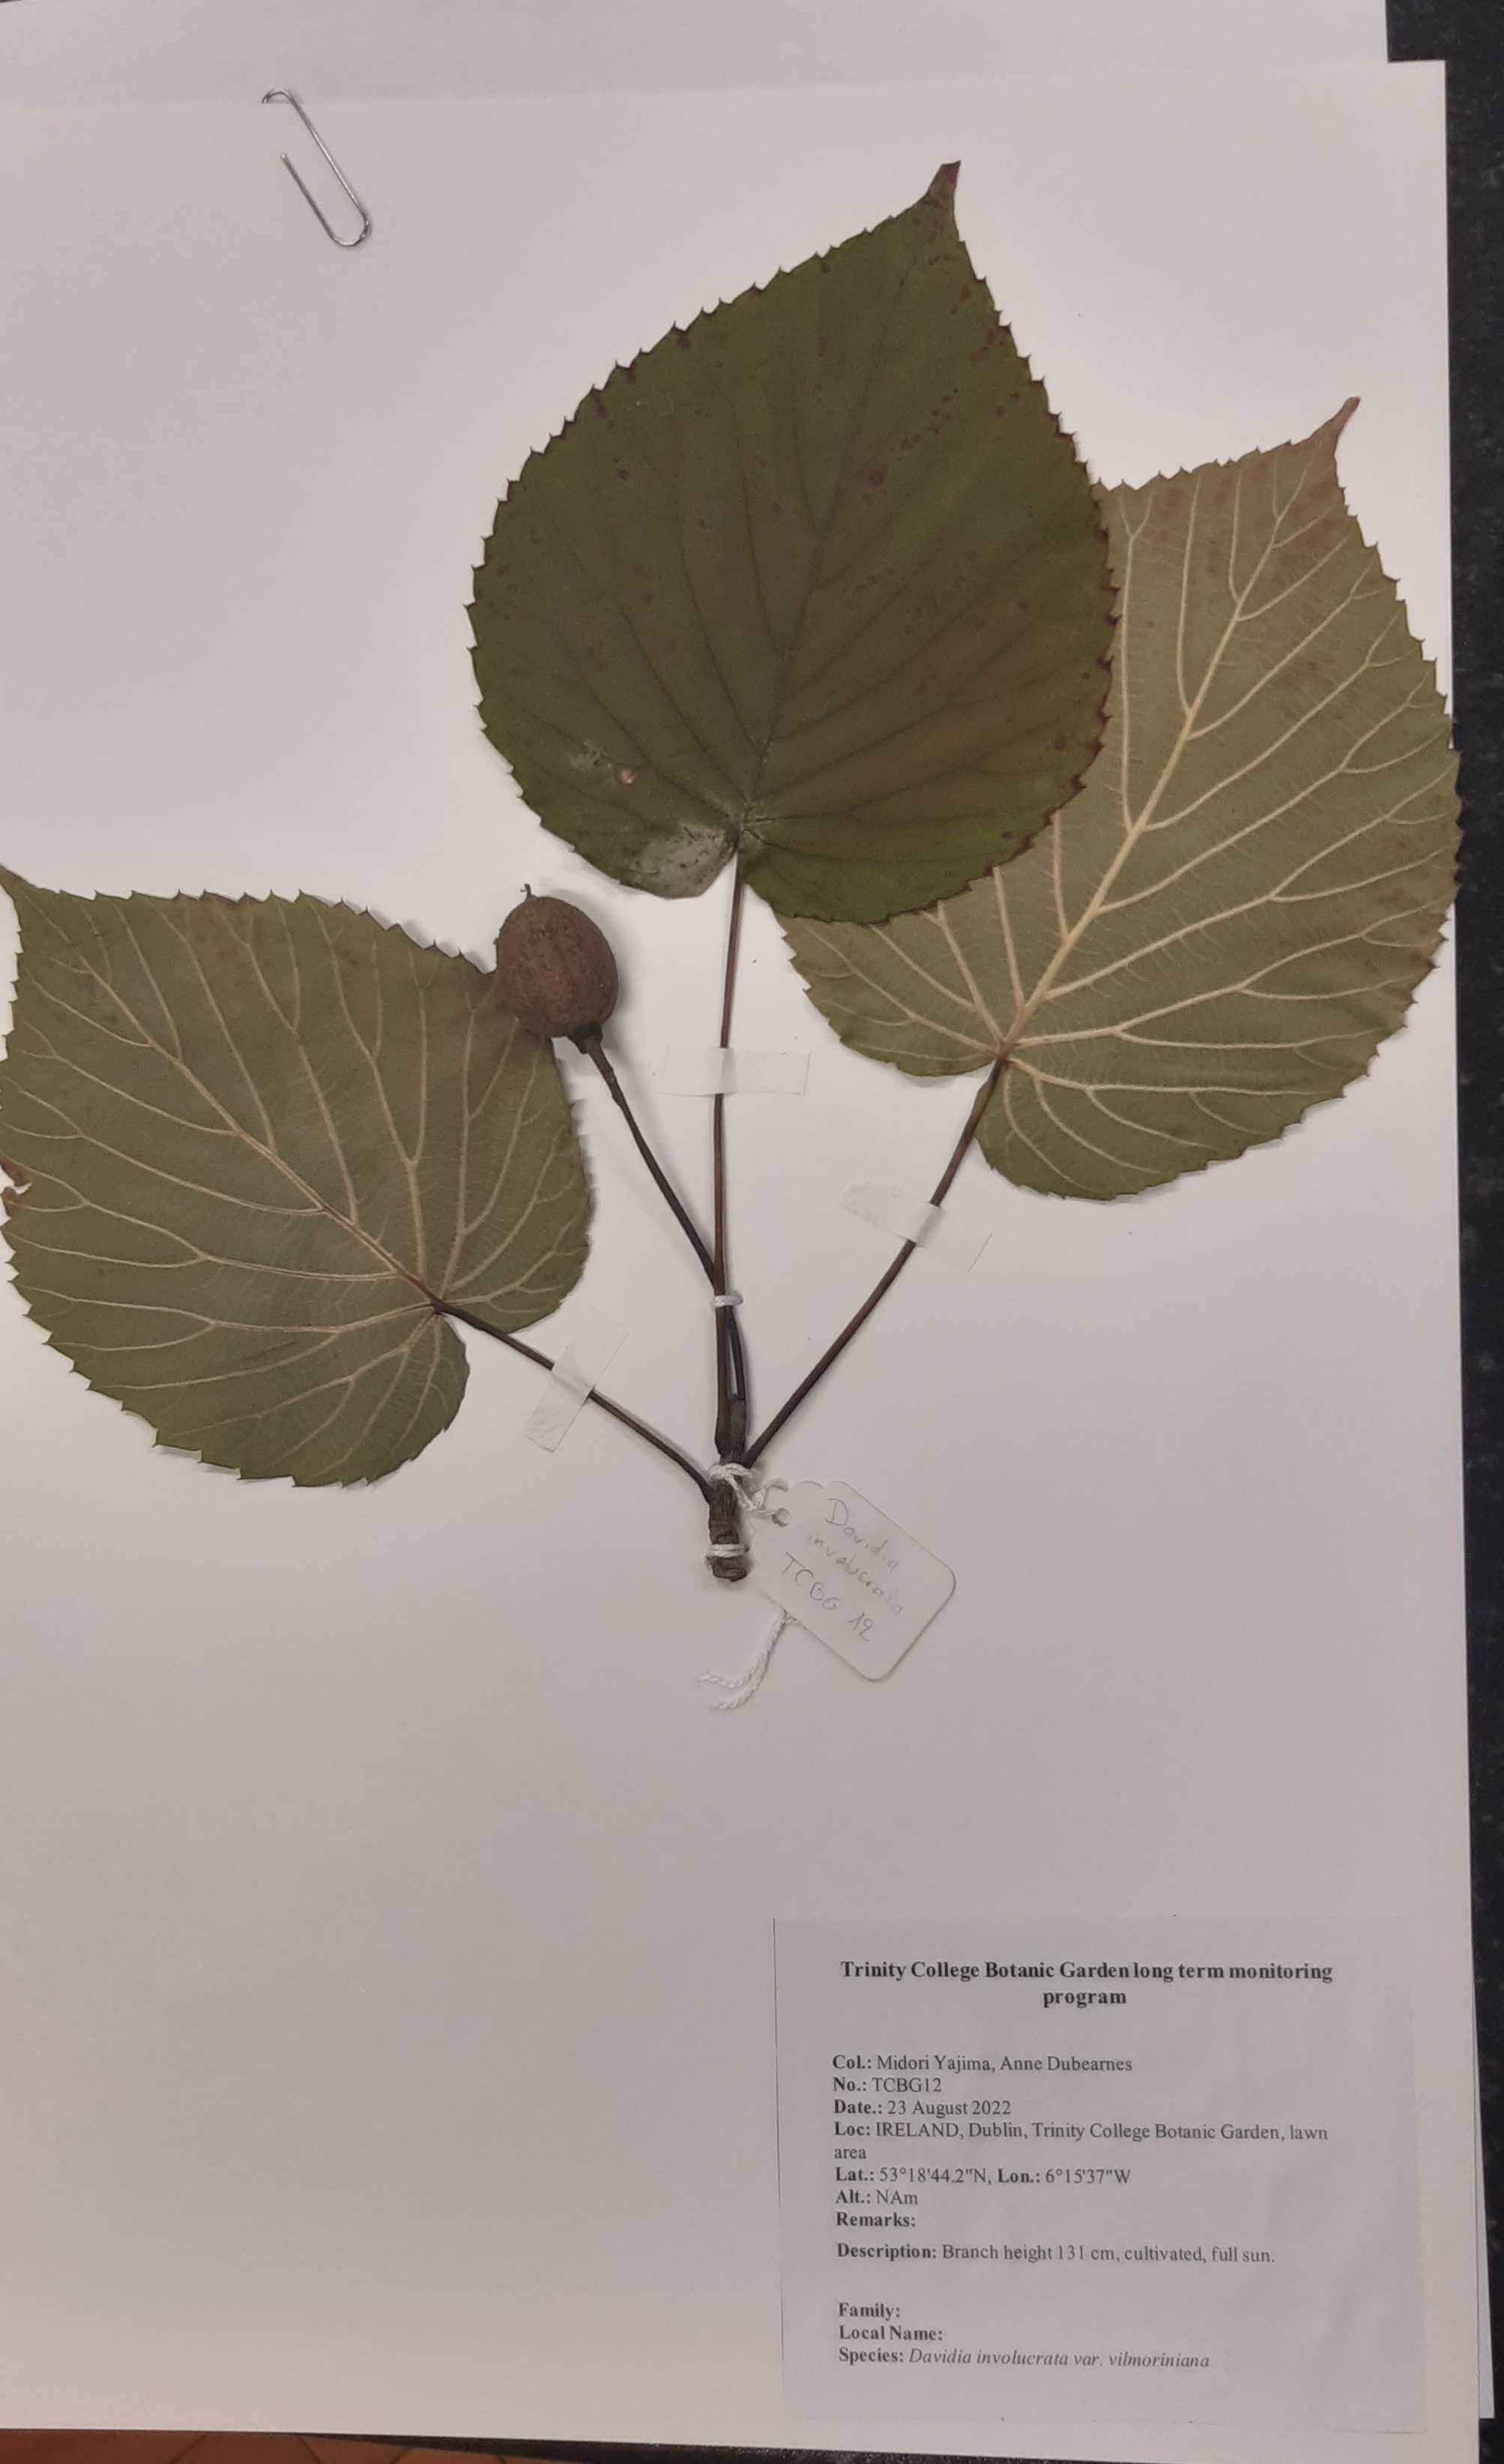
Herbarium sheets
When Collection must happen immediately after the last day of porometry, or soon after. It must be in dry weather to avoid molds in specimens
Selection of the specimen
4.1.1 Select and pick 1 specimen x tree for the actual herbarium sheet + 2/3 extra leaves (or leaflets) to preserve for any future analysis
4.1.2 Label each specimen annotating species name
4.1.3 Separately, make note of
- Species name
- Specimen ID , as "TCBG sample-number" e.g. "TBCG1". Each specimen ID must be unique, so latest specimens have to continue the numbering of the herbarium sheets made in previous years
- Date
- Collectors
- Coordinates (can be taken from previous specimens)
- Location in the garden (e.g. walled garden, west arboretum etc. can be taken from previous specimens)
- Notes , including branch height when on the tree, ecological notes
4.1.3 Place specimen in plastic bag for transport (ideally one bag per specimen)
Preparation of specimens
4.2.1 Dehydrate plants in plant press within 12 hours from collection. Store the plant press in a dry place for approx. 2 weeks, changing newspapers regularly
4.2.2 Once ready, drop the press with all the specimen in the Herbarium freezer inside the Botany Department for at least 72 hours, to kill any residual mold that could contaminate the specimen that are already in the Herbarium.
Making of herbarium labels
Print labels with information noted in the field
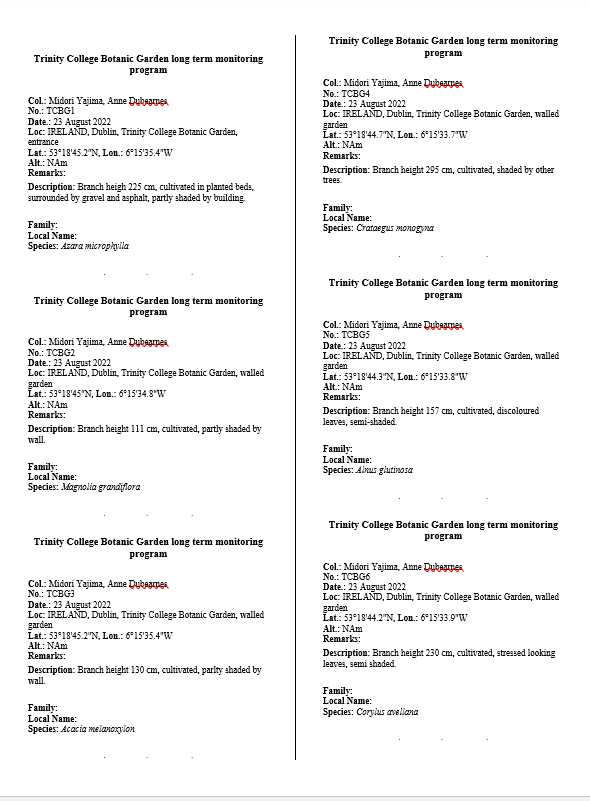
Making of herbarium sheets
4.3.1 Mount specimens on herbarium sheets, making sure to
- Stitching them instead of using glue. Use glue only if necessary (e.g. specimen is too heavy, there are too many leaves) so that each specimen can be removed and used for future analyses
- Storing the extra leaves in a separate paper bag attached to the sheet
- Printing and attaching herbarium labels reporting the information noted on the field
4.3.2 Store herbarium sheet in dedicated box in Trinity Herbarium
Upload data on Dryad
TBD
