Super-Resolution Single Molecule FISH at the Drosophila Neuromuscular Junction
Joshua S. Titlow, Lu Yang, Richard M. Parton, Ana Palanca, Ilan Davis
smFISH
single molecule fluorescence in situ hybridization
structured illumination
super-resolution imaging
3D-SIM
Drosophila melanogaster
larval neuromuscular junction
mRNA localization
synapse
Abstract
The lack of an effective, simple, and highly sensitive protocol for fluorescent in situ hybridization (FISH) at the Drosophila larval neuromuscular junction (NMJ) has hampered the study of mRNA biology. Here, we describe our modified single molecule FISH (smFISH) methods that work well in whole mount Drosophila NMJ preparations to quantify primary transcription and count individual cytoplasmic mRNA molecules in specimens while maintaining ultrastructural preservation. The smFISH method is suitable for high-throughput sample processing and 3D image acquisition using any conventional microscopy imaging modality and is compatible with the use of antibody colabeling and transgenic fluorescent protein tags in axons, glia, synapses, and muscle cells. These attributes make the method particularly amenable to super-resolution imaging. With 3D Structured Illumination Microscopy (3D-SIM), which increases spatial resolution by a factor of 2 in X, Y, and Z, we acquire super-resolution information about the distribution of single molecules of mRNA in relation to covisualized synaptic and cellular structures. Finally, we demonstrate the use of commercial and open source software for the quality control of single transcript expression analysis, 3D-SIM data acquisition and reconstruction as well as image archiving management and presentation. Our methods now allow the detailed mechanistic and functional analysis of sparse as well as abundant mRNAs at the NMJ in their appropriate cellular context.
Attachments
Steps
3.1 Larva Neuromuscular Junction Dissection
Video protocols for Drosophila larva dissection are available online [20, 21]. Pin the larva dorsal side up on a 35 mm Petri dish filled half way with Sylgard, by placing pins at the anterior and posterior ends.
Cover the larva with a few drops of saline buffer.
Use microdissection scissors to create a small incision at the centre of the dorsal midline.
Extend the incision along the dorsal midline toward the posterior end, then from the centre towards the anterior end of the larva, make the cuts as superficial as possible so as not to damage the underlying nervous system and muscle tissues.
Carefully remove gut tissue by holding the trachea with forceps and cutting the tracheal attachments at each abdominal segment. After cutting the trachea on either side the gut tissue and other organs can be carefully removed all at once, leaving the brain and nerves intact.
Place two pins into the outer “shoulders” of the anterior body wall and gently stretch the tissue away from the midline. Do the same for the posterior side.
At this point the brain can either be removed, by cutting the nerves just above the muscle tissue, or properly positioned for in situ imaging by gently stretching the head pin.
3.2 Fixation
Replace the dissection buffer with fix solution and incubate by gentle rocking at Room temperature for 0h 25m 0s.
Remove the fix buffer and rinse 3× with PBTX.
(Optional) If immunohistochemistry is to be performed, block the tissue by incubating for 1h 0m 0s in PBTX with 1% RNAse free bovine serum albumin.
Carefully transfer the tissue to a 0.75 mL microcentrifuge tube filled with 0.2mL and incubate for 4h 0m 0s – 24h 0m 0s at 4°C.
3.3 Hybridization
Replace the ethanol with 0.2mL and incubate for 0h 10m 0s at 38°C with gentle rocking.
Replace the wash buffer with 0.1mL and incubate for at least 4h 0m 0s (ideally 4h 0m 0s) at 38°C with gentle rocking.
3.4 Washing and Counterstain
Remove the hybridization buffer and rinse 3× with 0.2mL.
Incubate the tissue in 0.2mL for 0h 45m 0s at 38°C with gentle rocking.
(Optional) For counterstaining, add secondary antibodies (1:500 dilution) and/or DAPI. To label axon terminals in the NMJ use dye conjugated anti-horseradish peroxidase antibody (1:100 dilution) ( see Note 4 ).
(Optional) If tissues are counterstained, remove excess dye by washing 3× in the wash solution and incubating at 38Room temperature for 0h 15m 0s with gentle rocking.
3.5 Mounting
Remove the wash buffer and incubate tissue in Vectashield for several minutes ( see Note 5 ).
Place thin strips of double-sided tape across a glass microscope slide spaced about as wide as the coverslip.
Place a drop (~30µL) of Vectashield at the centre of the slide, between the strips of tape.
Position the tissues dorsal side up in the Vectashield and carefully place a coverslip on the strips of tape ( see Note 6 ).
Seal the coverslip with multiple layers of clear nail varnish, taking care not to let the varnish come in contact with the Vectashield.
For super-resolution imaging with silicone immersion lens (NA 1.3): dilute Vectashield to 70% with water and use High Precision No. 1.5 coverslips.
3.6 Image Acquisition on the Spinning Disk Confocal Microscope
Acquire optical sections of the region of interest using optimal imaging configuration for your system, i.e., choosing appropriate beam splitter, emission filter, laser power, and pixel size.
Exposure times of 600–800 ms are often required for camera-based imaging systems. The slowest scan speed and line averaging are often necessary on scanning confocal systems.
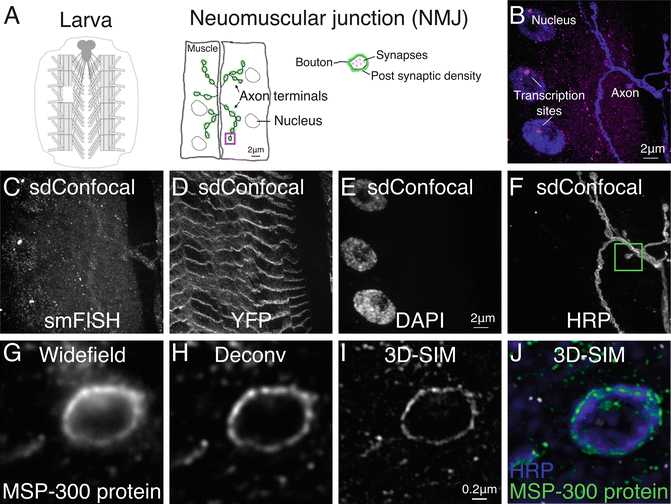
Single transcripts generally appear as discrete punctae with consistent intensities. An exception is in the nucleus where a high concentration of nascent transcripts form a much larger and brighter fluorescent focus at the gene locus (Fig. 1b).

3.7 Image Acquisition for 3D-SIM
Acquire 3D-SIM data according to manufacturer’s guidelines and good imaging practices, balancing signal–noise and bleaching while correcting for spherical aberration [22, 23]. Check raw data with the open source ImageJ plugin SIMcheck (Fig. 2).
![Fig. 2Representative output from SIMcheck. For detailed explanation of these plots and statistics see [18] Fig. 2Representative output from SIMcheck. For detailed explanation of these plots and statistics see [18]](https://static.yanyin.tech/literature_test/protocol_io_true/protocols.io.bprbmm2n/978-1-4939-7213-5_10_Fig2_HTML.png)
Perform image reconstruction using commercial software that accompanies the instrument (in our case, SoftWORX by GE for the OMX V3) or an open-source alternative, such as fairSIM [24]. For multichannel imaging you will need to register channels using Tetraspec beads data and an appropriate image registration software.
Check the quality of reconstruction using SIMcheck (Fig. 2).
3.8 Image Management Using the OMERO Database (Open Microscopy Environment)
Install an OMERO server and import your data to it with the OMERO.insight client software [25-27]. Use the “tagging” facilities to organize your imaging data. The initial installation and subsequent super-user management of the server requires some degree of system administration experience. OMERO software is open source and released by the OME Consortium at www.openmicroscopy.org. Look at the online video tutorials, such as http://help.openmicroscopy.org/importing-data-5.html and at the installation instructions. This client-server software integrates visualization, data mining, and image analysis of biological microscopy images. OMERO through its use of the Bio-Formats importer (http://www.openmicroscopy.org/site/products/bio-formats) and conversion to OME-TIF supports over 140 image file formats and the raw data can be managed from the web or exported from the online platform to a third party software like ImageJ (Fiji).
Use the OMERO web browser to view and organize the primary imaging data using searchable tags.
Use OMERO to share the data between collaborating scientists from any location with Internet access.
Create and highlight figures from typical data sets using OMERO.figure (video http://figure.openmicroscopy.org/videos.html ). OMERO.figure uses unique OMERO IDs for each image, from which the figure panels are made, to link to the original raw image data. Therefore, figures can be adjusted with great ease and other scientists in a team can easily view the original data. While OMERO-Figure can be used to add some annotations to the figure panels, we find that publication ready figures require the use of other image manipulation software.
3.9 Image Analysis (See Note 7)
3.9.1 Find Foci
Install and open the FindFoci GUI application in ImageJ; Plugins >GDSC > FindFoci > FindFocus GUI [16].
Open an image in ImageJ and split the channels; Image > Color > Split Channels.
Select the smFISH channel in the FindFoci GUI.
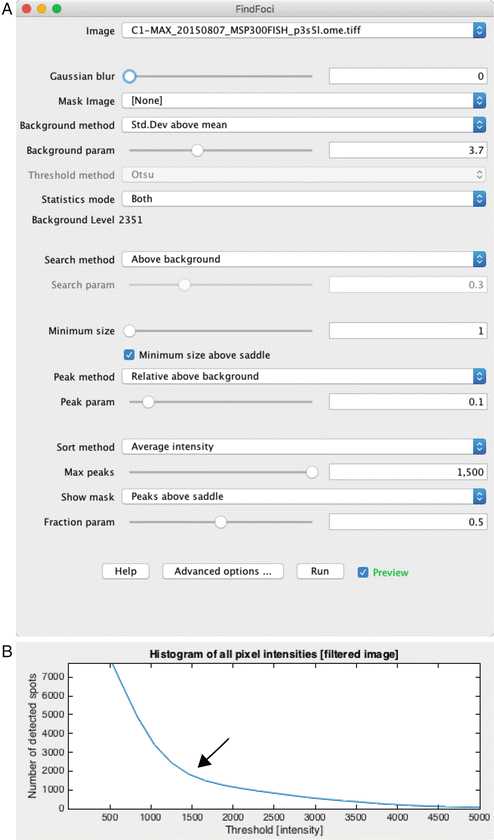
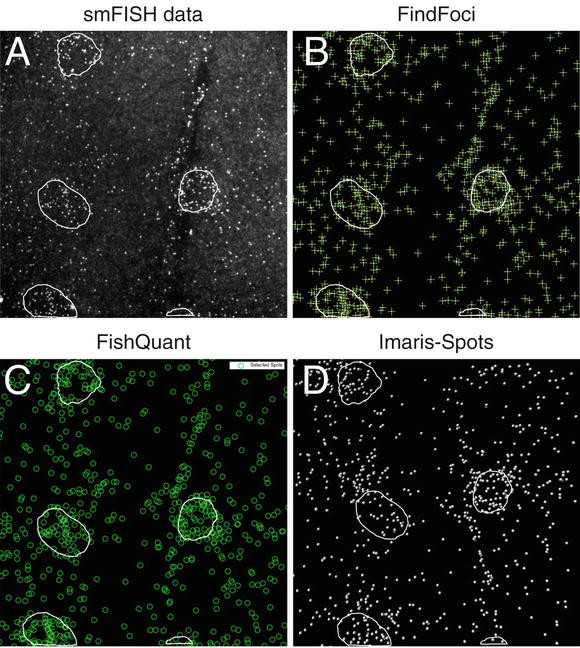
The GUI has a live preview mode that displays identification of points under various threshold settings. Using the configuration shown in Fig. 3, adjust the “Background param” slider until labels appear over each spot (Fig. 4b).


Number and features of the foci can be obtained from the measurement table or exported as a text file.
3.9.2 FISHQuant (Fig. 4c)
Save images to be analyzed into separate channels, FISH channel and marker channels for segmentation, and start the FISHQuant application in Matlab [17].
Follow the FISHQuant manual for loading data, filtering the image, and thresholding the spots.
Adjust the threshold parameters until each of the spots are marked in the GUI tool. The intensity profile will typically show an obvious separation between background and real spots (Fig. 3b).
Export the thresholded spots text file to determine the number of transcripts.
3.9.3 Imaris Spots (Fig. 4d)
Open the image with Imaris.
Choose the Spots tool.
Provide an estimated diameter for the spots (350 nm works well).
Slide the spot quality threshold tool until foci are accurately identified. The intensity profile will typically show an obvious separation between background signal and labeled mRNA (Fig. 3b).
Save the statistics text file to determine the number of transcripts.

