Singleplex qPCR for SARS-CoV-2 N1 and BRSV
Christine Moe, Jamie VanTassell, Julia Raymond, Marlene K Wolfe, Pengbo, Chloe Svezia, Anh Nguyen
Abstract
This protocol describes the procedure to perform RT-qPCR for the detection of the SARS-CoV-2 N gene and a processing control (BRSV) in RNA extracted from wastewater samples. For samples obtained with a Moore swab, results will indicate the presence or absence of each target. For grab or composite wastewater samples, results may be used to estimate the concentration of the target in the original sample.
Before start
Steps
Software Preparation
Open BioRad CFX Manager Program.
Set up well plate template:
- Load the appropriate fluorophores into the appropriate wells (FAM is used for this assay).
- Select for designated controls (no template controls, negative, and positive), standards (with concentrations), and unknowns (samples).
- Name wells for samples accordingly.
Preparation
Ensure that assay mix is prepared in advance for both N1 and BRSV assays (primers and probes mixed at appropriate concentrations and stored for future use at -20°C , see Appendix I for details).
Ensure that standard curve aliquots have been prepared for SARS-CoV-2 (see Appendix II for details).
Spray surface of hood and wipe pipettes with 10% bleach. Let dry, and repeat with 70% ethanol. Wipe off carefully.
Retrieve RNA from wastewater samples and thaw on ice.
Thaw the reagents from Invitrogen™, primers, and probes at Room temperature .
Prepare spreadsheet list of all samples to run to set up PCR template and to establish volumes needed for each reagent.
Procedure
Place all reagents on ice, including molecular biological grade water aliquot.
Confirm hood light is off to prevent denaturation of probes before starting mixture preparation.
Prepare two 1.7 mL microcentrifuge tubes labeled "N" and "B". Create the master mixes for each assay by mixing components under a clean hood in the order written in the tables below. Utilize the spreadsheet template to calculate the total volume of each component needed for the number of samples to be run.
| A | B | C | D |
|---|---|---|---|
| N1 | N (μL/well) | Initial Concentration | Final Concentration / Well |
| Molecular biology grade water | 8.5 μL | – | -- |
| 4X TaqPath Master Mix | 5.0 μL | 4X | 1X |
| IDT N1 Primer and Probe Mix | 1.5 μL | 13.3X | 1X |
| Primers | -- | 4 μM | 300 nM |
| Probe | -- | 2 μM | 150 nM |
| Template RNA | 5 μL | – | – |
| Total volume | 20.0 μL | – | -- |
N Master Mix
| A | B | C | D |
|---|---|---|---|
| BRSV | B (μL/well) | Initial Concentration | Final Concentration / Well |
| Molecular biology grade water | 8.0 μL | – | -- |
| 4X TaqPath Master Mix | 5.0 μL | 4X | 1X |
| BRSV Primer and Probe Mix | 2.0 μL | 10X | 1X |
| Primers | -- | 4 μM | 400 nM |
| Probe | -- | 2 μM | 200 nM |
| Template RNA | 5 μL | – | – |
| Total volume | 20.0 μL | – | -- |
B Master Mix
Vortex both N and B mixes for 5 seconds, then spin down for 5 seconds.
Aliquot 15µL of the master mix to each designated well on the PCR plate. Change pipette tips between wells and dispose used pipette tips into trash.
Move the PCR plate to the lab’s PCR bench for adding template. Do not add template in the hood.
Spray surface of PCR bench and wipe pipettes with 10% bleach and then repeat with 70% ethanol. Wipe off carefully.
Retrieve thawed RNA from wastewater samples. Vortex briefly and spin down.
Add 5µL of RNA template into the appropriate well on the PCR template, changing pipette tips in between each well.
For the PCR no template control (NTC), add 5µL of molecular grade water.
For the extraction negative control, add 5µL of control produced each time when extracting the RNA.
For positive control for Moore swab samples, add 5µL of diluted inactivated SARS-CoV-2 sample stored in -80°C freezer.
For the standard curve for grab or composite samples, add 5µL of standards to designated wells in order, starting from the number of lowest to highest genomic copies (gc).
| A | B | C | D | E |
|---|---|---|---|---|
| Std G | Std F | Std E | Std D | Std C |
| 10 gc | 100 gc | 1,000 gc | 10,000 gc | 100,000 gc |
gc = genomic copies
Once plate is completed, seal the wells with adhesive sealing film and spin down for 0h 5m 0s on a balanced 96-well plate centrifuge.
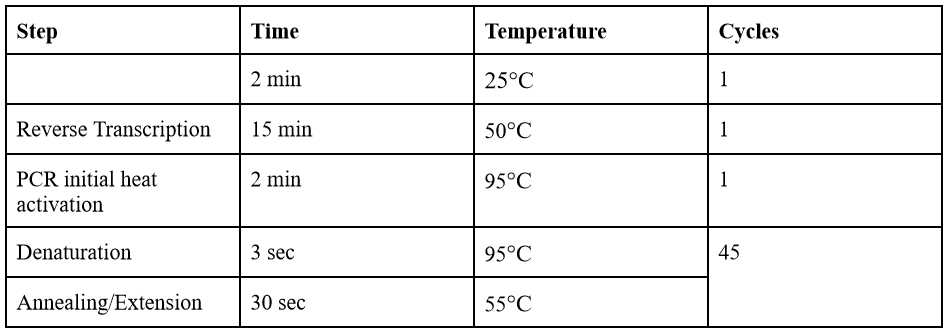
Place samples in Bio-Rad Detection System and start PCR run with the appropriate thermocycling conditions as listed above.
Wipe down the pipette and surface with 10% bleach and then 70% ethanol.
Store leftover RNA samples in the freezer at -20°C .
Viewing and Saving Data
Export data as an Excel file or CSV file for viewing and analysis.
Interpreting Results
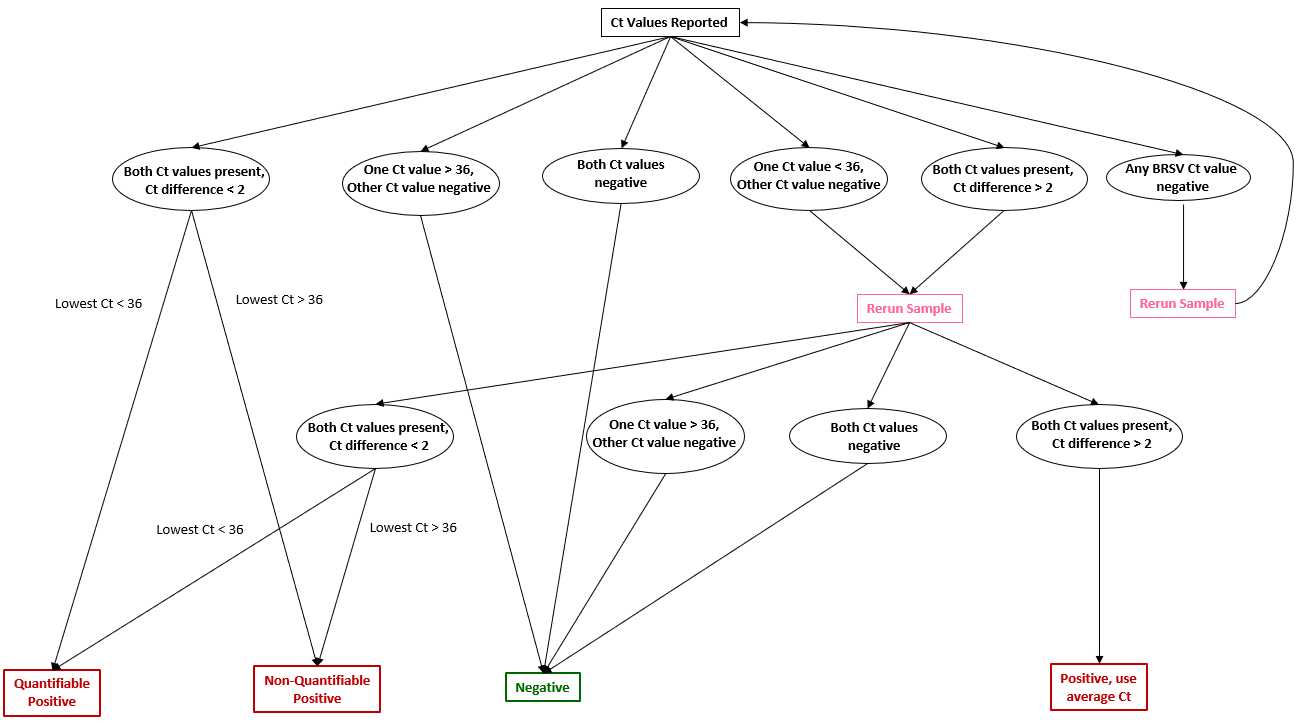
After viewing results, utilize the following decision tree to determine if results pass QA/QC.

- If both Ct values are present and the Ct difference is less than 2 --> Positive
- If the lower Ct value is less than 36 --> Quantifiable positive
- If the lower Ct value is greater than 36 --> Non-quantifiable positive
- If one Ct value is greater than 36 while the other is negative --> Negative
- If one Ct value is less than 36 while the other is negative --> Rerun sample
- If both Ct values are less than 36 and the Ct difference is greater than 2 --> Rerun sample
- If any Ct value of BRSV is negative --> Rerun sample
- For re-rerun results, if both Ct values are present and the difference is greater than 2 --> Positive, average the Ct values. Otherwise, follow the same aforementioned guideline
Appendix I - Primer/Probe Mix
For each assay, combine primers and probes to create a stock mix with a concentration of 4 μM for each primer and 2μM for the probe.
Example to create 250 μL primer probe mix with 100 μM starting solutions:
- 10 μL Forward Primer (100 μM stock)
- 10 μL Reverse Primer (100 μM stock)
- 5 μL Probe (100 μM stock)
- 225 μL of microbiological grade H2O
Vortex the mixture on a benchtop vortex and place into a -20°C freezer until needed for PCR.
Appendix II - Standard Curve Preparation
The standard curve should be composed of the following and generated as a dilution series:
| A | B | C | D | E | F | G |
|---|---|---|---|---|---|---|
| Dilution # | Name | RNA (μL) | Molecular Water (μL) | Final Volume (μL) | gc/μL | gc/5μL |
| 1 | B | 27 | 73 | 100 | 200000 | 1000000 |
| 2 | C | 30 | 270 | 300 | 20000 | 100000 |
| 3 | D | 30 | 270 | 300 | 2000 | 10000 |
| 4 | E | 30 | 270 | 300 | 200 | 1000 |
| 5 | F | 30 | 270 | 300 | 20 | 100 |
| 6 | G | 30 | 270 | 300 | 2 | 10 |
gc = genomic copies
Thaw Quantitative Synthetic SARS-CoV-2 RNA on ice. Add 27µL of RNA into 73µL of molecular water to create 100 μL dilution B.
Add 30µL of dilution B into 270µL of molecular water to create 300 μL dilution C. Vortex the mix.
Add 30µL of dilution C into 270µL of molecular water to create 300 μL dilution D. Vortex the mix.
Add 30µL of dilution D into 270µL of molecular water to create 300 μL dilution E. Vortex the mix.
Add 30µL of dilution E into 270µL of molecular water to create 300 μL dilution F. Vortex the mix.
Add 30µL of dilution F into 270µL of molecular water to create 300 μL dilution G. Vortex the mix.
Make 14 μL aliquots for each dilution and save at -20°C freezer. Keep the remaining dilution B in the -70°C freezer for future use.


