Resource 3: SSC Collection Optics and Calibration
Joshua A Welsh, Jennifer Jones
Disclaimer
This protocol summarizes key steps for a specific type of method, which is one of a collection of methods and assays used for EV analysis in the NCI Translational Nanobiology Section at the time of submission of this protocol. Appropriate use of this protocol requires careful, cohesive integration with other methods for EV production, isolation, and characterization.
Terms & Conditions of use for FCMPASS software.
Definitions: The term “SOFTWARE” throughout this agreement means the machine readable, binary, object code form, and the related documentation for FCMPASS, a software package that is designed to allow flow cytometer calibration for small particles. The term “RECIPIENT” means the party that downloads the software. The term “PROVIDER” means the National Cancer Institute (NCI), a participating institute of the National Institutes of Health (NIH), and an agency of the United States Government.By downloading or otherwise receiving the SOFTWARE, RECIPIENT may use the SOFTWARE subject to RECIPIENT’s agreement to the following terms:
- THE SOFTWARE SHALL NOT BE USED IN THE TREATMENT OR DIAGNOSIS OF HUMAN SUBJECTS. RECIPIENT is responsible for compliance with all laws and regulations applicable to the use of the SOFTWARE.
- RECIPIENT shall not distribute the SOFTWARE, in whole or in part without express advance written approval of PROVIDER.
- The SOFTWARE may be used for research, academic, and educational purposes only. The SOFTWARE may not be used for commercial purposes. RECIPIENT will not license or sell or use the SOFTWARE for commercial purposes or applications.
- The SOFTWARE that is distributed pursuant to this Agreement has been created by United States Government employees. In accordance with Title 17 of the United States Code, section 105, the SOFTWARE isnot subject to copyright protection in the United States. Other than copyright, all rights, title and interest in the SOFTWARE shall remain with the PROVIDER.
- RECIPIENT shall not modify, extend, decompile, make derivatives of, merge, publish, reverse engineer or distribute the SOFTWAREwithout written permission from PROVIDER.
- RECIPIENT may publish or otherwise publicly disclose the results of using the SOFTWARE. RECIPIENT agrees to acknowledge PROVIDER’s contribution of the SOFTWARE in all written publications containing any data or information regarding or resulting from use of the SOFTWARE.
- THE SOFTWARE IS PROVIDED "AS IS" AND ANY EXPRESS OR IMPLIED WARRANTIES, INCLUDING, BUT NOT LIMITED TO, THE IMPLIED WARRANTIES OF MERCHANTABILITY, FITNESS FOR A PARTICULAR PURPOSE AND NONINFRINGEMENT ARE DISCLAIMED. IN NO EVENT SHALL THE PROVIDER OR THE INDIVIDUAL DEVELOPERS BE LIABLE FOR ANY DIRECT, INDIRECT, INCIDENTAL, SPECIAL, EXEMPLARY, OR CONSEQUENTIAL DAMAGES (INCLUDING, BUT NOT LIMITED TO, PROCUREMENT OF SUBSTITUTE GOODS OR SERVICES; LOSS OF USE, DATA, OR PROFITS; OR BUSINESS INTERRUPTION) HOWEVER CAUSED AND ON ANY THEORY OF LIABILITY, WHETHER IN CONTRACT, STRICT LIABILITY, OR TORT (INCLUDING NEGLIGENCE OR OTHERWISE) ARISING IN ANY WAY OUT OF THE USE OF THIS SOFTWARE, EVEN IF ADVISED OF THE POSSIBILITY OF SUCH DAMAGE. PROVIDER makes no representations that the use of SOFTWARE will not infringe any patent or proprietary rights of third parties.
- RECIPIENT may, on an as-needed basis, send to PROVIDER reports regarding the application of the SOFTWARE and the effectiveness and problems encountered in using the SOFTWARE, without disclosing RECIPIENT’s confidential information. Information from general reports may be used by the PROVIDER to enhance the capabilities of the SOFTWARE. Reports can be forwarded to the PROVIDER at one of the following addresses: joshua.welsh@nih.gov or jennifer.jones2@nih.gov
- No indemnification for any loss, claim, damage, or liability is intended or provided by either Party under this Agreement. Each Party shall be liable for any loss, claim, damage, or liability that said Party incurs as a result of said Party's activities under this Agreement, except that Provider, as an agency of the United States, assumes liability only to the extent as provided under the Federal Tort Claims Act (28 U.S.C. Chapter 171 Sections 2671-2680).
- RECIPIENT agrees not to claim, infer, or imply endorsement by the United States Government, or any of its organizational units, contractors or employees. RECIPIENT agrees not to use any trademarks, service marks, trade names, logos or product names of NCI or NIH to endorse or promote products derived from the SOFTWARE without specific, prior and written permission.
- Title in the SOFTWARE shall remain with the PROVIDER. It is understood that nothing herein will be deemed to constitute, by implication or otherwise, the grant to either party by the other of any license or other rights under any patent, patent application or other intellectual property right or interest. PROVIDER reserves the right to distribute the SOFTWARE to others and to use it for PROVIDER’s own purposes. The United States Government explicitly retains all rights to use the SOFTWARE for any purpose, to have it used on the Government’s behalf or to allow others to use it.
Abstract
Flow cytometry (FCM) is a common extracellular particles (EPs), including viruses and extracellular vesicles (EVs), characterization method. Frameworks such as MIFlowCyt-EV exist to provide reporting guidelines for metadata, controls, and
data reporting. However, tools to optimize FCM for EP analysis in a systematic and quantitative way are lacking. Here, we demonstrate a cohesive set of methods and software tools that optimize FCM settings and facilitate cross-platform comparisons for EP studies. We introduce an automated small particle optimization (SPOT) pipeline to optimize FCM fluorescence and light scatter detector settings for EP analysis and leverage quantitative FCM (qFCM) as a tool to further enable FCM optimization of fluorophore panel selection, laser power, pulse statistics, and window extensions. Finally, we demonstrate the value of qFCM to facilitate standardized cross-platform comparisons, irrespective of instrument configuration, settings, and sensitivity in a cross-platform standardization study utilizing a commercially available EV reference material.
Steps
Calculate the stock traceable size calibration reference bead particle concentration using percent solids value and particle density provided by the manufacturer and the following formula, whereis the concentration (particles mL-1),, is the percent solids,is the particle density (g mL-1), andis the average diameter (µm).
Thoroughly vortex the traceable size calibration reference bead stock bottles to homogenize the mixtures before dispensing 1 drop (~50 µL) into separate 500 µL low-protein binding Eppendorf.
Using the working stock from step 2, make up 500 µL solution at 1x10⁷particles mL-1.
On the flow cytometer, set the triggering threshold to the most sensitive light scatter detector and ensure the parameter is using log-scaling (not linear or biexponential).
Running DPBS, lower the triggering threshold until the noise floor of the instrument becomes visible. This is most clearly when using a histogram.
Plotting the trigger-channel height parameter against time and monitoring while running DPBS is a good indication for determining whether an instrument is clean. If the spread of noise (and event rate) decreases over time, it is indicative that the instrument was dirty and is becoming cleaner.
The extent to which the opto-electronic noise of an instrument can be sampled will vary between instruments. Legacy flow cytometers will tolerate a couple of 1000-2000 events/second whilst allowing room to sample desired events, while high-speed jet-in-air sorters are capable of sample 10,000+ events per second.
Triggering using a light scatter parameter on the opto-electronic noise of the instrument has benefits in determining and tracking the lower limit of detection, as well as being informative for buffer + reagent controls where background fluorescence will show clear shifts due to many events being triggered from sampling the noise. The use of this method comes at the cost of having high event rates and therefore larger files. Before utilizing this method the instrument should be validated to determine: 1) its ability to detect and accurately process particles, 2) the event rate at which single small particles are detected, and 3) the degree to which the opto-electronic noise can be sampled without creating artefacts or reducing the ability to detect genuine events.
On some instruments that utilize peristaltic pumps there can appear to be an increase and decrease of the baseline corresponding to the turnover of the pump. This is a result of the threshold being set close to (but above) the electronic noise, resulting in the increase and decrease in trigger events in light scatter. This can be overcome by lowering the threshold so that the noise is being sampled regardless of the peristaltic pump turnover or increasing the threshold and therefore decreasing the instrument’s limit of sensitivity.
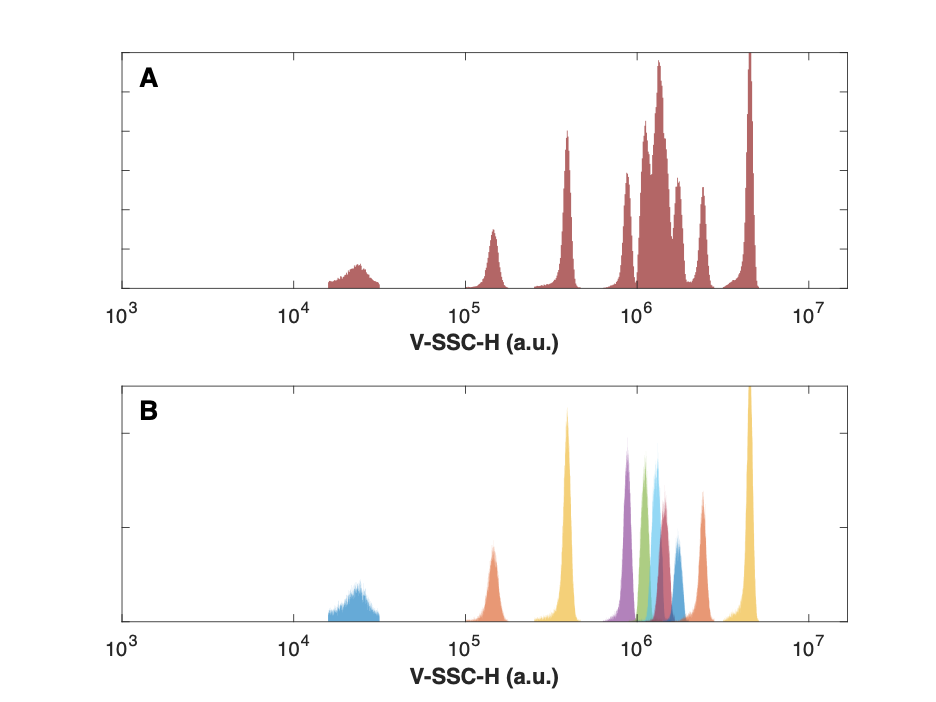
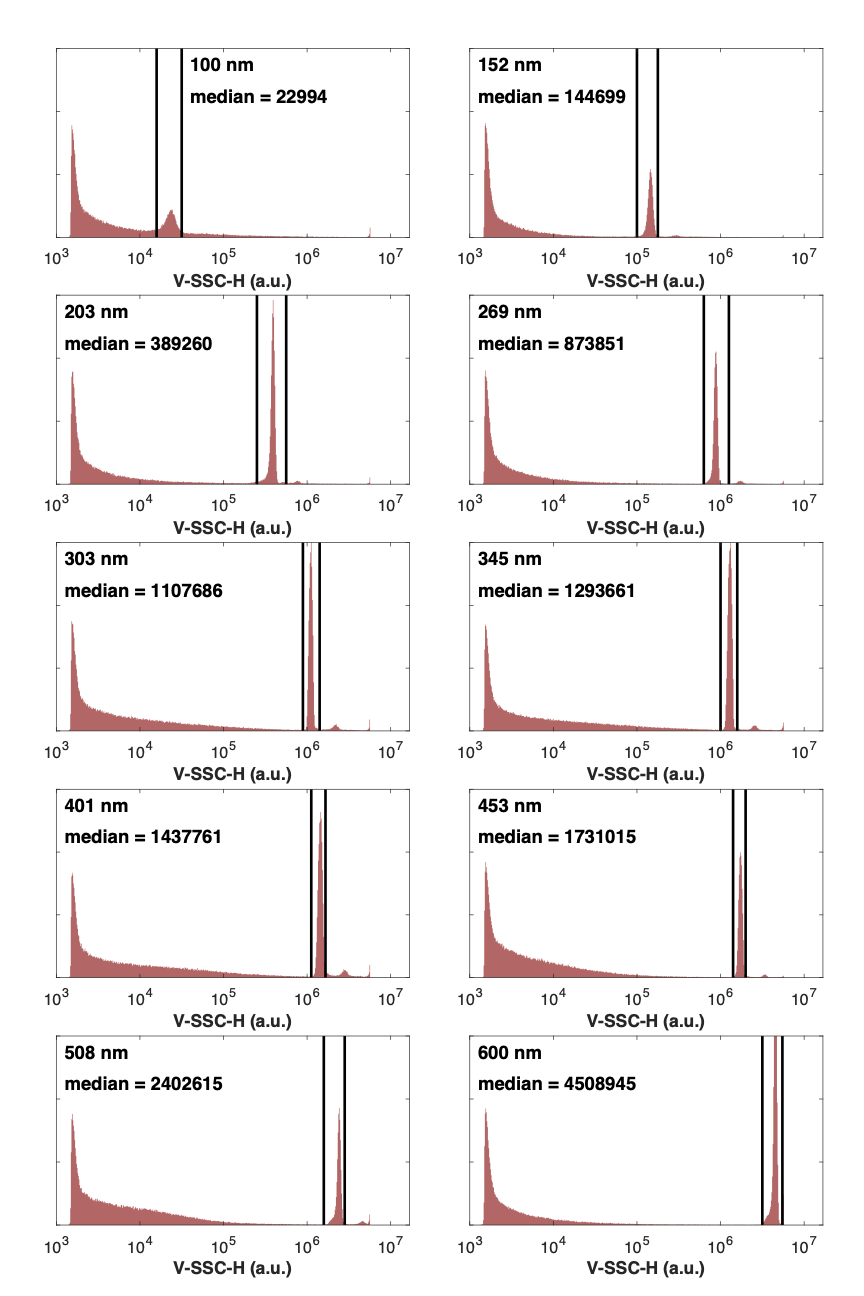
Analyze each bead sample at the same acquisition settings until >5000 bead events are recorded.
It is preferable to analyze and store bead populations individually. This will minimize population overlap, aggregates, background noise, and artifacts.

Gate each bead population using the parameter Height vs. Area in a dot-plot to remove doublets/aggregates and then use a histogram on the light scatter parameter (Height) to obtain statistics for each population. The light scatter parameter should use log scaling.

Obtain the median statistic for each of the bead populations.
By default, flow cytometers trigger the acquisition of an event using the pulse height parameter. In cases where a trigger threshold is being defined (e.g. SSC), it is recommended that the pulse-height is used so that the limit of detection can be defined in calibrated units. There is no consensus within the small particle community over the use of pulse height vs. area. We recommend that, in general, if the parameter being calibrated was not used as a trigger channel the pulse area statistic should be used due to the tendency for low signal intensities to be linear and therefore a more reliable method for extrapolation.

