Proximity Ligation Assay to Detect Transcription-Replication Conflicts in Yeast
Rebecca E Brown, Catherine H Freudenreich
Abstract
Replication and transcription machineries can come into conflict with each other when spatial and temporal separation of these processes are not possible. We present a protocol to examine transcription-replication conflicts in the budding yeast Saccharomyces cerevisiae . We have modified existing proximity ligation assay protocols to detect proximity between RNA polymerase II (transcription machinery) and PCNA (replisome) in yeast. This protocol can be applied to any two proteins or modifications of interest in which you have antibodies suitable for immunofluorescence.

This proximity ligation assay (PLA) protocol was modified from Alberts et al. JOVE 2019 with the following changes:
- Different antibodies targeting RNA polymerase II and PCNA instead of cytosolic chaperone proteins
- Using nocodazole as a negative control (inhibiting replication by arresting cells in M phase)
- Altered wash conditions and slides used
- Added details about imaging and image analysis (using Cell Profiler)
Citation
Alberts N, Mathangasinghe Y, Nillegoda NB 2019 In Situ Monitoring of Transiently Formed Molecular Chaperone Assemblies in Bacteria, Yeast, and Human Cells. Journal of visualized experiments : JoVE https://doi.org/10.3791/60172
Cell Profiler can be used for quantifying foci per nucleus. Pipelines used are included for download and details about image analysis are shown below in the steps of the protocol.
Before start
- Make all solutions before starting the protocol:
Nocodazole:
- Make 1.5 mg/mL nocodazole solution in DMSO. Dilute to 15 µg/mL concentration in yeast rich liquid media.
4% Paraformaldehyde (PFA):
- Dissolve 0.8 g PFA in pre-warmed 17 mL 0.1 M Na2HPO4.
- Add 3 mL of 0.1 M NaH2PO4.
- Final pH at 7.6.
Wash buffer:
- 1.2 M Sorbitol in 100 mM KPO4pH 6.5
Zymolyase solution:
- 0.5 mg/mL Zymolyase 100 T, 1.2 M Sorbitol, 100 mM KPO4pH 6.5, 20 mM 2-Mercaptoethanol.
- Make fresh for each experiment.
Permeabilizing solution:
- 1% TritonX-100 in 100 mM KPO4pH 6.5.
Wash buffer A:
- Make according to Duolink®manufacturer guidelines.
Wash buffer B:
- Make according to Duolink®manufacturer guidelines.
- Prepare humidity chamber (see step 18).
Steps
Preparation of Poly-L-Lysine Coated Slides
Prepare poly-L-lysine coated polytetrafluoroethylene (PTFE) slide to ensure that yeast cells adhere to slide:
NOTE: Slides should be prepared either day of or day before proximity ligation assay protocol is started.
NOTE: Be sure not to touch the wells of the slide for all remaining steps of this protocol. Make sure to label the slides with pencil only.
Gently scrub PTFE slide using toothbrush with soft bristles (i.e. baby toothbrush).
Rinse slide with deionized water and let slide dry completely in hood for 0h 15m 0s.
Place 5µL of 0.1% poly-L-lysine onto each well and let sit for 0h 10m 0s at Room temperature.
Rinse slide with deionized water and let slide dry completely in hood (for at least 1h 0m 0s at Room temperature, overnight is acceptable).
Cell Growth and Collection
NOTE: For all centrifugation steps, make sure to spin at low speeds (<3000rpm,0h 0m 0s is recommended).
Grow cells overnight at 30°C to saturation (use roller drum or shaking incubator) and dilute back to an OD600 ~0.2.
NOTE: Cells can be grown in media of choice. For this protocol, yeast synthetic complete dropout media was used for all experiments except for those treating cells with nocodazole, in which cells were grown in yeast rich media instead.
Grow cells to an OD600 ~1.5.
NOTE: Growth time will vary per strain (typically ~4-10 hrs after diluting back to OD600 ~0.2).
For experiments treating cells with nocodazole, grow cells to OD600 ~1.0. Add nocodazole (15µg/mL final concentration in cultures) and grow cells for 1h 0m 0s before collection.
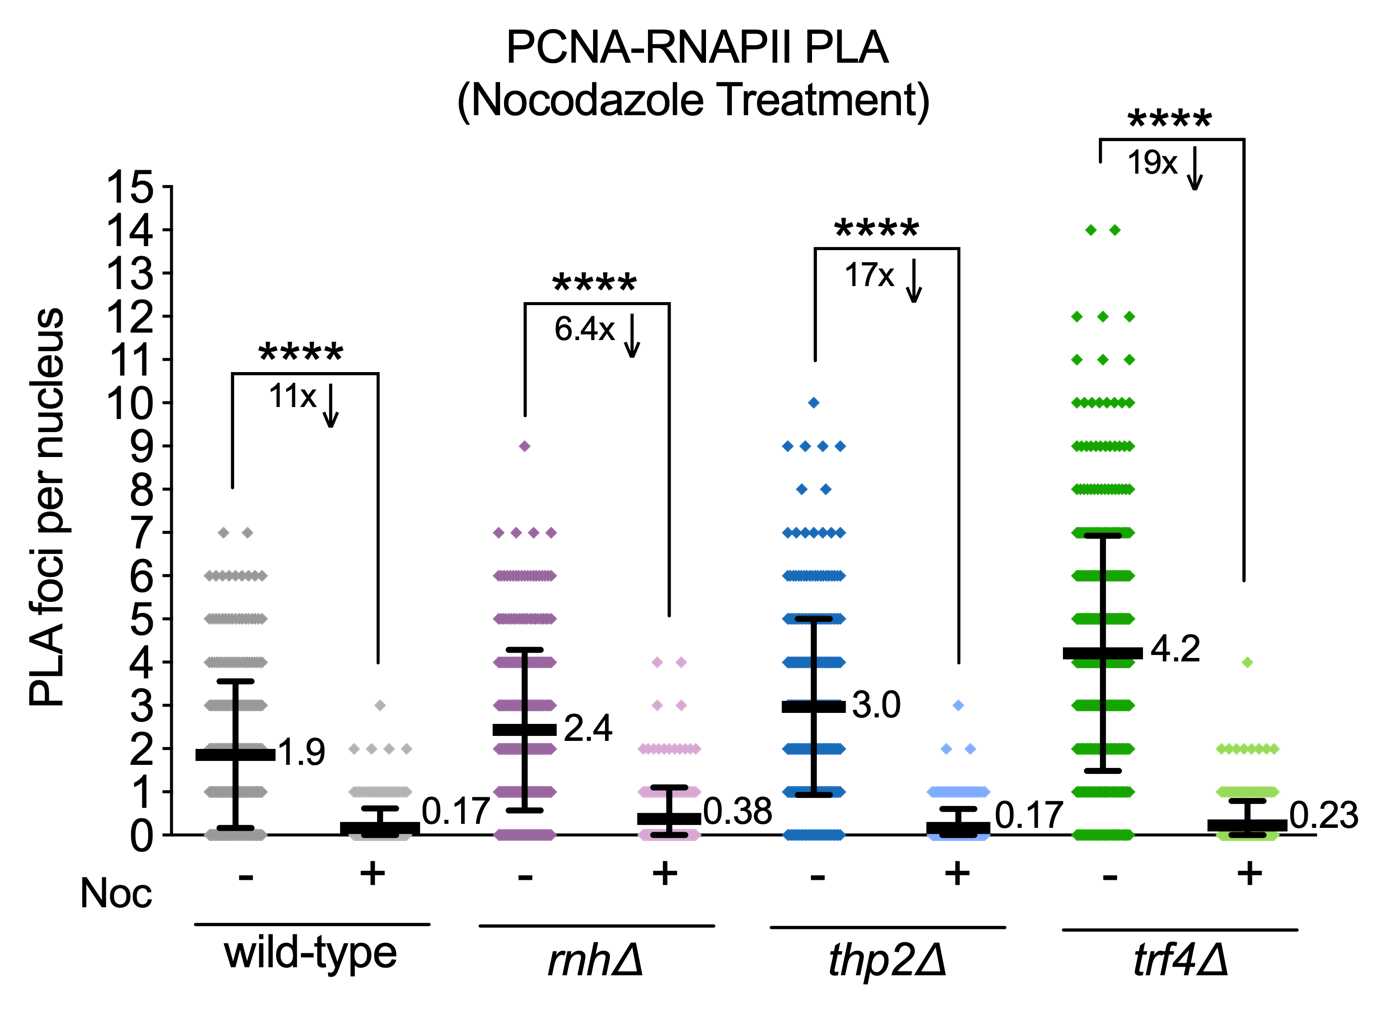
NOTE: An important negative control to include is a sample that does not express one of the targets (in this case PCNA and RNA polymerase II) to ensure that primary antibodies are specific. Since PCNA and RNAPII are essential proteins, replication or transcription must be inhibited as a negative control and should result in reduced PLA foci. Here we chose to inhibit replication by treating cells with nocodazole to arrest cells in M phase.
Collect cells by centrifugation at 3000rpm,0h 0m 0s for 0h 5m 0s. Collect 1 mL of cells per condition (i.e. for each suspension of prepared spheroplasts in sorbitol - see step 15).
NOTE: Volume and OD600 of cells collected may need to be altered to optimize the density of cells upon the slide while imaging.
Cell Fixation
Fix cells with 4% (m/v) paraformaldehyde (PFA) for 0h 15m 0s at room temperature. Use 100µL of 4% (m/v) PFA per 1mL of cells collected. Collect cells by centrifugation at 3000rpm,0h 0m 0s for 0h 5m 0s after incubation in PFA.
Wash cells 3x in with wash buffer (1.2molar (M) sorbitol in 100millimolar (mM) KPO4pH 6.5). Use 100µL of wash buffer per 1mL of cells collected. Pellet cells between washes by centrifugation at 3000rpm,0h 0m 0s for 0h 5m 0s.
Cell Wall Digestion to Prepare Spheroplasts
Cell wall is degraded through enzymatic digestion by Zymolyase:
Digest cell walls with Zymolyase solution (0.5mg/mL Zymolyase 100 T, 1.2molar (M) sorbitol, 100millimolar (mM) KPO4pH 6.5, 20millimolar (mM) 2-Mercaptoethanol) at 30°C for 0h 20m 0s.
NOTE: Treat spheroplasts carefully to prevent disruption of nuclear structure.
Spin down cells at 2000rpm,0h 0m 0s for 0h 5m 0s to remove Zymolyase solution.
Wash cells 3x in with wash buffer (1.2molar (M) sorbitol in 100millimolar (mM) KPO4pH 6.5). Use 100µL of wash buffer per 1mL of cells collected. Pellet cells between washes by centrifugation at 2000rpm,0h 0m 0s for 0h 5m 0s.
Attaching Spheroplasts to Slide
Resuspend spheroplasts in 30µL - 100µL of 1.2M sorbitol. Attach spheroplasts to poly-L-lysine coated slides by pipetting 5µL into each well. Let spheroplasts sit for 0h 30m 0s at Room temperature before aspirating liquid and proceeding with next steps.
NOTE: Altering volume of sorbitol to suspend spheroplasts may need to be altered to optimize the density of cells upon the slide while imaging.
Cell Permeabilization
Wash cells 3x in with wash buffer (1.2molar (M) sorbitol in 100millimolar (mM) KPO4pH 6.5). Use 5µL of wash buffer per well. Let wash buffer sit on well for 0h 5m 0s. Aspirate liquid using a pipette tip connected to a vacuum source after each wash.
NOTE: Make sure not to touch wells when aspirating solution. Touch tip to the edge of the well to aspirate the solution.
Wash attached spheroplasts 3x with permeabilizing solution (1% (v/v) TritonX-100 in 100millimolar (mM) KPO4pH 6.5). Use 5µL of permeabilizing solution per well. Let permeabilizing solution sit on well for 0h 5m 0s. Aspirate liquid using a vacuum source after each wash.
Proximity Ligation Assay (PLA) - Blocking
The steps in the PLA sections below follow the Duolink® PLA Fluorescence Protocol (Duolink PLA Fluorescence Protocol) using reagents from the kit provided by Millipore Sigma (see materials).
NOTE: Before proceeding with steps, prepare a humidity chamber and equilibrate to 37°C.
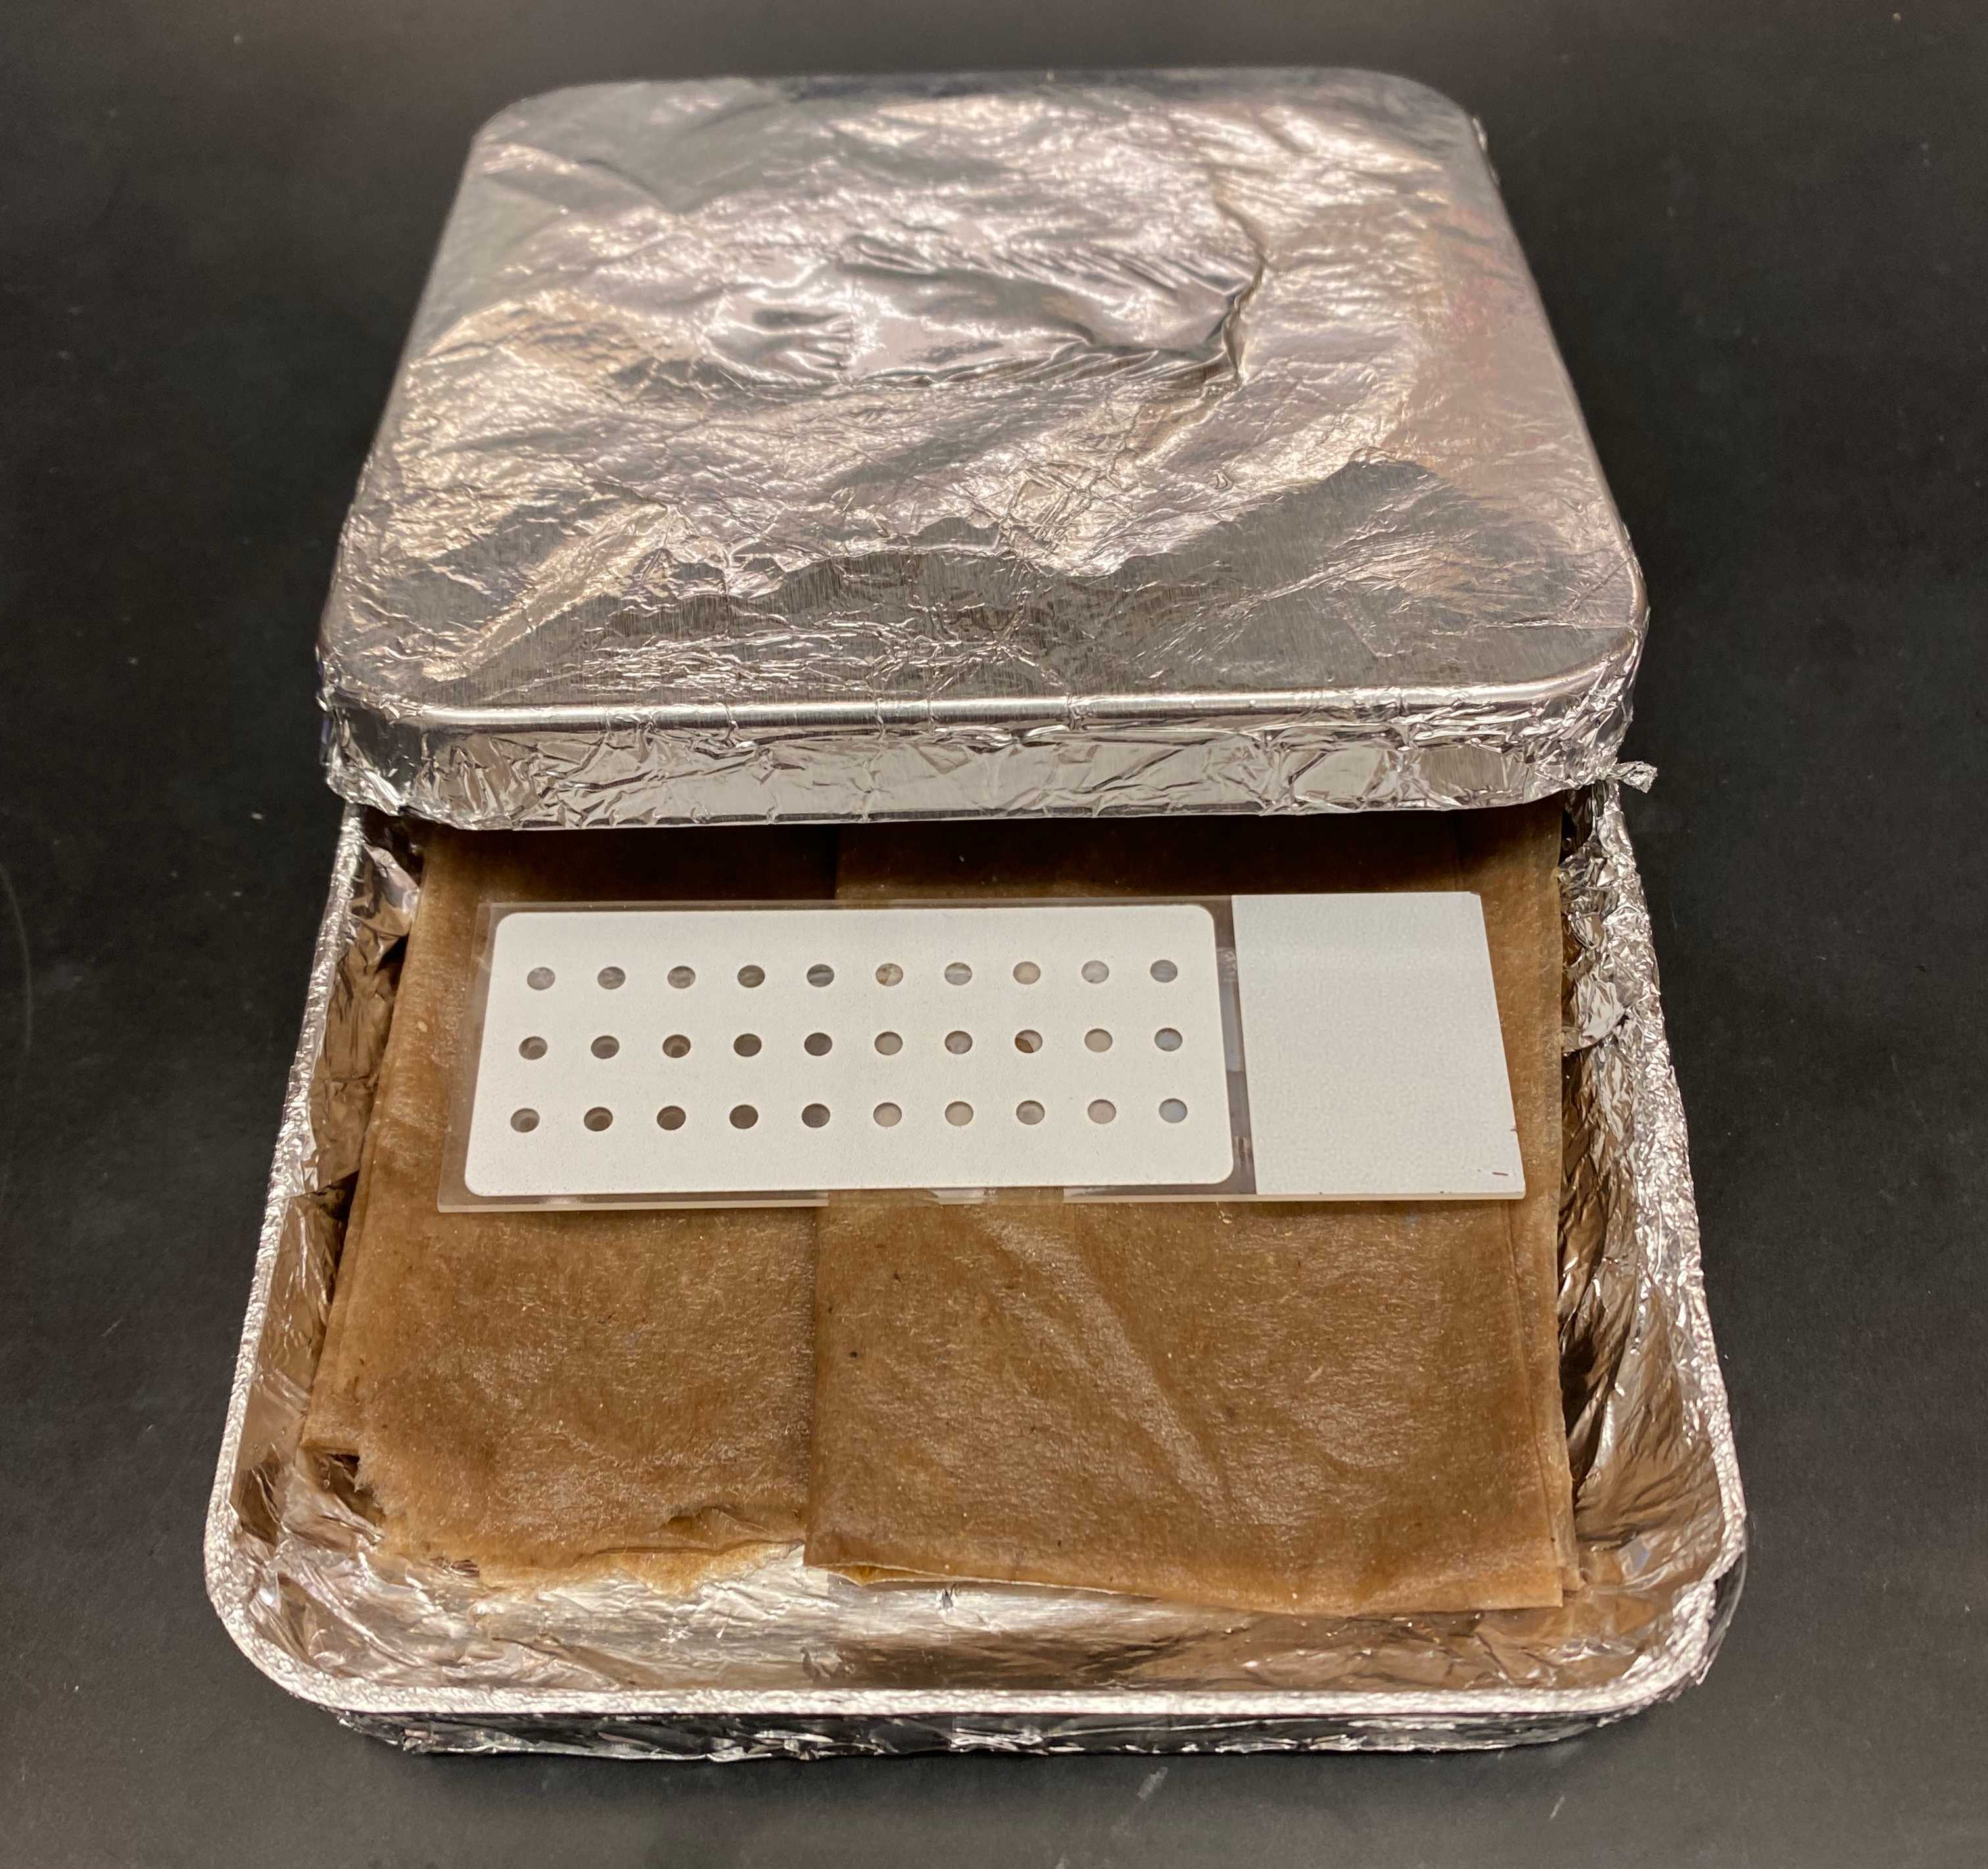
Vortex the Duolink® Blocking Solution.
Add 5µL of Blocking Solution to each sample well (be sure to cover entire sample with Blocking Solution).
Incubate slide in heated humidity chamber for 1h 0m 0s at 37°C.
PLA - Primary Antibody Incubation
Vortex Duolink® Antibody Diluent.
Dilute your primary antibodies to suitable concentration in Duolink®Antibody Diluent. The following antibodies/dilutions were used:
- 1:400 dilution of anti-PCNA [5E6/2] (abcam ab70472)
- 1:400 dilution of anti-RNAPII [p Ser2] (Novus Biologicals NB100-1805)
NOTE: Antibody dilutions may need to be optimized if using different antibodies or for different strains/growth conditions.
Aspirate Duolink® Blocking Solution from slide wells.
NOTE: Make sure not to touch wells when aspirating solution. Touch tip to the edge of the well to aspirate the solution.
Add diluted primary antibody solution to each well as stated below:
- Experimental condition: create mix of the two primary antibody dilutions (
2.5µLof each antibody dilution per well). Add5µLof mixed primary antibodies to each well, making sure to cover the entire sample. - Single antibody controls: Add
5µLof individual primary antibody to each well, making sure to cover the entire sample.
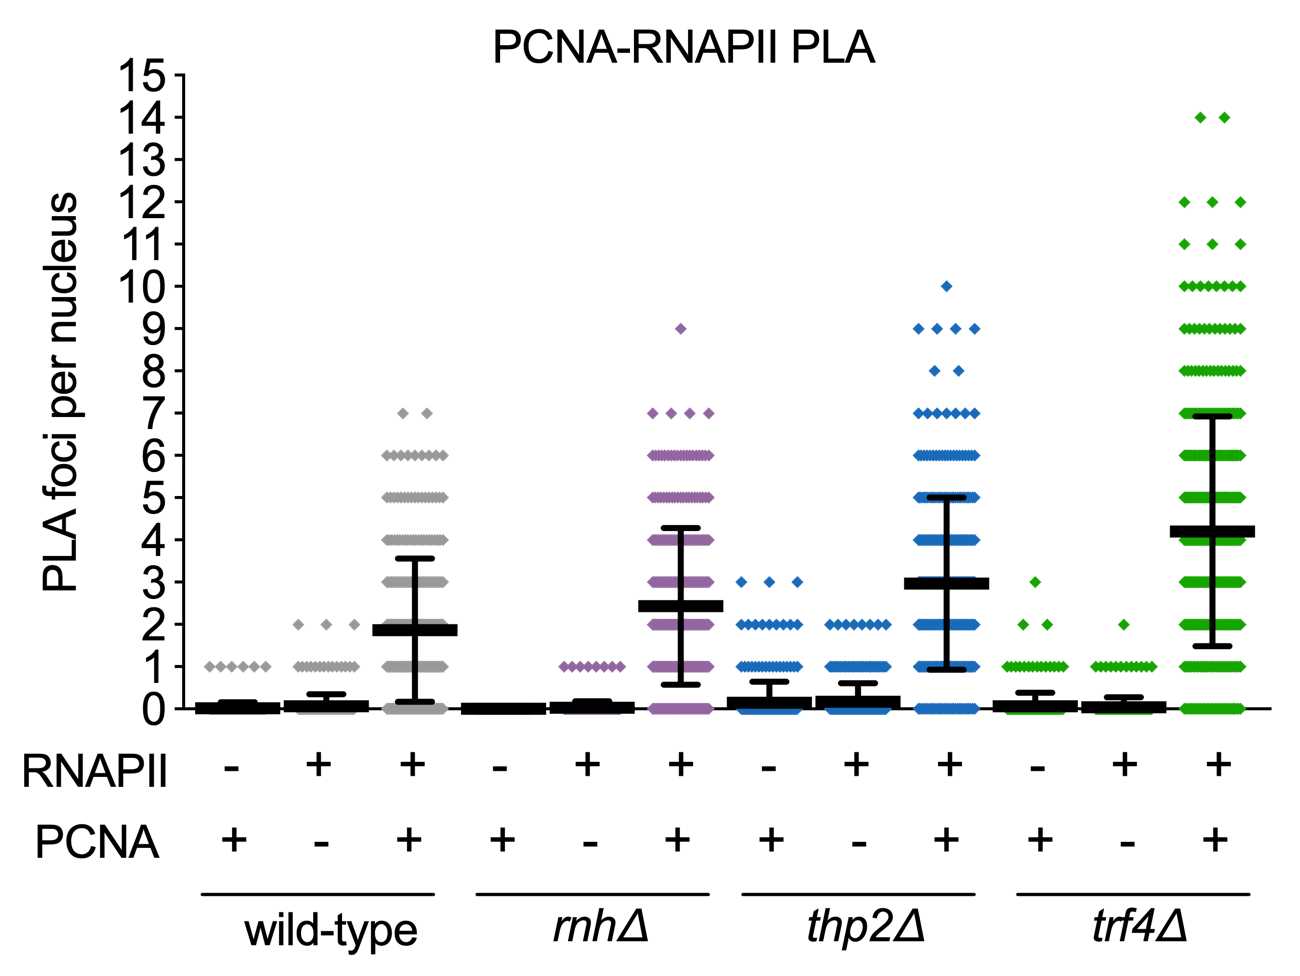
NOTE: An important control to include with each PLA experiment is single antibody controls. Adding only one antibody to the reaction should eliminate or at least drastically decrease the amount of PLA foci detected.
Incubate slides in a humidity chamber at 4°C overnight.
NOTE: Optimal incubation temperature/time for primary antibodies chosen will need to be determined.
PLA - PLA Probe Incubation
NOTE: Heat up humidity chamber to 37°C before proceeding with these steps.
While chamber is heating up: Vortex PLUS and MINUS PLA probes and Duolink®Antibody Diluent.
Make PLA probe solution: Dilute the PLUS/MINUS PLA probes 1:5 in Duolink® Antibody Diluent.
- For each 5 µL reaction: add
1µLof each probe and3µLof Duolink® Antibody Diluent.
Aspirate primary antibody solution from slide wells.
NOTE: Make sure not to touch wells when aspirating solution. Touch tip to the edge of the well to aspirate the solution.
Wash slide wells 2x for 0h 5m 0s in 1x Wash Buffer A at Room temperature. Let wash buffer sit on slide and aspirate solution between each wash.
Aspirate excess Wash Buffer A from slide wells.
Apply 5µL of PLA probe solution to each slide well, making sure to cover the entire sample.
Incubate slides in pre-heated humidity chamber for 1h 0m 0s at 37°C.
PLA - Ligation
NOTE: Wait to add Ligase to solution until immediately prior to addition to sample. Make sure ligation buffer is completely thawed/mixed prior to use. Ligation buffer can be aliquoted to prevent multiple freeze/thaw cycles.
Make 1X ligation buffer solution: Dilute the 5X Duolink®Ligation buffer 1:5 in molecular biology grade water.
- For each 5 µL reaction: add
1µLof 5X Duolink®Ligation buffer and4µLof molecular biology grade water.
Aspirate PLA probe solution from each slide well.
NOTE: Make sure not to touch wells when aspirating solution. Touch tip to the edge of the well to aspirate the solution.
Wash slide wells 2x for 0h 5m 0s in 1x Wash Buffer A at Room temperature. Let wash buffer sit on slide and aspirate solution between each wash.
Make Ligase solution: During the wash steps retrieve Ligase from freezer using freezer block. Add Ligase to 1x ligation buffer at a 1:40 dilution.
- For each 5 µL reaction: add
0.125µLof Ligase and4.875µLof 1x ligation buffer.
Aspirate excess Wash Buffer A from slide wells.
Apply 5µL of Ligase solution to each slide well, making sure to cover the entire sample.
Incubate slides in pre-heated humidity chamber for 0h 30m 0s at 37°C.
PLA - Amplification
NOTE: Wait to add Polymerase until immediately prior to addition to sample. Amplification buffer is light-sensitive (protect all solutions containing buffer from light).
Make 1X amplification buffer solution: Dilute the 5X Duolink®Amplification buffer 1:5 in molecular biology grade water.
- For each 5 µL reaction: add
1µLof 5X Duolink®Amplification buffer and4µLof molecular biology grade water.
Aspirate Ligase solution from each slide well.
NOTE: Make sure not to touch wells when aspirating solution. Touch tip to the edge of the well to aspirate the solution.
Wash slide wells 2x for 0h 2m 0s in 1x Wash Buffer A at Room temperature. Let wash buffer sit on slide and aspirate solution between each wash.
Make Amplification solution: During the wash steps retrieve Polymerase from freezer using freezer block. Add Polymerase to 1x amplification buffer at a 1:80 dilution.
- For each 5 µL reaction: add
0.0625µLof Ligase and4.9375µLof 1x amplification buffer.
Aspirate excess Wash Buffer A from slide wells.
Apply 5µL of Amplification solution to each slide well, making sure to cover the entire sample.
Incubate slides in pre-heated humidity chamber for 1h 40m 0s at 37°C.
PLA - Final Slide Preparation
NOTE: Light sensitive reagents - keep slides protected from light at all times.
Aspirate Amplification solution from slide wells.
NOTE: Make sure not to touch wells when aspirating solution. Touch tip to the edge of the well to aspirate the solution.
Wash slide wells 2x for 0h 10m 0s in 1x Wash Buffer B at Room temperature. Let wash buffer sit on slide and aspirate solution between each wash.
Wash slides once in 0.01x Wash Buffer B for 0h 1m 0s.
Aspirate excess Wash Buffer B from slide wells.
Mount the slides with a coverslip using a minimal volume of Duolink® PLA Mounting Medium with DAPI. Make sure to leave space on slide around coverslip to allow for sealing with nail polish. Seal edges of coverslip to slide with clear nail polish.
Wait at least 0h 15m 0s and up to 2 days before imaging samples using a fluorescence or confocal microscope. For storage of 1-2 days, keep slide in the dark at 4°C. Slide can be stored longer term at -20°C.
PLA - Imaging
Image samples using an oiled 100x objective. See below for details imaging on a Leica Dmi8 Thunder or DeltaVision Ultra widefield fluorescence microscope with Duolink®In Situ Red Detection Reagents:
Using Leica Dmi8 Thunder:
For imaging:
- Use 575nm excitation for PLA foci
- Use 395nm excitation for DAPI
For deconvolution:
- Small Volume Computational Clearing (Under Thunder/Lightning in Process tab)
- Adaptive strategy
- Refractive Index/Mounting Medium - 1.461/custom
Using DeltaVision Ultra:
For imaging:
- Use Red channel for PLA foci
- Use Blue channel for DAPI
- Used 1.5180 Laser Liquid Oil for use with objective requiring oil
For deconvolution:
- Add deconvolution to processing
Image Analysis
Quantification of foci per nucleus can be done by manual counting, using Cell Profiler, or other available software. Below is analysis done with Cell Profiler:
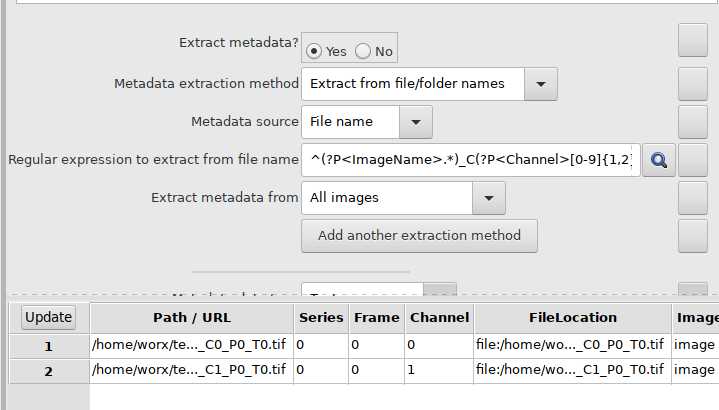
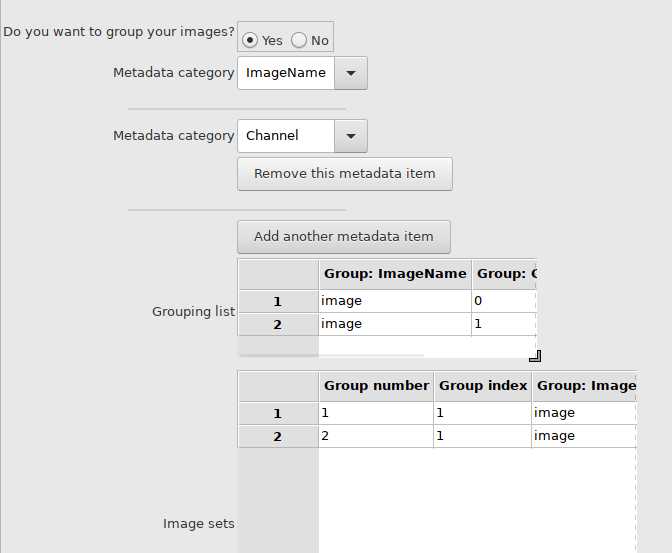
Three dimensional images need to be split into separate channels, positions, and timepoints using the following code:
bfconvert imagename.file_ending imagename_C%c_P%s_T%t.tif
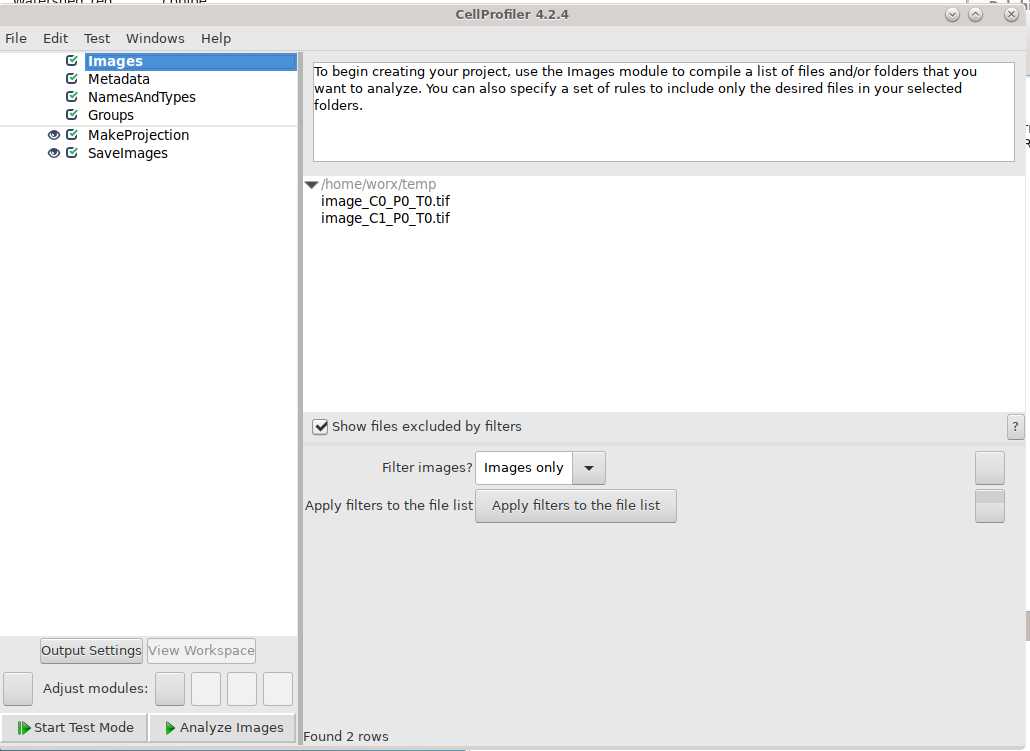
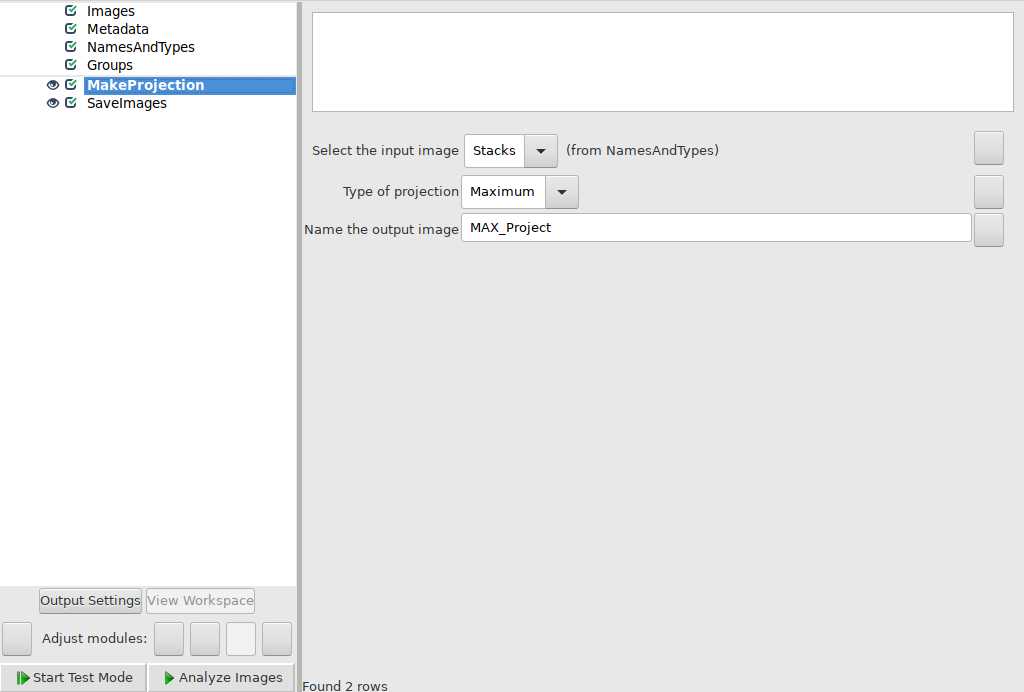
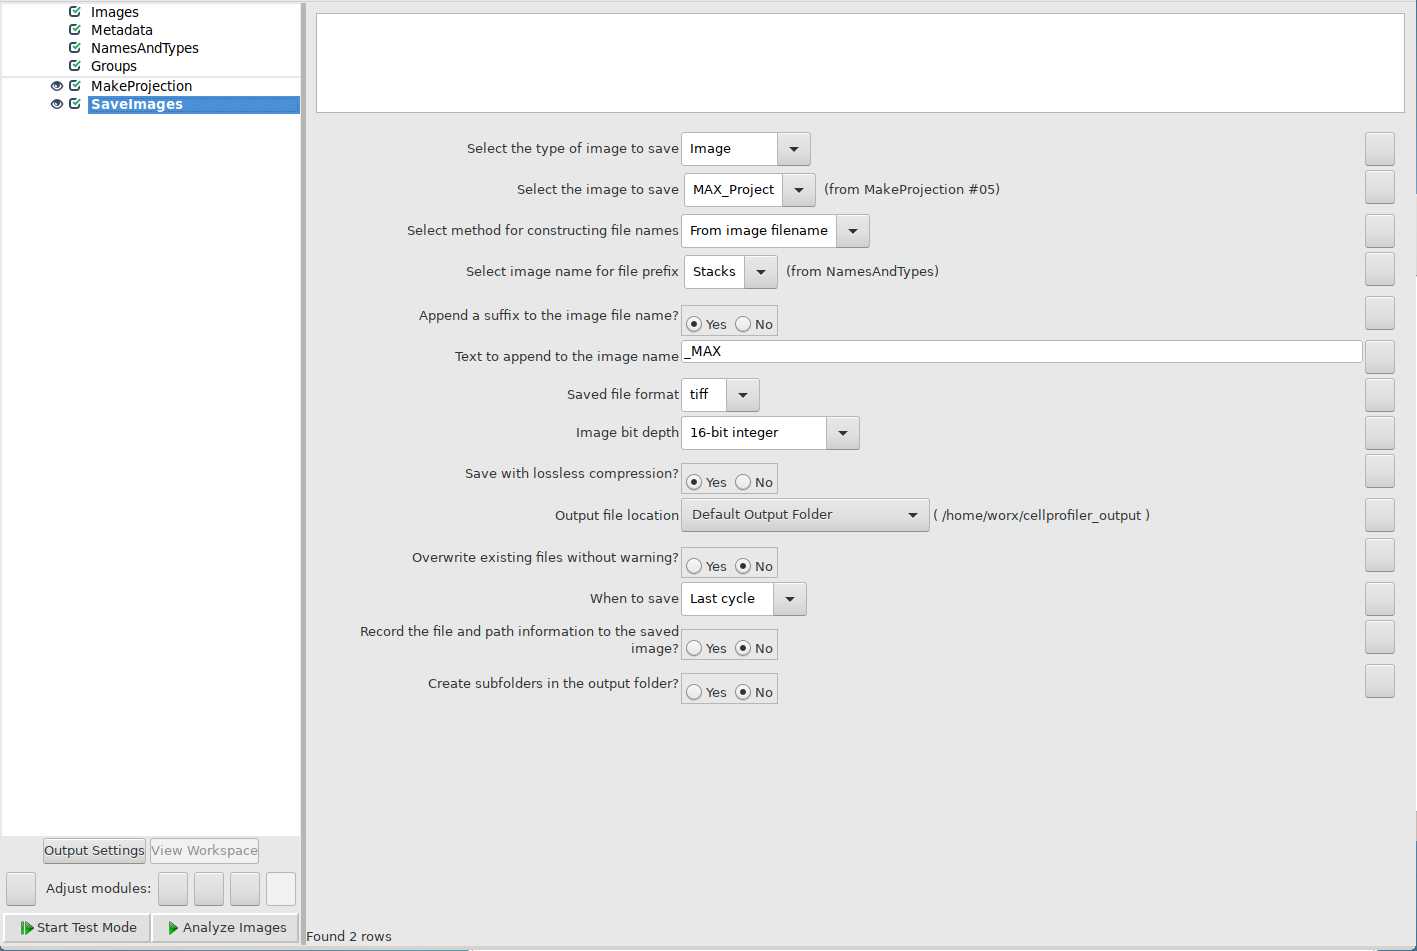
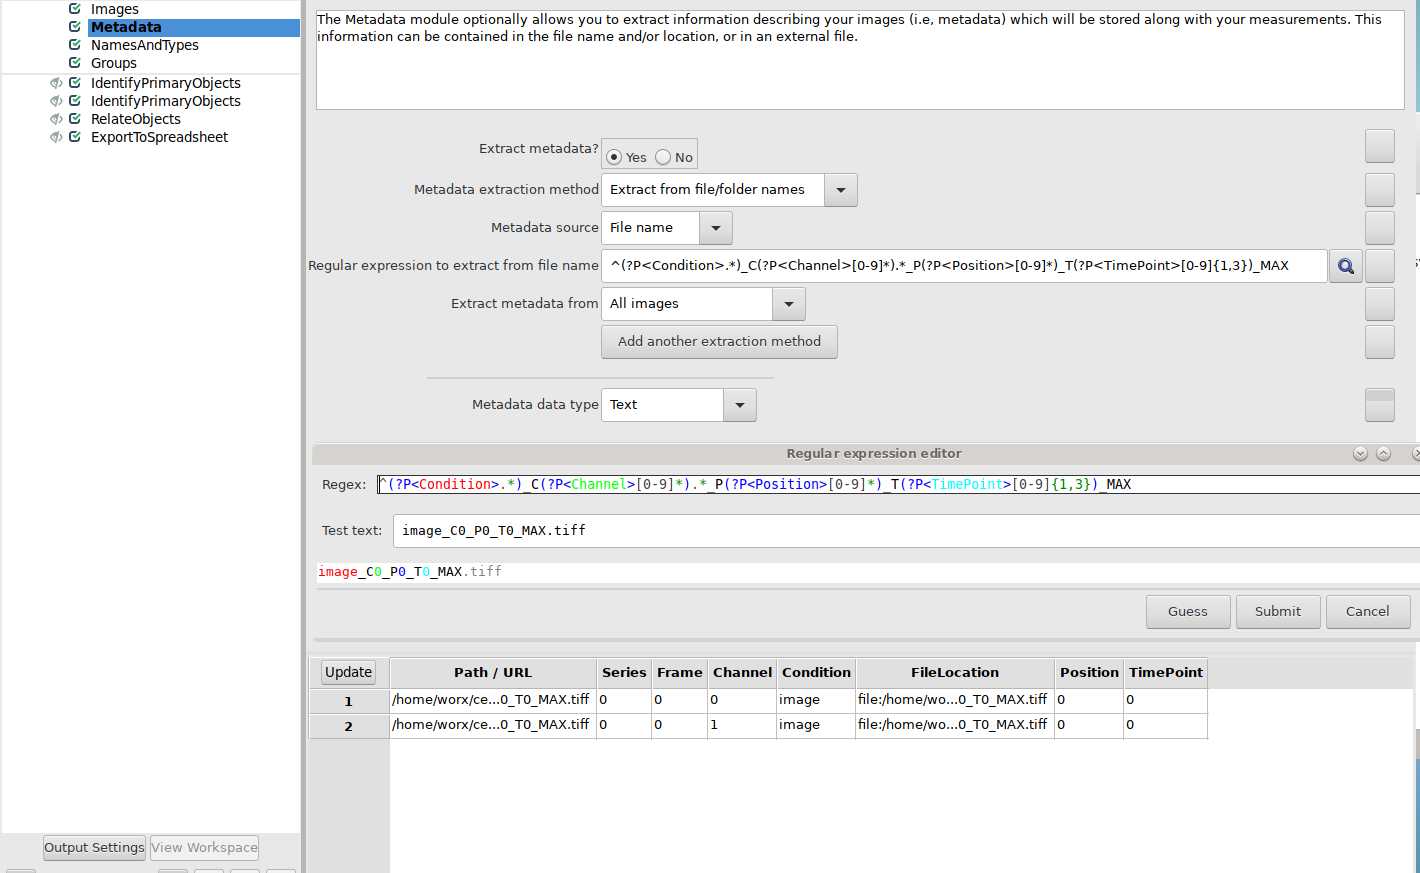
Use Cell Profiler to create maximum intensity projections of images. Pipeline used is linked here and can be downloaded/modified for future use.
See directions and example screenshots below:
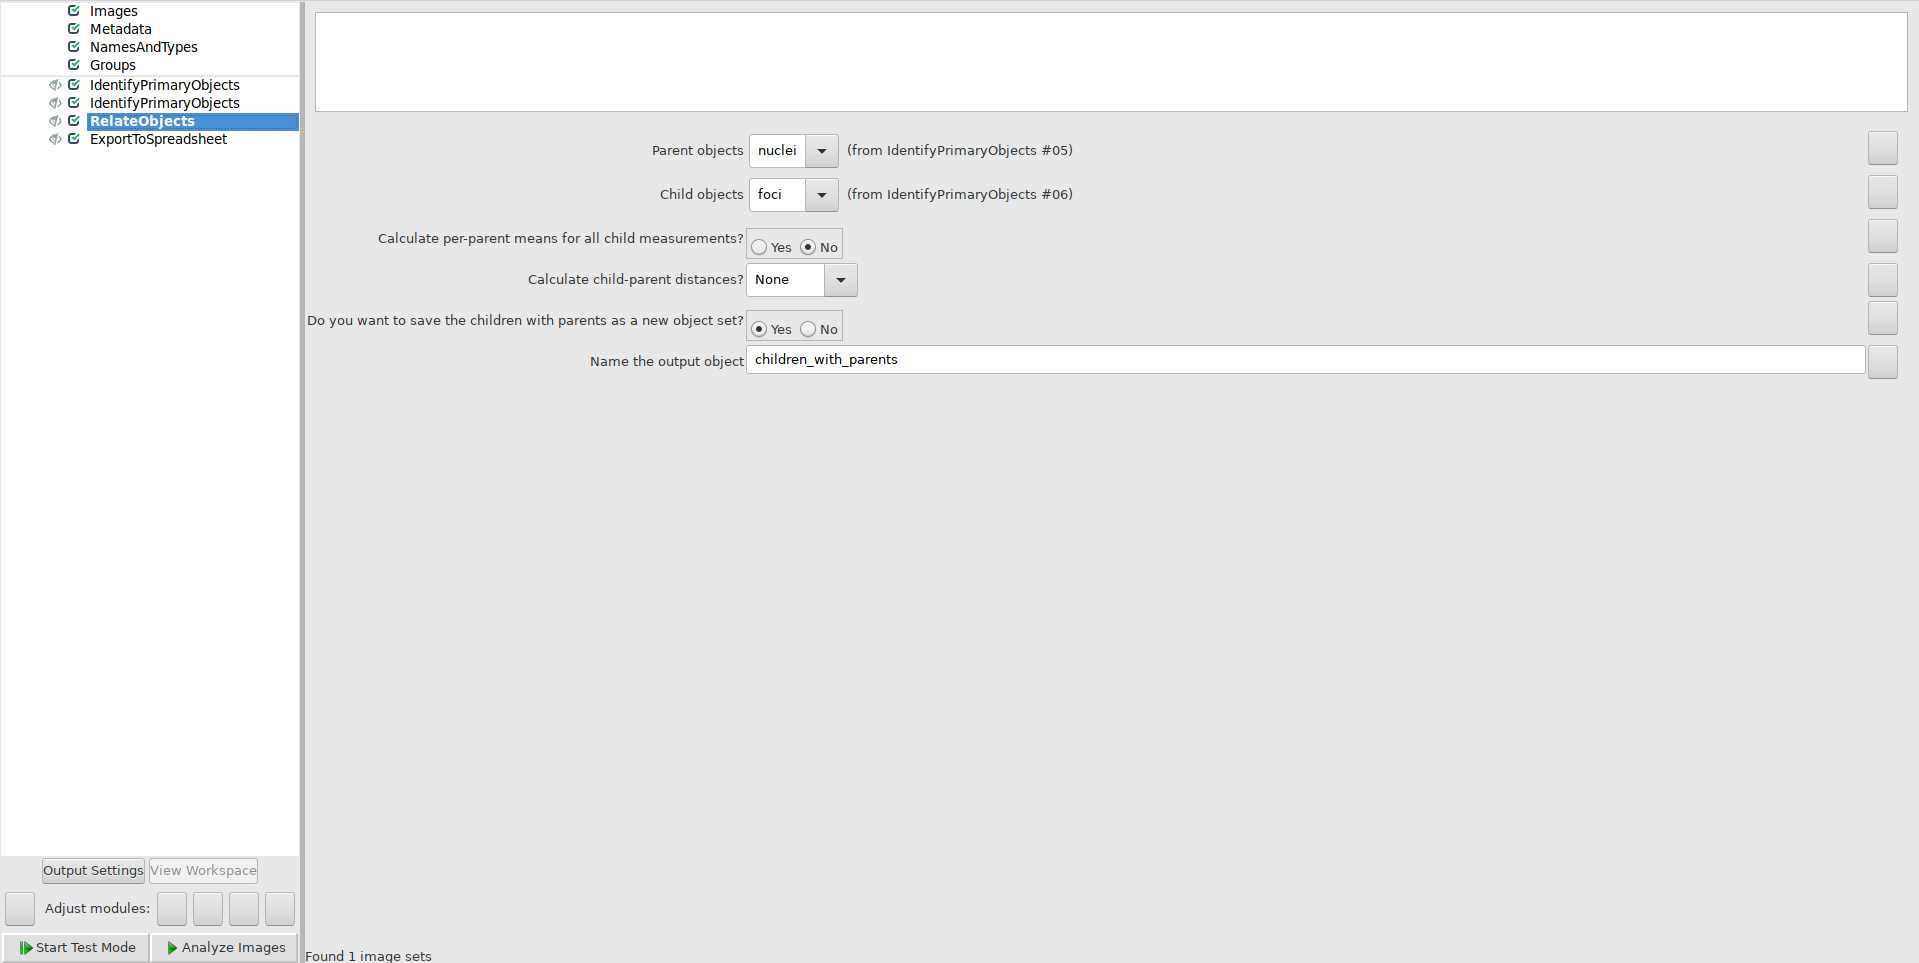
Use Cell Profiler to quantify foci per nucleus. Pipeline used is linked here and can be downloaded/modified for future use.
See directions and example screenshots below:
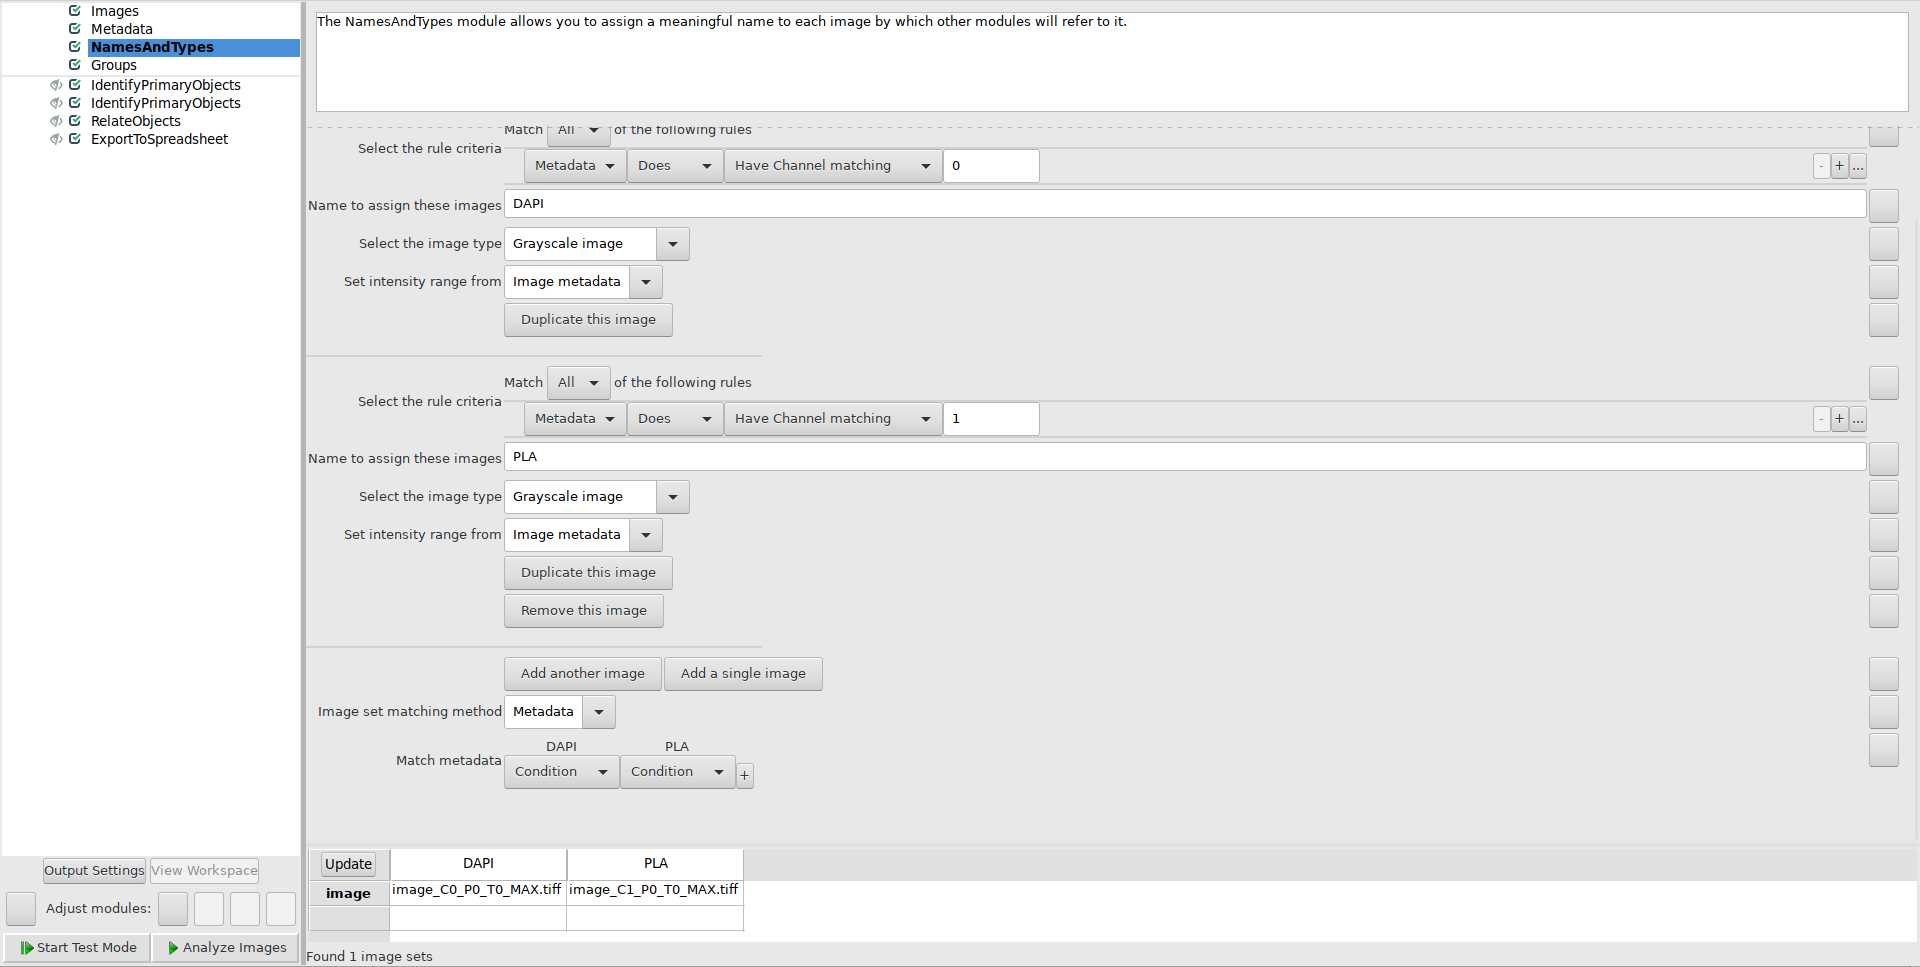
Use NamesAndTypes module to assign names to image files:
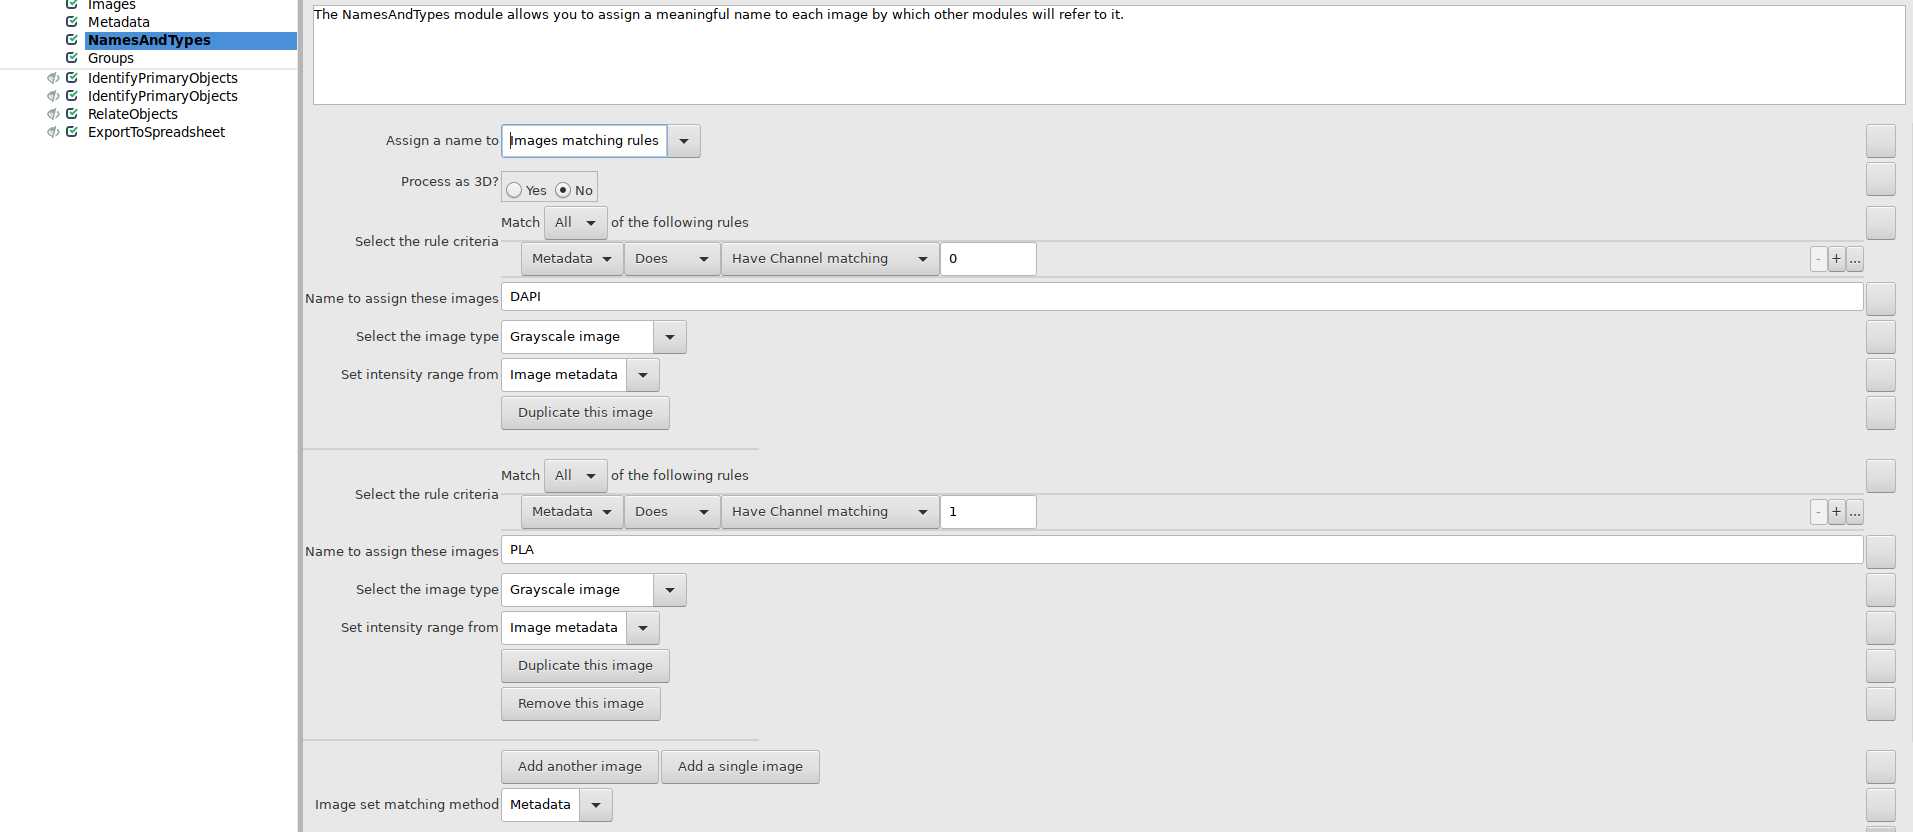
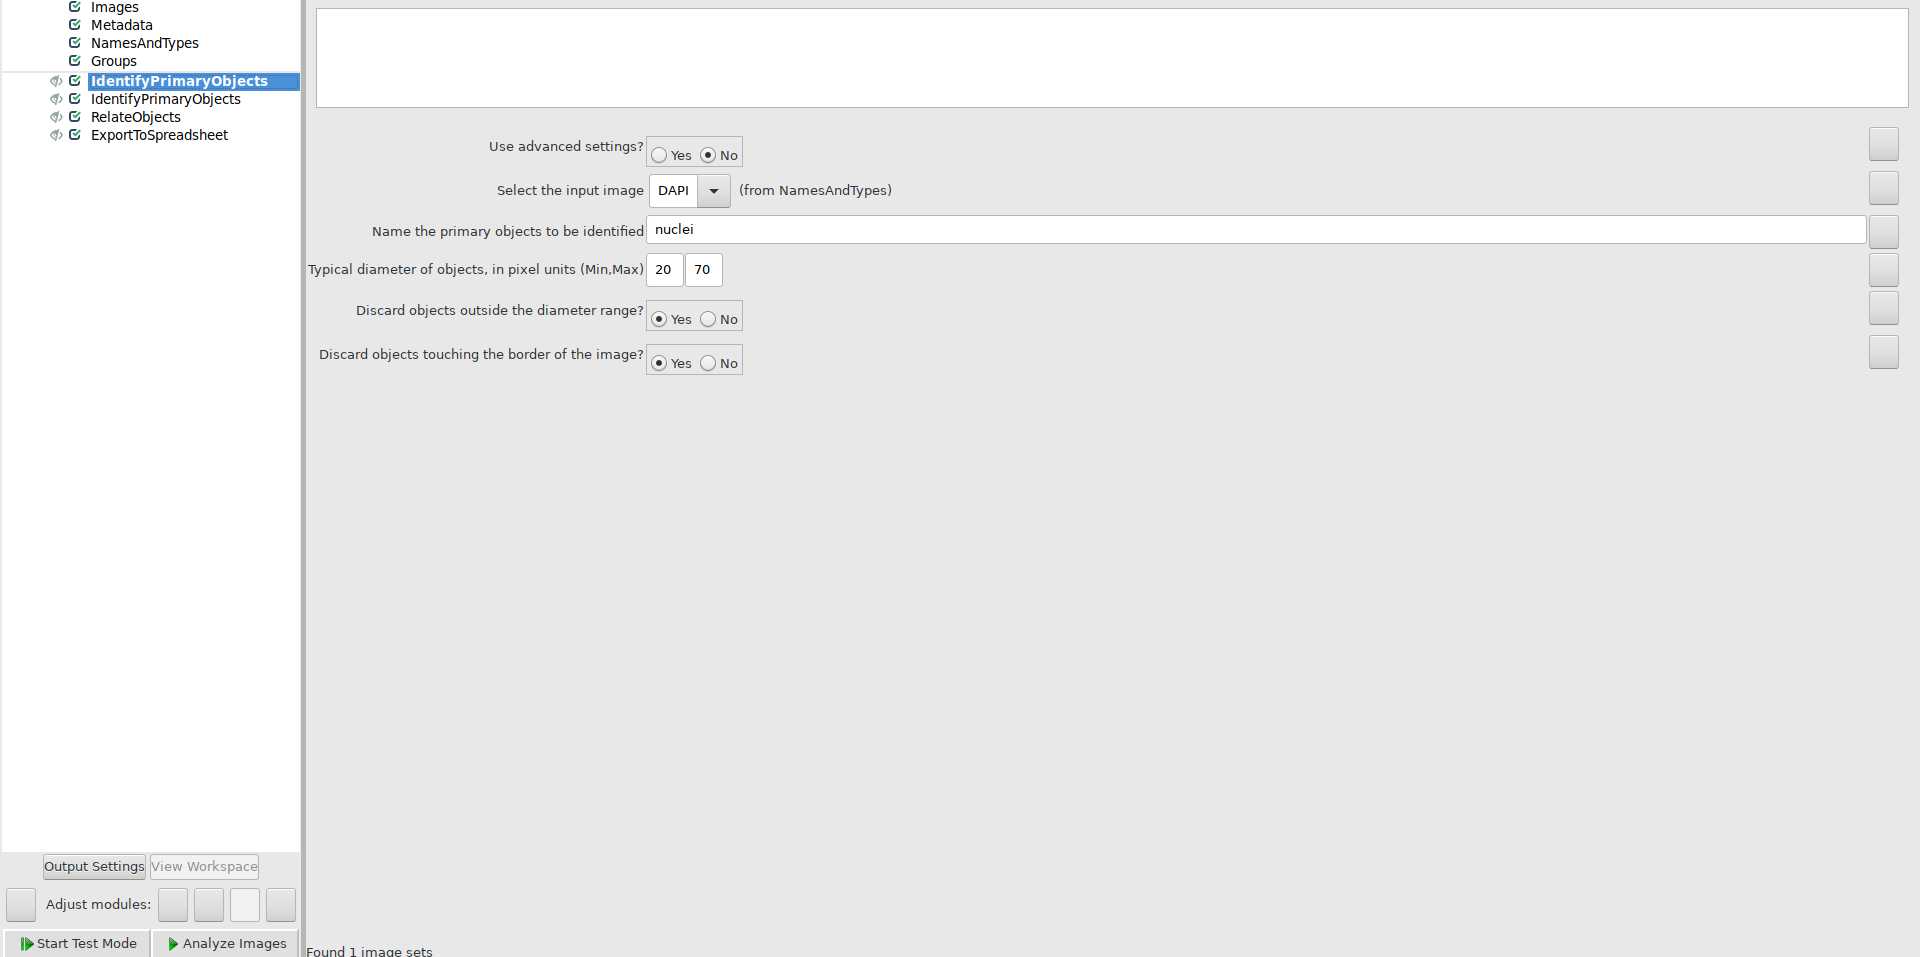
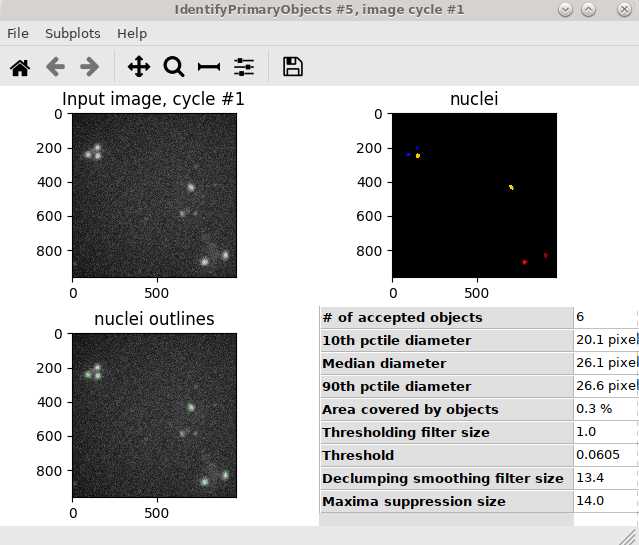
Use IdentifyPrimaryObjects module to identify nuclei:
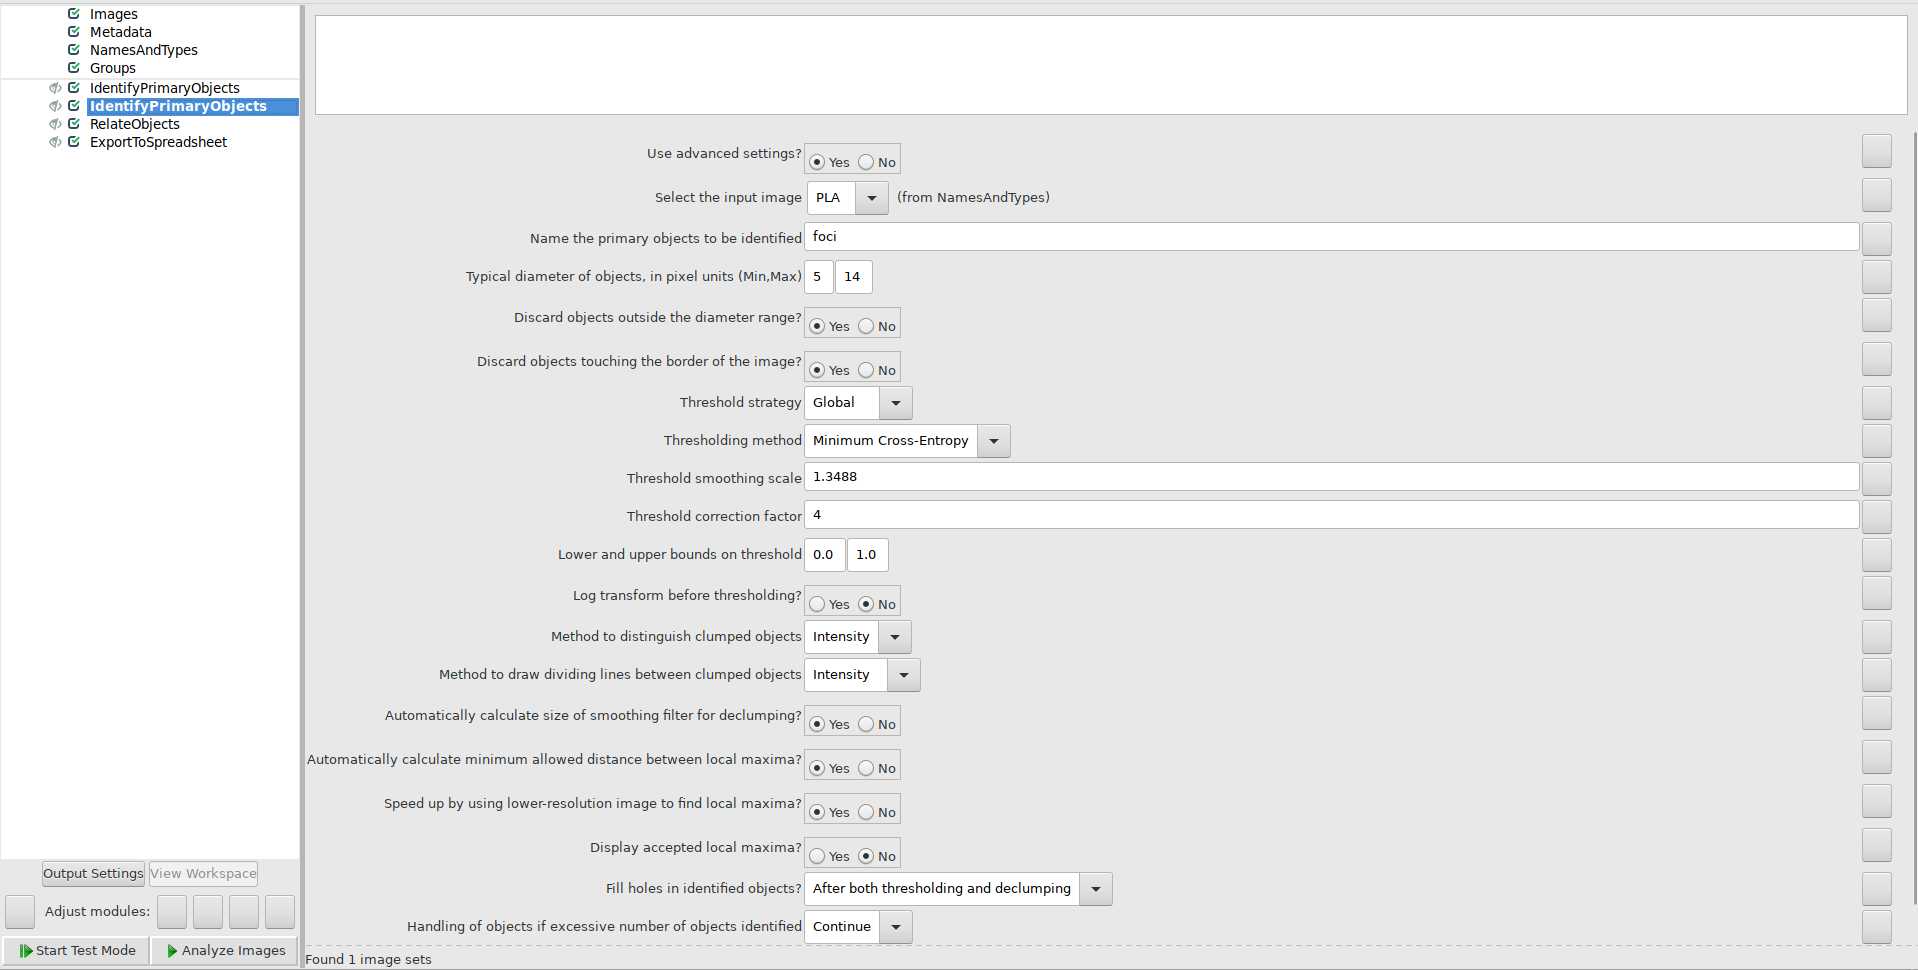
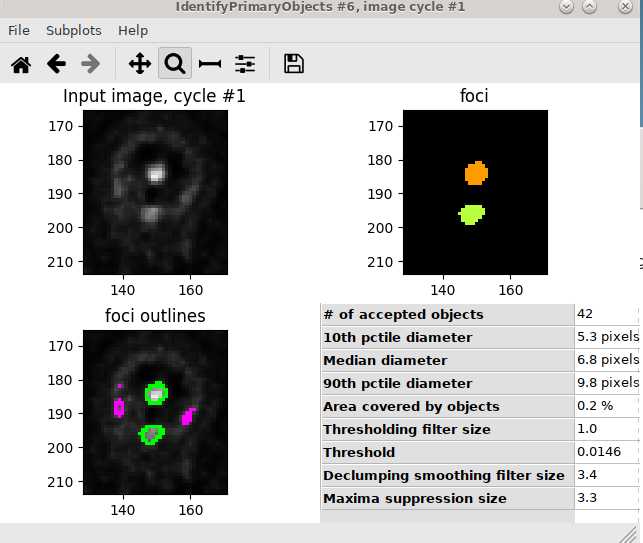
Use IdentifyPrimaryObjects module to identify foci:
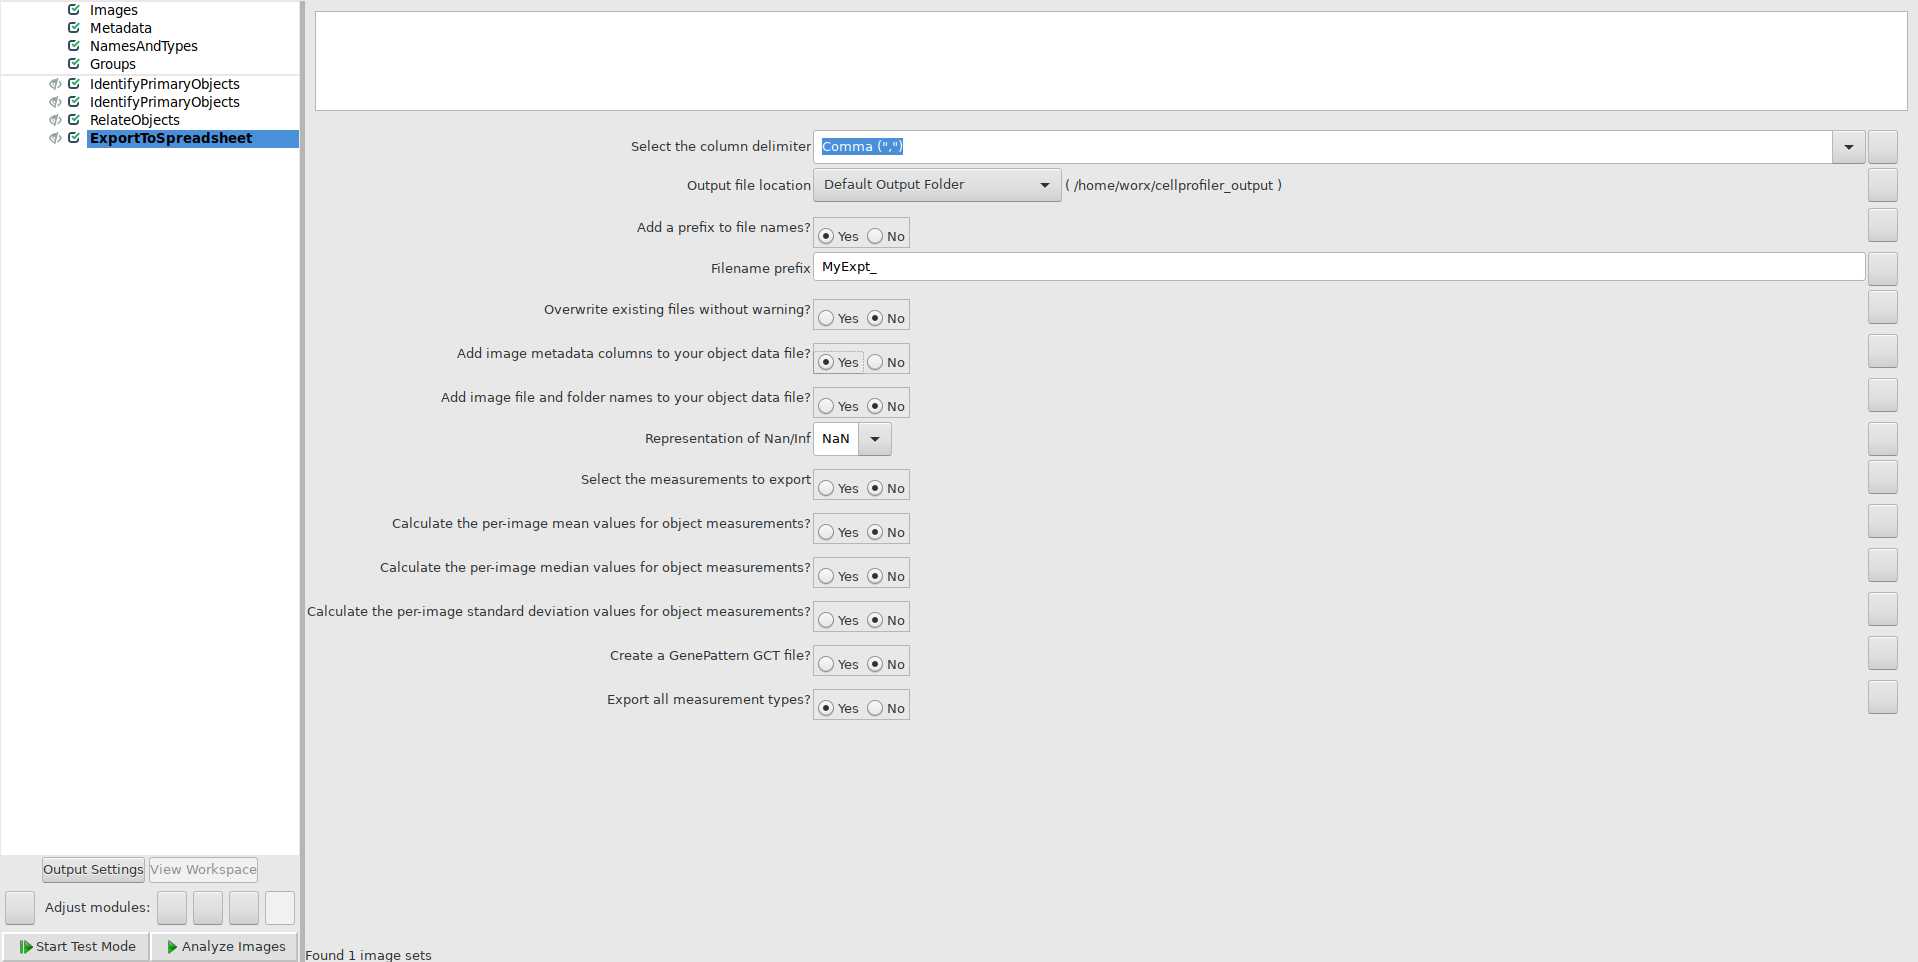
Use ExportToSpreadsheet module to export quantification of foci per nucleus:
<img src="https://static.yanyin.tech/literature_test/protocol_io_true/protocols.io.kxygx93rzg8j/Spreadsheet%20with%20Data.png" alt="Figure 19. Example of data exported from Cell Profiler. Foci within each nucleus is output in "Children_foci_Count" in column K. The file highlighted in CellProfiler_output window is file that contains desired data. " loading="lazy" title="Figure 19. Example of data exported from Cell Profiler. Foci within each nucleus is output in "Children_foci_Count" in column K. The file highlighted in CellProfiler_output window is file that contains desired data. "/>
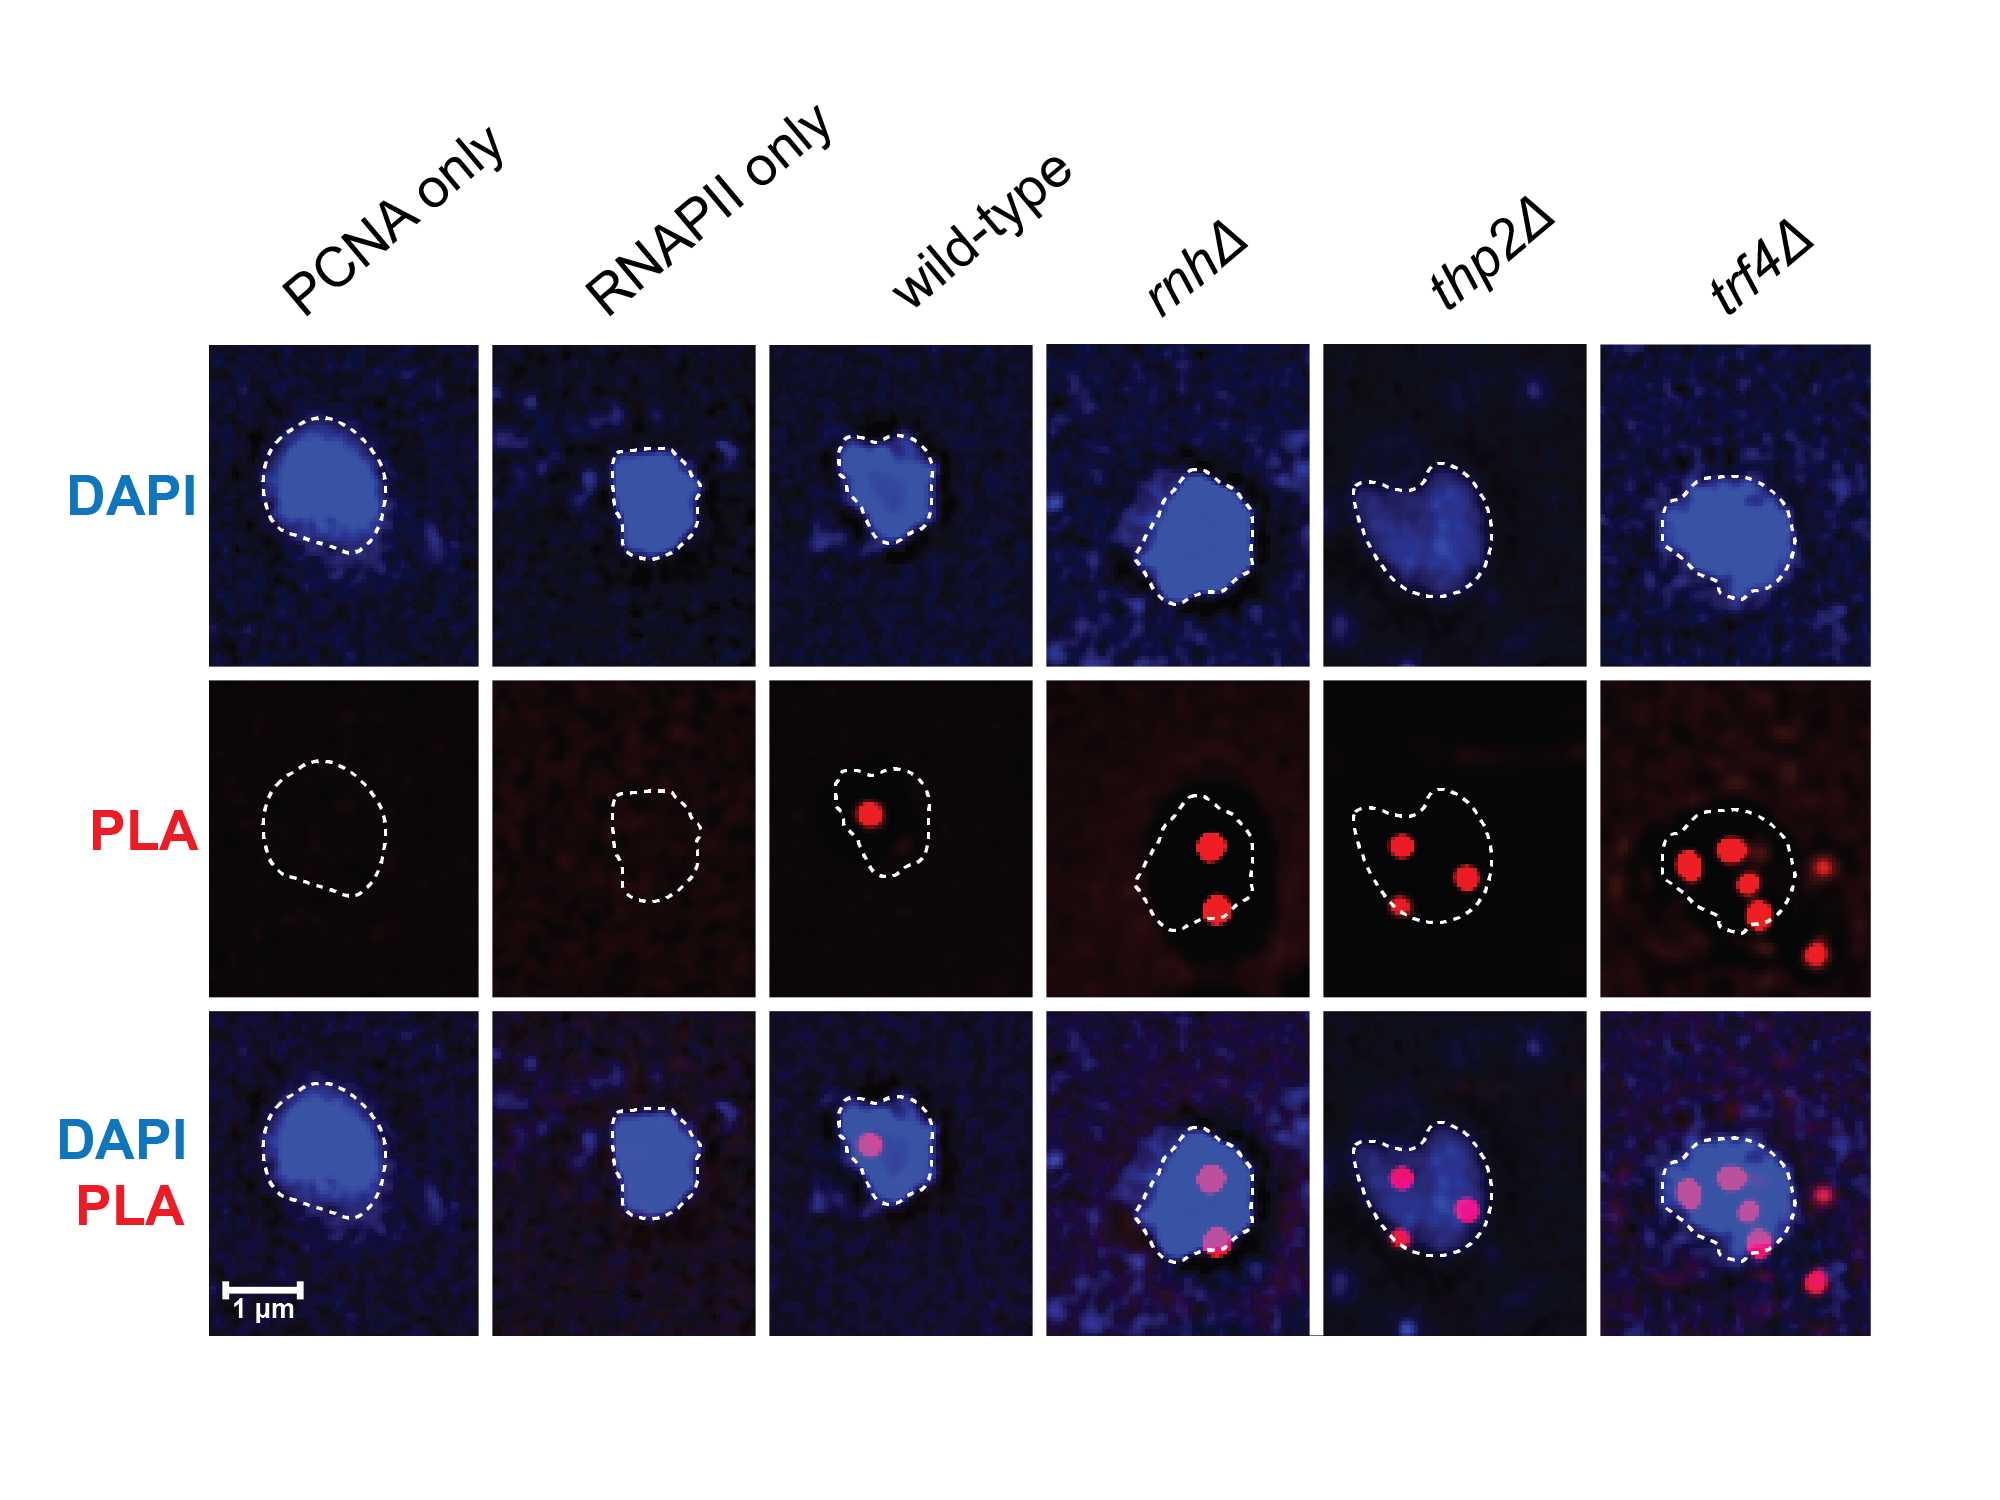
Example of Data
Data shown is from Brown et al. PLOS Biology 2022.
