Optimization of ROS measurement and localization in plant tissues: challenges and solutions
taras.p.pasternak, Jose Manuel Perez-Perez
Abstract
During the last decade, there has been a huge interest in understanding the role of reactive oxygen species (ROS) in plant signalling transduction pathways. This understanding requires precise quantification of ROS levels in each cell and each cellular compartment. However, the current methods of ROS detection and measuring are limited. This paper revisits the existing ROS detection methods and discuss general guidelines for applying them to specific cases. Introduction All plants require molecular oxygen for survival (Mittler, 2017). ROS formation naturally occurred during electron transport through all membranes which, in turn, regulate DNA repair systems, cell cycle, phytohormone-dependent signalling and pathogen integration (Huang et al., 2019). In the non-photosynthetic plant tissue, the mitochondrial electron transport system of oxidative phosphorylation is the major site for ROS generation (Dourmap et al., 2020). While in photosynthetic tissue, electron transport between stroma and thylakoid is the primary ROS source (Asada, 2006). On plasma membranes and on endoplasmic reticulum membranes, ROS is mainly produced via NADPH oxidases (Foreman et al., 2003).Cell wall peroxidases are another source of apoplastic ROS (Torres, 2010). In addition, peroxisomes can be considered as the major site of intracellular hydrogen peroxide (H2O2) production (Sandalio et al., 2021).Major ROS produced by cellular processes are superoxide (O2-), H2O2, and hydroxyl radical ( ∙ OH). Superoxide is rapidly converted to H2O2 by superoxide dismutase enzymes (SODs; Cu/Zn-SOD in chloroplasts and cytoplasm, Fe-SOD and Mn-SOD in mitochondria). Hydroxyl radicals are thus generated in the cell wall, plasma membrane, and intracellularly by a range of peroxidases, superoxide dismutases, NADPH oxidases, and transition metal catalysts (Richards et al., 2015). Because of the cellular and biochemical damage caused by oxidative stress (Huang et al., 2019), ROS levels should be precisely controlled in each subcellular compartment and each cell type. ROS are highly reactive molecules rapidly subjected to scavenging or degradation, in processes that are highly sensitive to any environmental change, therefore making ROS extremely unstable and difficult to directly detect. Transferring of the plants to buffers with non-physiological pH can be considered as an abiotic stress factor and it eventually might change endogenous ROS levels (Choudhury et al., 2017). However, many established protocols for ROS measurement (Dunand et al., 2007, Jambunathan, 2010, Rodríguez & Taleisnik, 2012) included the soaking of plant tissues on non-physiological buffers, which might alter steady-state ROS levels. Several methods have been used for ROS localization and they rely on histochemistry, fluorescent dyes, and spectrophotometric measurements (Mittler et al., 2011). Histochemistry Histochemical methods are based on the oxidation of dyes in the presence of ROS, resulting in the production of insoluble precipitates. For example, nitro blue tetrazolium (NBT) chloride reacted with O2- to generate water-insoluble di-formazan, while 3-3-diaminobenzidine (DAB) is oxidized by H2O2 in the presence of peroxidases with formation of a dark-brown precipitate (Jambunathan, 2010). Fluorescent dyes Some chemical dyes became fluorescent after oxidation by ROS, like H2DCFDA, DHE or Amplex red (Ortega-Villasante et al., 2016). These dyes can be used for direct ROS localization. Spectrophotometric methods They allow to quantitatively determine ROS level after tissue homogenization, such as the determination of H2O2 levels with 3,5-dichloro-2-hydroxybenzensulfonic acid (DCHBS)in conjunction with 4-aminoantipyrine (AAP) (Van Gestelen et al., 1998). There methods were summarised in the graphical abstracts.Here we provide several detailed protocols for ROS localization and quantification under physiological conditions, aimed to improve current methods and to minimize artefacts.
Before start
Before ROS measurements, plants must be transferred to liquid medium for pre-adaptation for a minimum of 4 hours.
Steps
H2O2 quantification with DCHBS/AAP method.
Rationale. The majority of the published protocolos for ROS detection include only a single time point which does not allow the kinematic study of ROS levels in the same plants. Here we adapted the DCHBS/AAP method for kinematic analysis. Plants are grown in fully physiological conditions, a linear steady-state curve of H2O2 is first established and thereafter a given stress-factor can be added to observe changes in ROS accumulation in real-time. Measurements could be done continuoulsly using a microplate reader to study the kinetics of ROS changes after stress application.
Step 1. For tissue pre-adaptation, transfer your seedlings, cells, or tissue explants to a 40 mm round Petri plate containing 3-4 ml of the physiologically-balanced plant growth medium (e.g., TK1 for Arabidopsis or TK4 for tobacco) and incubate them for at least 4 h in the growth chamber.
Note: The volume ratio between plant growth medium and explants must be at last 20:1.
Step 2. Add DCHBS, AAP, and peroxidase to the plant growth medium at final concentrations of 1 mM, 0.1 mM, and 1 U/ml respectively. Collect 100-200 µl aliquots (dependent on your spectrophotometer requirements) of the plant growth medium and freeze them at 20 °C.
Step 3. Collect new aliquots after 60 min and freeze them at 20 °C.
Step 4. Start your treatments directly on the medium (add elicitor, stress agents, hormones, etc.) and collect aliquots every 60 min during the next 5, 6 or 8 h; freeze them at 20 °C.
Step 5. Weight your explants after carefully drying them with filter paper using a precision laboratory balance.
Step 6. Measure the absorbance at 510 nm for all aliquots kept on ice after unfreezing them. It is recommended to perform calibration for each time-point by addition of a known H2O2 amount to each sample after measure and record the absorbance at 510 nm.
Note: calibration results may be dependent on the presence of stress agents, pH, and other factors.
Step 7. Perform the calculation. The formula for the calculations is dependent on the type of your explants and resulted in H2O2 amount per mg of tissue (per cell in the case of cell suspension) per hours.
H2O2 (µmol) = (A510 (n) – A510 (n-1)/calibration)/volume/FW; (n) and (n-1) indicate consecutive time points of analysis.
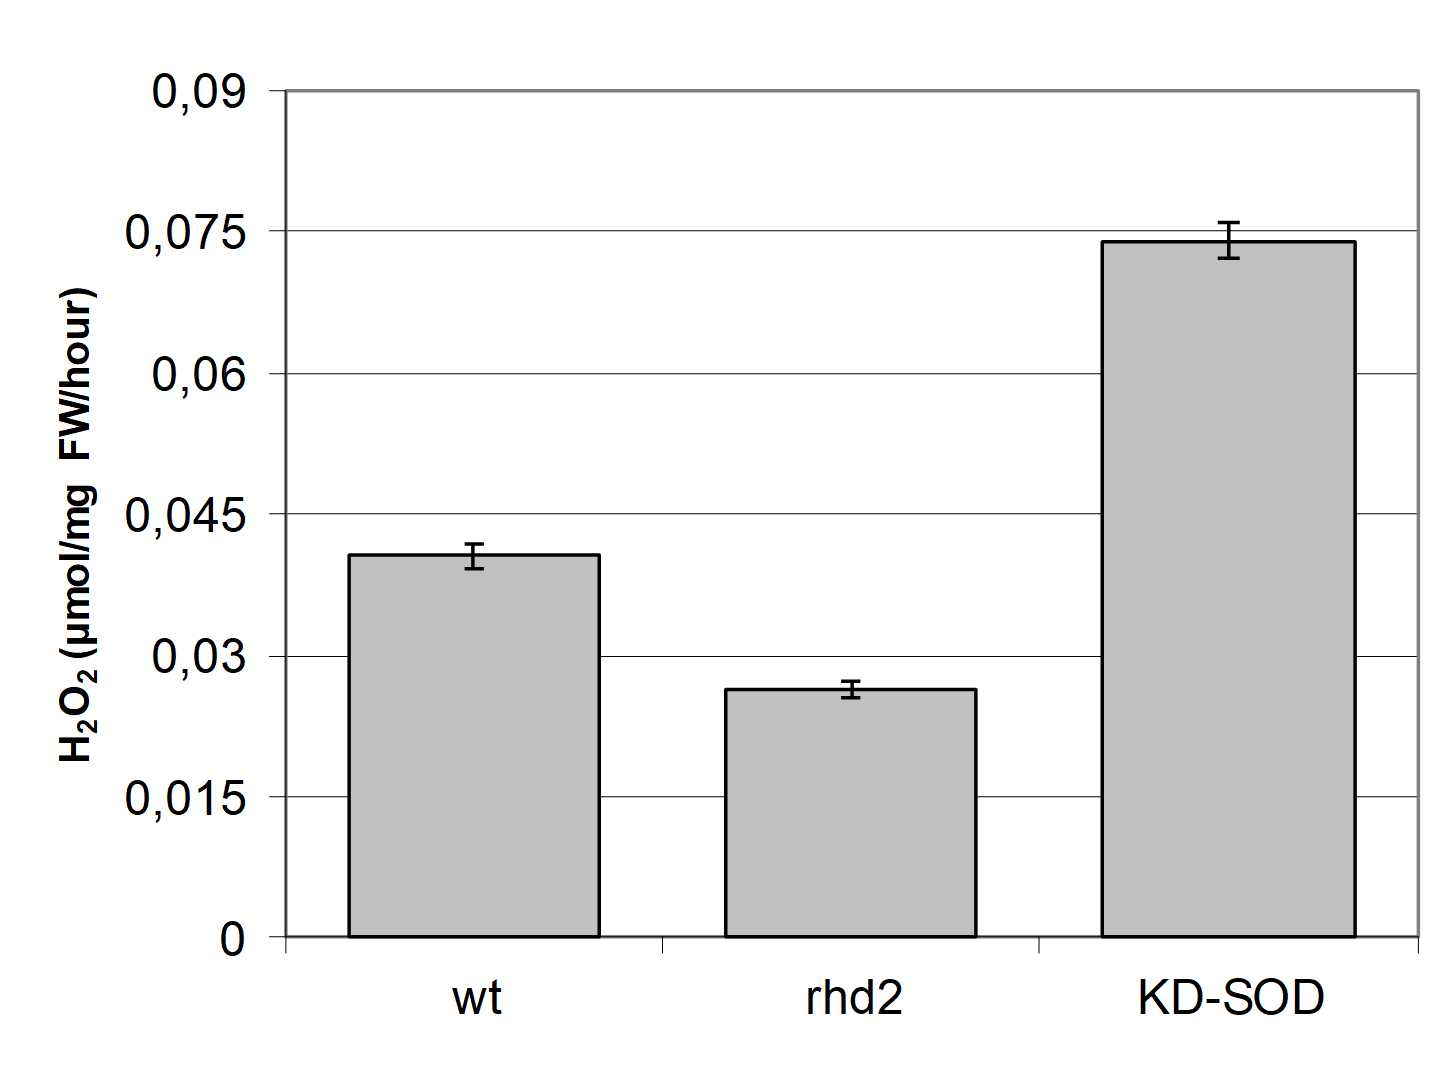
To study the relevance of ROS on plant growth and development, roots of two mutant genotypes were analysed: one impaired in ROS generation and the other in ROS scavenging activity. rhd2 carries a loss of function mutation in RbohC (Foreman et al., 2003), which displays a significant decrease in the rate of H2O2 level up to 0.026 ± 0.001 µmol H2O2 /mg/h (Figure 1). Conversely, the KDSOD line with reduced Cu/Zn-SOD activity (Rizhsky et al., 2003), showed a statistically significant increase in the rate of H2O2 accumulation over at 0.074 ± 0.002 H2O2 µmol/mg/hour. In contrast, wild-type plants produced 0.041 ± 0.001 µmol H2O2 /mg /h. The detailed description of the effect of exogenously added auxin on ROS in Medicago sativa protoplasts have been presented previously (Pasternak et al., 2007; Pasternak, 2020).
H2O2 might function as a signaling molecule, but when in excess, it can react with various cellular targets, thereby causing cell damage (Bienert et al., 2006). As H2O2 has a non-polar arrangement, it can move relatively rapidly across the cell membrane (Bienert et al., 2006, Laporte et al., 2020), and tends to mirror H2O2 cellular levels. The use of fluorescent dyes for measuring H2O2 levels has significant limitations, mainly for quantitative measure and kinetics studies. Most dyes have only ROS-sensitive components, but ROS-insensitive fluorescent references were missing. Moreover, maintaining the explants on physiological conditions during fluorescent microscope visualization is not always possible, hence imaging conditions may induce changes in ROS levels (Tosheva et al., 2020). To overcome these problems, we adapted the well-known DCHBS/AAP method (Van Gestelen et al., 1998) based on peroxidase (EC 1.11.1.7)-dependent oxidation of 3,5-dichloro-2-hydroxybenzenesulfonic acid (DHBS) to form red coloration product with absorbance at 510 nm. Such adaptation allows us to perform long-time quantification of the ROS levels to include kinematic analysis after stress application under optimal physiological conditions.
The described protocol can be applied for different types of explants (protoplasts, tissue explants, seedlings, etc.) and provides quantitative data on H2O2 levels.
Superoxide localization with NBT
Rationale. Despite of its experimental simplicity, nitro blue tetrazolium (NBT) staining methods are susceptible to some artifacts that might lead to data misinterpretation. In most cases, NBT staining of plant tissues is performed in buffers, such as 10 mM phosphate buffer at pH 6.1 (Dunand et al., 2007) or Tris-HCl at pH 9.5 (Kagenishi et al., 2016), that have a strong effect on superoxide production and that are non-physiological for plants. Although NBT has been used to monitor extracellular ROS, it has proven to be cytotoxic (Monshausen et al., 2007).
Given the fact that superoxide has an extremely short half-life, and cannot accumulate, we can detect only the superoxide which is produced during NBT incubation in non-physiological conditions. Hence, we cannot directly extrapolate the amount of formazan formation to the endogenous ROS levels. Another problem of this method is that NBT incubation of plant tissues led to some browning. Therefore, quantification of the formazan (blue) spots is normally performed after aggressively clearing plant tissues with chloral hydrate. In these conditions though, some plant cells that do not contain the formazan precipitate are also stained, and this needs to be considered for endogenous ROS quantification in these cells (Javvaji et al., 2020).
Step 1. Transfer several young (4-5 days-old) Arabidopsis seedlings to 40 mm Petri dishes containing 2 mL of TK1 medium. Perform pre-adaptation on this medium for at least 4 h to re-establish ROS balance.
Step 2. Prepare 500 µM NBT stock solution in distilled H2O.
Step 3. Add 220 µl of the NBT stock solution to the Petri plate (50 µM NBT final concentration), apply vacuum (30 sec) and release the vacuum gently.
Step 4. Incubate Petri dishes under dim light (10-20 µmol/m2/sec) with intermittent mixing for 20-30 min. Periodic observation of the blue precipitate under a binocular microscope in reflected light is possible.
Step 5. Transfer plants to hot (60 °C) methanol and incubate for 20 min. Perform slow re-hydration by gradual addition of distilled H2O.
Step 6. Incubate at least 20 min in distilled H2O to remove all methanol residue.
Note: : the presence of methanol residue may disturb sample clearing in chloral hydrate.
Step 7. Clear sample in chloral hydrate solution (8 g chloral hydrate, 1 mL H2O, 2 mL 50% glycerol) by incubation for 20-30 min.
Step 8. Mount sample on microscopic slide in the choral hydrate solution: transfer carefully the plants from the vial to the surface of the microscopic slide pre-loaded with a drop of chloral hydrate and gentle add a coverslip.
Step 9. Record images under transmitted light (DIC image).
 – before fixation; (B) – after fixation, in distilled H2O; (C), (D) – after clearing in chloral hydrate; formazan precipitates are indicated with black arrows.")
In panel A, the root before fixation and clearing is shown. The more dense meristematic cells are stained in blue, but this is a not due to formazan precipitation. Once the root was fixed with hot methanol, the meristematic zone turned brown, but after further clearing with chloral hydrate solution it became fully transparent and formazan precipitate occurred only in root hairs (trichoblast cell) and pericycle cells.
Fluorescent dyes: adapted protocol
One of the major problems in the usage of fluorescent dyes for measuring ROS is the experimental conditions during the labelling. Most of the described protocols (Dunand et al, 2007; Jambunathan, 2010, Rodríguez & Taleisnik, 2012) included transferring plants to phosphate saline buffers (PBS or sodium phosphate). Other protocols included incubation with dyes at 37 °C. All these protocols used non-physiological conditions (high temperature, saline buffers, etc.) that might significantly affect ROS production. Here we adapted these protocols to minimize the alteration in ROS induced by the measurements itself.
Superoxide detection with DHE
Rationale. Dihydroethidium (DHE) was able to freely permeate cell membranes and it has been used extensively to monitor superoxide accumulation. It had long been postulated that DHE upon reaction with superoxide anions forms a red fluorescent product (ethidium) which intercalates with DNA (Yamamoto, et al., 2002). However, more recent studies have suggested that the product is 2-hydroxyethidium (Zielonka, J. et al., 2008). DHE can be considered as the most specific and least problematic dye as it does not require any changes in growth conditions, it detects essentially superoxide radicals, is retained well by cells, and may even tolerate tissue fixation
Step 1. Pre-adapt young Arabidopsis seedlings in liquid TK1 medium in 40 mm Petri dishes for at least 4 h as described above.
Step 2. Add DHE from the stock solution in DMSO (5 mM) to the final concentration of 10 µM.
Step 3. Incubate for 20 min in the dark.
Step 4. Carefully mount on the microscopic slide: Take 150-200 µl of the medium, load to the slides and very carefully transfer the seedlings and cover them with coverslip.
Step 5. Observe samples under epifluorescent microscope with excitation at 550 nm and emission at 630 nm.
Note: minimization of illumination time is crucial, as high light or prolonged illumination might lead to artefacts. Illumination should be limited to 50-100 msec.

Here we performed superoxide localization in Arabidopsis roots. Roots were pre-adapted on TK1 medium, DHE solution was added, and images were taken after 20 min incubation on an Axiowert X200 Zeiss microscope. As it is visible from the picture, maximal local intensity was detected in trichoblast cells, which fitted well with the key role of superoxide during cell elongation (Monshausen et al., 2007; Jones et al., 2007). No superoxide accumulation was detected in the meristematic zone and a slightly higher intensity was found in the inner cells of the dividing zone of the meristem.
H2O2 detection with H2DCFDA
Rationale. H2O2 is involved in numerous signaling process, such as hormonal responses, cell division regulation, cell differentiation (i.e., root hair growth), etc. (Monshausen, et al., 2007). Hence, precise localization of H2O2 will help to understand the developmental effect of ROS. H2DCFDA can be used as the simplest dye to detect H2O2 accumulation in plants. Upon cleavage of the acetate groups by intracellular esterases and oxidation, the nonfluorescent H2DCFDA was converted to the fluorescent 2‘,7‘-dichlorofluorescein (DCF). Here we described an optimized protocol for H2O2 detection.
Step 1. Pre-adapt young Arabidopsis seedlings in liquid TK1 medium in 40 mm Petri dishes for at least 4 h as described above.
Step 2. Add H2DCFDA from the stock solution (2 mM in DMSO) to the final concentration of 1 µM.
Step 3. Incubate for 20 min in the dark.
Step 4. Carefully mount on the microscopic slide: Take 150-200 µl of the medium, load to the slides, and carefully transfer seedlings and cover them with coverslip.
Step 5. Observe samples under an epifluorescent microscope with excitation at 490 nm and emission at 530 nm.
Note: H2DCFDA is very sensitive to light and can rapidly be oxidized. Adjust focus with very low illumination with DIC light and minimize illumination time to 30-50 msec. It is highly recommended to use FDA as dye uptake and hydrolysis control.
. Fluorescent dyes (final concentration 1 µM) have been added directly to the culture medium and imaged. Observations have been done with an epifluorescent microscope with a band-pass GFP-specific filter. Illumination time has been restricted to 40-90 msec. (A, A1) – DIC and FDA labeling, optical effect is very visible), which is equally internalized, and it has a constitutive fluorescence, has been used as a control for optical root properties. (B, B1 – H2DCFDA). H2DCFDA, which is fluorescent only upon oxidation by H2O2, has been used as a marker of ROS accumulation. Scale bars – 100 µm.")
As it visible in this figure, H2O2 accumulation in the primary root of Arabidopsis is limited to the elongation zone, confirming the specific role of the ROS accumulation during cell differentiation.
Conclusions. Here we described robust and simple protocols for detection of the site of ROS quantification and localization. All these protocols include pre-adaptation of plant tissues under physiological conditions to avoid any artifacts during sample incubation and further sample processing.
Fluorescent dyes cannot be used for direct measurements as differences in dye uptake rates and cell geometry factors cannot be easily considered.
DCHBS/AAP method is suitable for direct ROS measurements per fresh weight (in the case of explants) and per cells (in the case of protoplasts) and can be used also for studying the kinetics of ROS accumulation in response to different stresses. In this case, stress-factors can be added after 1-2 h after the initiation of the experiment. In the case of sterile solution, incubation can be performed till 6-8 h without losing linearity.
Literature
- Asada, K. (2006). Production and scavenging of reactive oxygen species in chloroplasts and their functions. Plant physiology, 141, 391-396.
- Bienert, G. P., Schjoerring, J. K., & Jahn, T. P. (2006). Membrane transport of hydrogen peroxide. Biochimica et Biophysica Acta (BBA)-Biomembranes, 1758, 994-1003.
- Choudhury, F. K., Rivero, R. M., Blumwald, E., & Mittler, R. (2017). Reactive oxygen species, abiotic stress and stress combination. The Plant Journal, 90, 856-867.
- Dourmap, C., Roque, S., Morin, A., Caubrière, D., Kerdiles, M., Béguin, K., … & Couée, I. (2020). Stress signalling dynamics of the mitochondrial electron transport chain and oxidative phosphorylation system in higher plants. Annals of botany, 125, 721-736.
- Dunand, C., Crevecoeur M. and Penel, C. (2007). Distribution of superoxide and hydrogen peroxide in Arabidopsis root and their influence on root development: possible interaction with peroxidases, New Phytol. 174, 332–341 Foreman, J., Demidchik, V., Bothwell, J.H., Mylona, P., Miedema, H., Torres M.A., Linstead P., Costa S., Brownlee C. and Jones J.D. (2003). Reactive oxygen species produced by NADPH oxidase regulate plant cell growth Nature 422, 442–446.
- Huang, H., Ullah, F., Zhou, D. X., Yi, M., & Zhao, Y. (2019). Mechanisms of ROS regulation of plant development and stress responses. Frontiers in Plant Science, 10, 800.
- Jambunathan, N. (2010). Determination and detection of reactive oxygen species (ROS), lipid peroxidation, and electrolyte leakage in plants. In Plant stress tolerance (pp. 291-297). Humana press.
- Javvaji, P. K., Dhali, A., Francis, J. R., Kolte, A. P., Mech, A., Roy, S. C., … & Bhatta, R. (2020). An efficient nitroblue tetrazolium staining and bright-field microscopy based method for detecting and quantifying intracellular reactive oxygen species in oocytes, cumulus cells and embryos. Frontiers in Cell and Developmental Biology, 8, 764.
- Jones, M. A., Raymond, M. J., Yang, Z., & Smirnoff, N. (2007). NADPH oxidase-dependent reactive oxygen species formation required for root hair growth depends on ROP GTPase. Journal of experimental botany, 58, 1261-1270.
- Kagenishi, T., Yokawa, K., & Baluška, F. (2016). MES buffer affects Arabidopsis root apex zonation and root growth by suppressing superoxide generation in root apex. Frontiers in plant science, 7, 79.
- Laporte, A., Lortz, S., Schaal, C., Lenzen, S., & Elsner, M. (2020). Hydrogen peroxide permeability of cellular membranes in insulin-producing cells. Biochimica et Biophysica Acta (BBA)-Biomembranes, 1862, 183096.
- Mittler, R. (2017). ROS are good. Trends in plant science, 22, 11-19.
- Mittler, R., Vanderauwera, S., Suzuki, N., Miller, G. A. D., Tognetti, V. B., Vandepoele, K., … & Van Breusegem, F. (2011). ROS signaling: the new wave? Trends in plant science, 16, 300-309.
- Monshausen, G. B., Bibikova, T. N., Messerli, M. A., Shi, C., & Gilroy, S. (2007). Oscillations in extracellular pH and reactive oxygen species modulate tip growth of Arabidopsis root hairs. Proceedings of the National Academy of Sciences, 104, 20996-21001.
- Ortega-Villasante, C., Burén, S., Barón-Sola, Á., Martínez, F., & Hernández, L. E. (2016). In vivo ROS and redox potential fluorescent detection in plants: Present approaches and future perspectives. Methods, 109, 92-104.
- Pasternak, T. P., Ötvös, K., Domoki, M., & Fehér, A. (2007). Linked activation of cell division and oxidative stress defense in alfalfa leaf protoplast-derived cells is dependent on exogenous auxin. Plant Growth Regulation, 51, 109-117.
- Pasternak, T. P. (2020). Oxidative stress inducing agents copper and alloxan accelerate cell cycle re-entering of somatic plant cells in the presence of suboptimal exogenous auxin. bioRxiv.
- Pasternak, T., Paponov, I. A., & Kondratenko, S. (2021). Optimizing protocols for Arabidopsis shoot and root protoplast cultivation. Plants, 10, 375.
- Richards, S. L., Wilkins, K. A., Swarbreck, S. M., Anderson, A. A., Habib, N., Smith, A. G., … & Davies, J. M. (2015). The hydroxyl radical in plants: from seed to seed. Journal of experimental botany, 66, 37-46.
- Rizhsky L, Liang H, Mittler R (2003). The water-water cycle is essential for chloroplast protection in the absence of stress J Biol Chem 278, 38921–38925.
- Rodríguez, A. A., & Taleisnik, E. L. (2012). Determination of reactive oxygen species in salt-stressed plant tissues. In Plant Salt Tolerance (pp. 225-236). Humana Press, Totowa, NJ.
- Sandalio, L. M., Peláez-Vico, M. A., Molina-Moya, E., & Romero-Puertas, M. C. (2021). Peroxisomes as redox-signaling nodes in intracellular communication and stress responses. Plant Physiology, 186, 22.
- Torres, M. A. (2010). ROS in biotic interactions. Physiologia plantarum, 138, 414-429.
- Tosheva, K. L., Yuan, Y., Pereira, P. M., Culley, S., & Henriques, R. (2020). Between life and death: strategies to reduce phototoxicity in super-resolution microscopy. Journal of Physics D: Applied Physics, 53, 163001.
- Van Gestelen P, Asard H, Horemans N, Caubergs RJ (1998) Superoxide producing NAD§H oxidases in plasma membrane vesicles from elicitor responsive bean plants. Physiologia Plantarum 104, 653-660.
- Yamamoto, Y., Kobayashi, Y., Devi, S. R., Rikiishi, S., & Matsumoto, H. (2002). Aluminum toxicity is associated with mitochondrial dysfunction and the production of reactive oxygen species in plant cells. Plant physiology, 128, 63-72.
- Zielonka, J., Vasquez-Vivar, J. & Kalyanaraman, B. (2008) Detection of 2-hydroxyethidium in cellular systems: a unique marker product of superoxide and hydroethidine. Nat Protoc 3, 8–21.
