Monitoring the point spread function for quality control of confocal microscopes
Fabio Barachati, Mariana T Carvalho, Orestis Faklaris, Marcel Kirchner, Stanley Schwartz, Tse-Luen Wee, Kees van der Oord, Roland Nitschke, Laurent Gelman, Rainer Heintzmann, Glyn Nelson, Ioannis Alexopoulos, Maria Azevedo, Yury Belyaev, Yann Cesbron, Aurelien Dauphin, Alexander D Corbett, Nadia Halidi, Xiang Hao, Hella Hartmann, Peter Hemmerich, Judith Lacoste, Penghuan Liu, Laure Plantard, Claire A Mitchell, Tobias Müller, Alex L Payne-Dwyer, Santosh Podder, Rachid Rezgui, Sandra Ritz, Michael J Shaw, Ian M Dobbie
Disclaimer
This protocol was developed by the members of QUAREP-LiMi Working Group 5. The member list can be found here: (hhttps://quarep.org/working-groups/wg-5-iso-lateral-and-axial-resolution/)
The QUAREP-LiMi is a group of scientists interested in improving quality assessment (QA) and quality control (QC) in light microscopy. We first came together on April 2020 and as of October 2022 the group has grown to 456 people from 34 countries spread around the world. We have members from academia, microscopy communities, companies, organizations or institutions related to standardization, scientific publishers, and observers from funding agencies.
Abstract
This protocol focuses on measuring the microscope's lateral and axial resolution, essential for reporting size measurements of near-resolution limit objects or distances between them. Here resolution is expressed as the Full Width at Half Maximum (FWHM) of a measured Point Spread Function (PSF) of sub-resolution size beads. PSF is highly related to objective quality and condition, but also depends strongly upon other parameters ranging from sample preparation to signal detection. Monitoring PSF over time will identify possible aberrations in the system (e.g., damaged, unclean objective, defective or not adapted oil, etc.). We define test sample preparation, image acquisition, and data analysis protocols for point scanning and spinning disk confocal microscopes.
Before start
Bead sample preparation section- this should be done at least two days before starting imaging to ensure suitable curing times for mountant.
Bead image acquisition section- the system should be warmed up for 1 hour before starting to ensure thermal stability to avoid axial drift during imaging.
Steps
Bead Slide Preparation
Coverslip Preparation
Immerse the coverslip in a beaker with 1M HCl and agitate for 30 min at room temperature.
Rinse the coverslip twice with 250 mL of distilled water and immerse in 100% Ethanol for storage.
Bead dilution
Centrifuge the bead stock solution for a few seconds in a benchtop centrifuge to collect all suspension in the bottom of the tube and then vortex for 2 to 3 minutes.
Dilute the fluorescent beads in H2O.
Take a cleaned coverslip, allow to air-dry, then dispense 10 μl of the bead solution as mini-droplets across the coverslip, ensuring the drops are as small as possible.
Let the coverslips with droplets air-dry at room temperature (it takes at least one hour) in a dust-free environment (ideally a laminar flow hood, otherwise under cover, e.g. a tip box lid).
The bead slide preparation described below contains steps previously published in the following protocols:
Bead slide mounting
Clean the microscope slides with 100% Ethanol and lens tissue, and allow to air dry.
Place a drop of mounting medium in the centre of a microscope slide. For a 22 x 22 mm coverslip, 12 μL of medium is sufficient.
Using forceps, gently take a dried coverslip and place it bead-side down onto the drop of mounting medium in the centre of the microscope slide, lowering down from one side to the other to push the excess medium and potential bubbles towards the opposite edge.
Remove any bubbles and excess mounting medium by covering with lens tissue and pressing very gently. Remove lens paper immediately, taking care not to remove the coverslip with it! Let the mounting medium cure (if required) to reach its optimal refractive index by storing slides in the dark at room temperature.
Seal the coverslip edge with Picodent dental silicone or other two component silicone (see Materials), ensuring the resulting seal is not so thick that you will be able to focus with large blunt-nosed objectives.
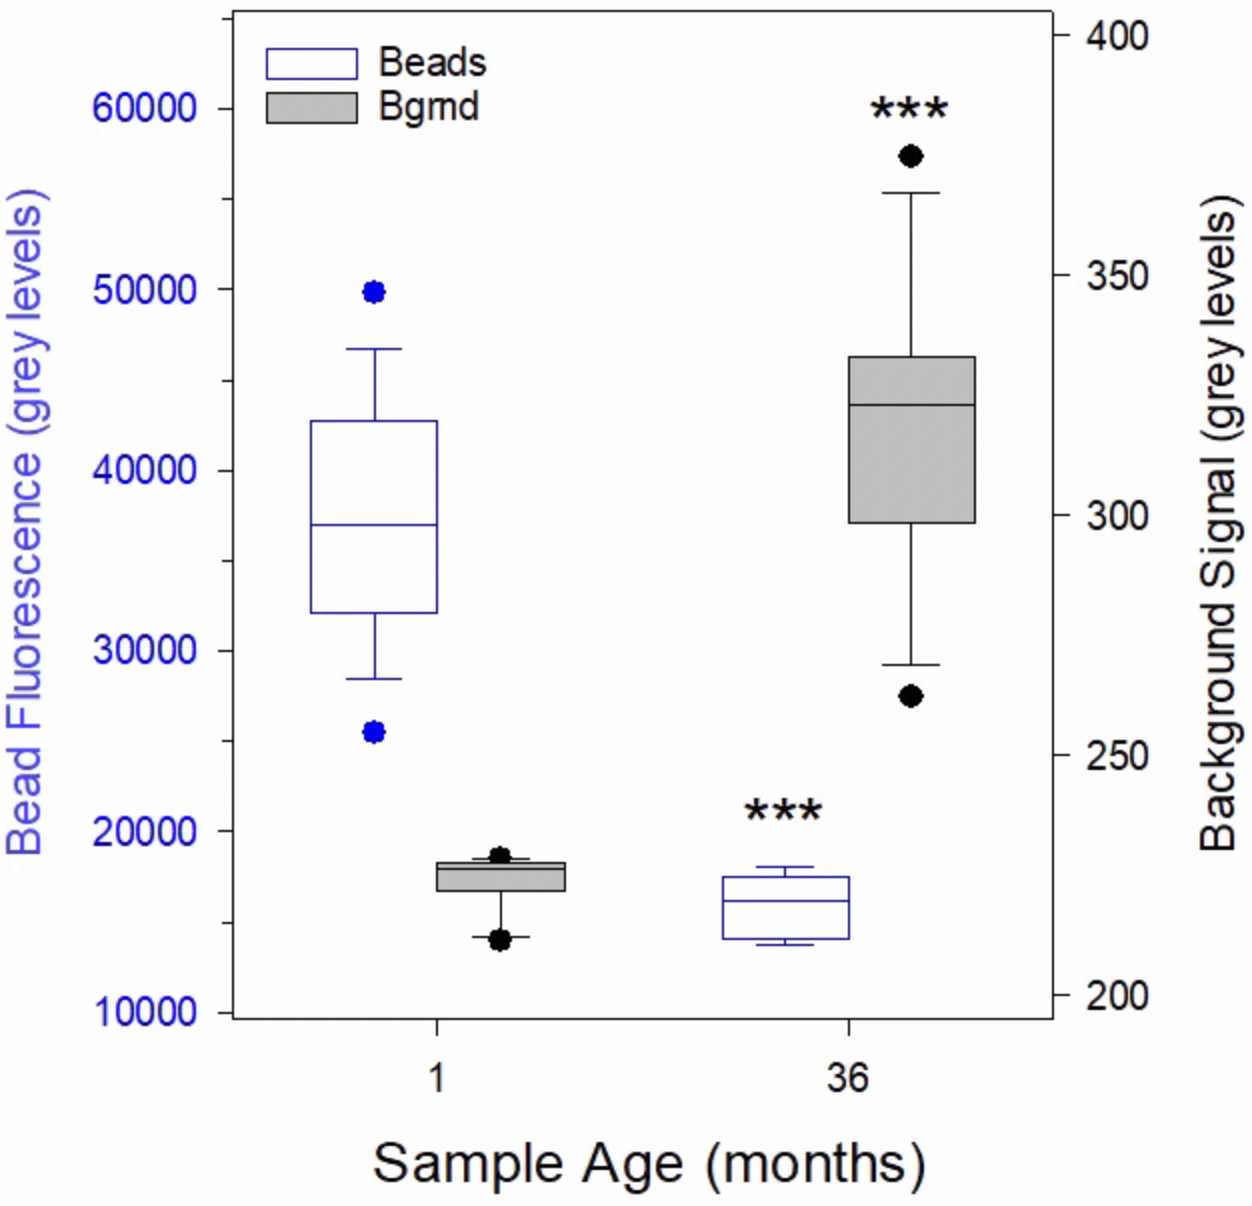
The bead slides can be stored at room temperature for 6-12 months.
Bead image Acquisition
Prepare the microscope system.
Allow the system to warm up, ensuring everything is turned on to allow system stabilisation.
Use a high magnification, high NA objective, e.g. 63x/1.4 on point scanning confocal microscopes or 100x/1.4 on spinning disk systems.
| A | B | C | D | E | F | G | H | I | J |
|---|---|---|---|---|---|---|---|---|---|
| Point Scanning Confocal | Spinning disk Confocal | ||||||||
| NA | n | λEm | λEx | xy | z | max Bead | xy | z | max Bead |
| 1.45 | 1.515 | 525 | 488 | 171 | 399 | 110 | 184 | 524 | 175 |
| 1.4 | 1.515 | 525 | 488 | 177 | 458 | 175 | 191 | 524 | 175 |
| 1.3 | 1.515 | 525 | 488 | 191 | 582 | 175 | 205 | 524 | 175 |
| 1.2 | 1.33 | 525 | 488 | 207 | 567 | 175 | 223 | 524 | 200 |
| 0.8 | 1 | 525 | 488 | 311 | 1073 | 250 | 334 | 524 | 250 |
| 0.75 | 1 | 525 | 488 | 331 | 1268 | 250 | 357 | 524 | 250 |
Table 1: Theoretical lateral (xy) and axial (z) Full Width at Half Maxima (FWHM) (in nm) for various common lens NAs with their associated immersion medium refractive indices (n) and recommended maximum bead size (nm) to check system quality for that objective. Values are calculated using the Equations given in MetroloJ_QC. NB bead size recommended is for Quality checks, not system resolution checks (see reference below), and is a trade-off for sample ease of use and broad compatibility across NAs with a robust sample for multiple use/ longevity. Theoretical resolutions were calculated using lateral resolution: and axial resolution:
Clean your objective lens.
Allow the temperature to stabilize.
Find the beads.
Place your sample on the stage with sufficient immersion medium to just allow coverage of the lens's front element once it has made contact with the coverslip.
Focus on the beads using epifluorescence and a filter set matching the fluorescence properties of the beads (i.e. the GFP or FITC filter set) - the focal plane is right at the coverslip-mountant interface. The beads will be denser in certain areas. Focussing in a dense area is easier, so moving the stage in x and y directions while focussing helps.
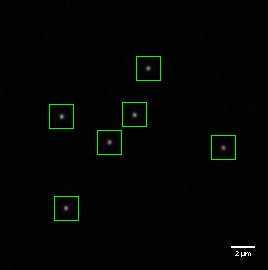
Move to an area where beads are sparse and ensure you have at least one bead in the centre of the Field of View (FoV), with none too near to each other so that overlapping PSF patterns are avoided. We recommend a spacing at least 4 μm between neighbouring beads.
Acquisition settings
Where possible, set the confocal "zoom" to use the centre of the FoV.
Ensure at least one bead is in or near the centre of the FoV.
Set the capture parameters to achieve a voxel size of 40x40x100 nm for objectives with NA>1.3 (see Figure 4).
On LSMs, keep the pinhole wide open.
Using a live image, optimise the laser power (the 488 nm line is recommended for the beads used here) and the detector gain to obtain a reasonable signal with a minimum background such that the detected noise is not clipped at zero. Set image acquisition parameters to capture in single direction mode and use averaging or increased pixel dwell time to improve signal to background ratio (SBR). Adjust the focal plane for the maximum intensity. Ensure that no bleaching of the beads occurs by decreasing the laser power and no pixel saturation, by if needed changing the detector gain.
Using the z focus drive (ideally a piezo drive if available), ensure you are at the axial centre of the bead (select for the widest and brightest signals). Set the z stack to capture 5 μm with a stepsize of 100 nm (51 slices) minimum using the centre of the bead as the centre of the stack (See Figure 4 for justification of axial sectioning).
Capture images of multiple beads (at least 6, ideally 20).
Bead Analysis
Bead analysis consists in measuring the FWHM of the acquired PSFs. First one has to choose the analysis software.
Each analysis software may use a different fitting method of the PSF. Most software packages use a 1D or 2D Gaussian fit. Although confocal PSFs can be sufficiently fitted by a Gaussian function, the fitting method is crucial for an accurate measurement of the FWHM and thus the assessment of the objective performance.
For monitoring the performance of the objective over time, using the same protocol (sample preparation, acquisition and analysis software) is mandatory.
Before analyzing the images visually inspect the acquisitions. Some images need to be cropped to remove saturated beads. An alternative option can be used to automatically discard any saturated beads from the image, if the analysis software offers this option.
To measure the FWHM, the software package needs to read the image metadata, such as the voxel size. This can be done directly or has to be inserted manually, depending on the software. The software may then need the user to insert other parameters, like the objective numerical aperture, the excitation-emission wavelengths, the pinhole size, the bit depth, among others, for different metrics calculations. The software may then allow a batch analysis of multiple images and multiple acquisitions and provide an average FWHM.
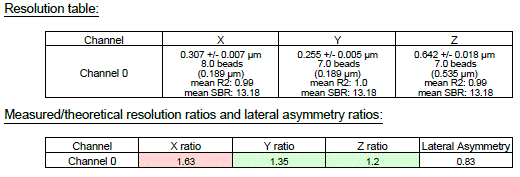
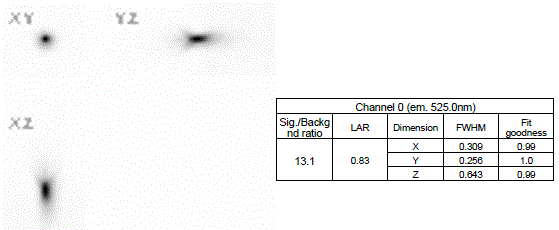
Here is a common result of an analysis software (MetroloJ_QC) for a FWHM calculation of one bead.
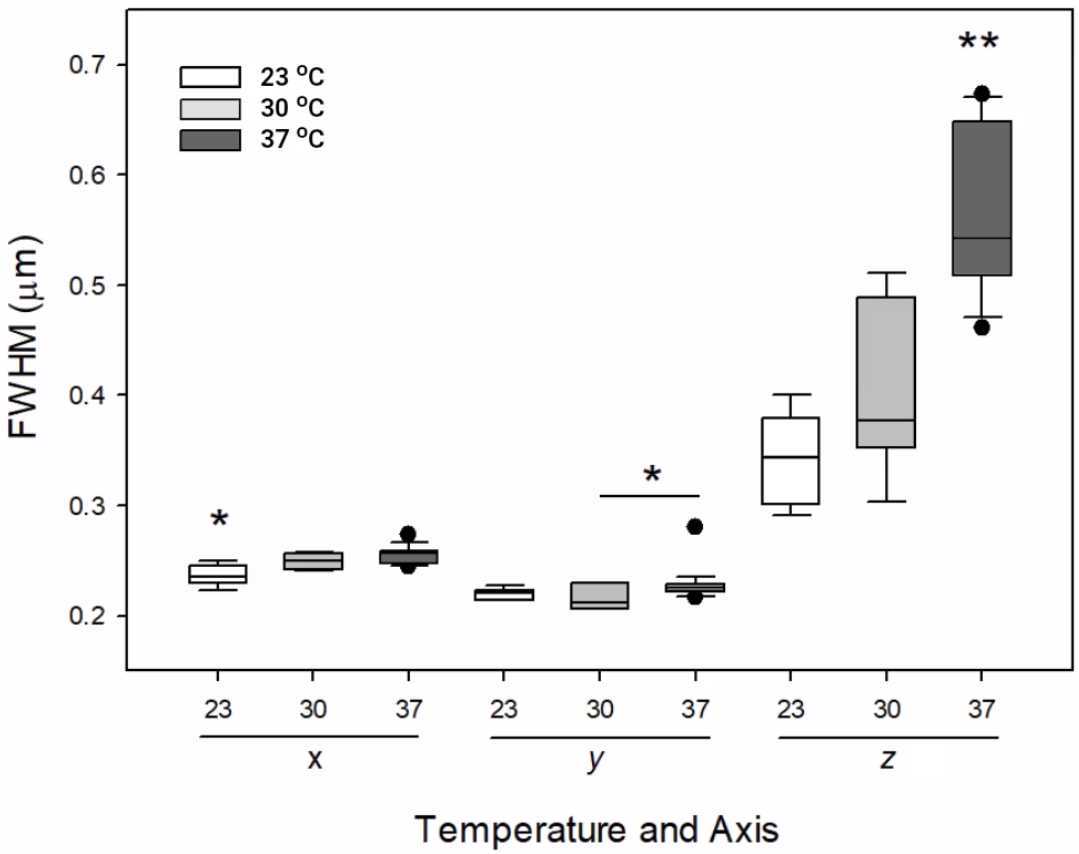
The most important parameter to be calculated is the FWHM along the xyz dimensions. Other information, such as the SBR, the lateral asymmetry ratio (LAR) or the goodness of fit r2can be provided by the software.
The analysis method is up to the user. We recommend to at least plot the data as box and whisker plots and to keep track using Excel, Airtable, OMERO, or other suitable software. KNIME for example, can be used to track output from PSFj over time to monitor a system's performance.
Appendix 1: Aberrations and PSF
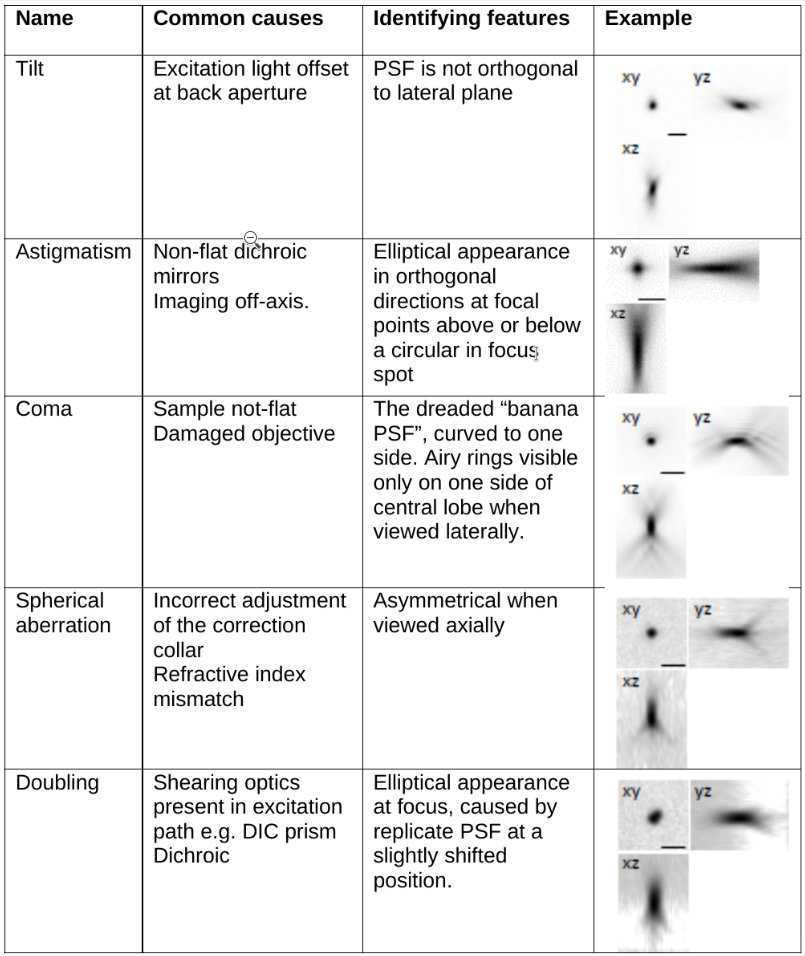
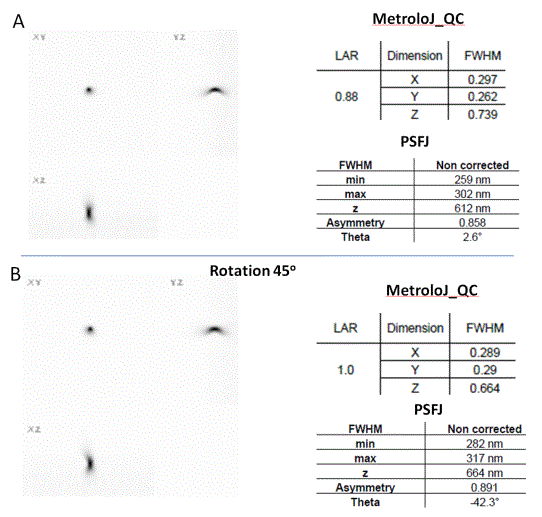
Aberrations reduce the resolution and sensitivity of a light microscope. Careful inspection of the collected PSF can help to identify potential aberrations causing poor microscope performance. Examples of common aberrations are shown in Table 1.
Appendix 2: Tutorials
MetroloJ_QC manual:
https://github.com/MontpellierRessourcesImagerie/MetroloJ_QC
PyCalibrate manual and video tutorial:
https://www.psfcheck.com/psfcheck-processing
PSF characterization video from the microscopy technology network rtmfm (https://rtmfm.cnrs.fr/):
Appendix 3: MetroloJ_QC analysis method
Here we provide instructions for running MetroloJ_QC in Fiji, since Fiji comes with the Bioformats plugin automatically installed, allowing easy import of raw images.
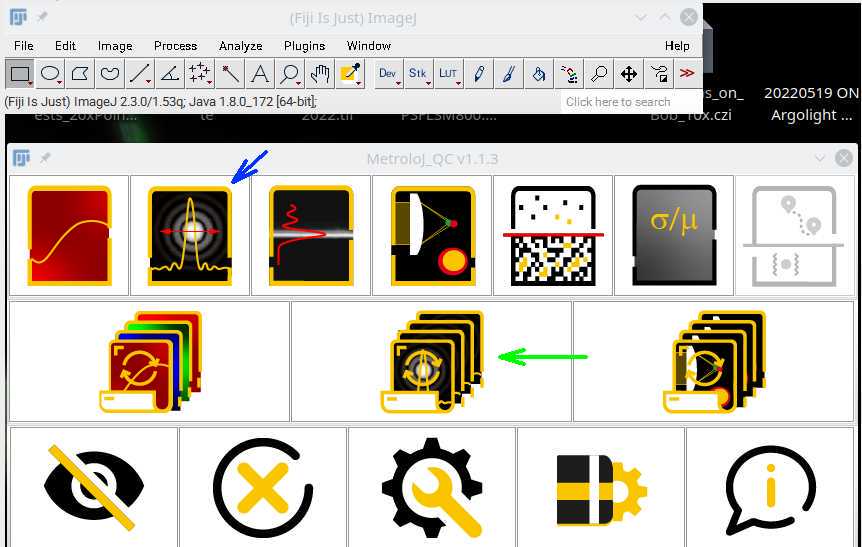
Open Fiji and then start the MetroloJ_QC plugin from the Plugins menu.
Run either the single image PSF calibration (Figure 1, blue arrow) or the batch multi image option (green arrow), which will process all images in a directory.
Running the batch option will ask for a directory- select the directory containing the raw image files.
Most of the metadata should be imported correctly from raw microscope files (voxel size), but parameters should be double checked and missing values entered manually, such as the excitation/emission wavelengths, the objective NA, the image bit depth, or the pinhole size. Several parameters are variable depending on your preferences and dataset, such as whether to discard saturated beads (recommended), the prominence value (important for properly thresholding and taking into account all the beads) and the ROI around the bead (Figure 2). If beads are closer than the given ROI, then the beads are discarded.
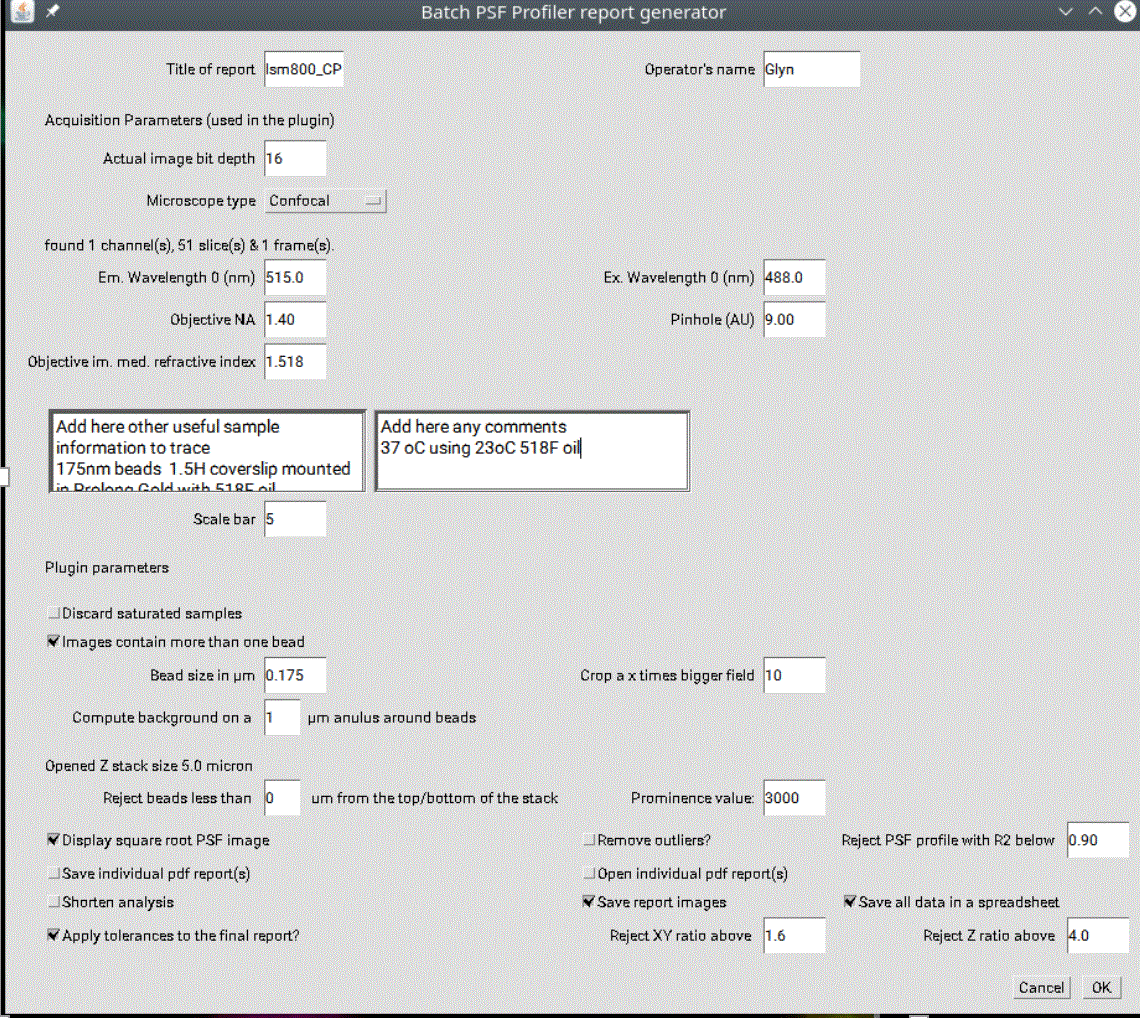
The plugin calculates the FWHM along the x, y, and z-axes of all beads in the field of view. FWHM is measured as follows: the maximum intensity pixel within the entire 3D data set is determined. An intensity plot along a straight line through this maximum intensity pixel point is extracted in all dimensions. The curves are fitted by a Gaussian function using the built-in ImageJ curve fitting algorithm to determine the FWHM. After automation of the FWHM measurements on several beads/datasets, average values are extracted in all three dimensions, and standard deviations are calculated. In case the algorithm detects spots that do not originate from the beads, they can be removed using the fitting parameter r2.
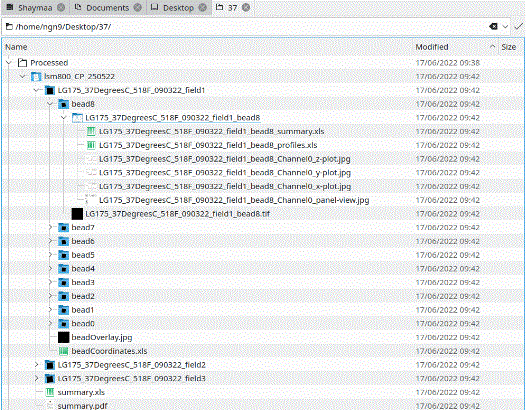
Upon completion, the batch PSF tool will leave the found bead co-ordinates from the last image in the directory showing in the Results table. Navigate to the folder of raw images and you will find a new sub-directory structure with summary csv files (.xls), a pdf and individual bead data.
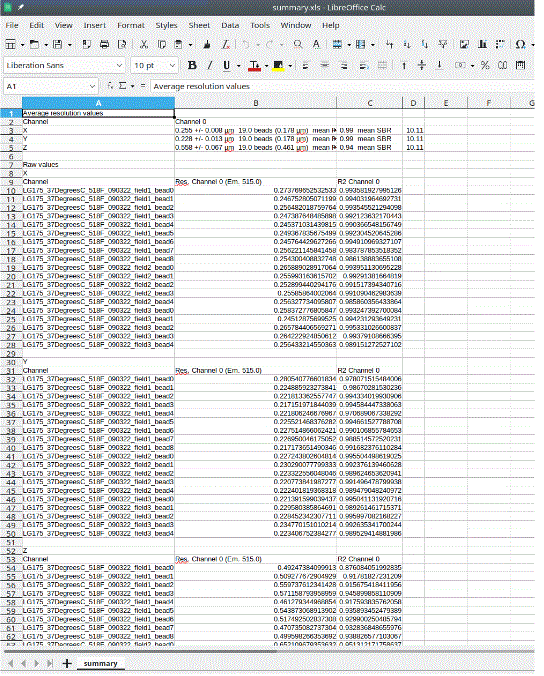
The summary.xls file contains the means, SDs and SBRs for all three axes, plus the individual bead FWHM and goodness of fit (r2).
The plugin calculates two QC metrics. The first one is the measured to theoretical FWHM ratio. If the ratio is greater than the value indicated as tolerance value in the metadata and plugin parameters step (step 33) then the value appears in red. If the value is within recommendations, it is highlighted in green. The second parameter is the Lateral Asymmetry Ratio (LAR), defined as the ratio of the minimal to the maximal xy FWHM value.
