Microwave Synthesis of Lanthanum-Doped Carbon Dots
Samuel Holberg, Addy Cullen, Chih-Yu (Jill) Lee, Destiny Caulder, Geisianny AM Moreira, Eric S McLamore
Disclaimer
Any opinions, findings, and conclusions or recommendations expressed in this piece are those of the author(s) and do not necessarily reflect the views of the National Science Foundation or the National Institute of Food and Agriculture.
Abstract
This protocol describes the synthesis of lanthanum-doped carbon dots using microwave irradiation. The complete process requires approximately 1h 50 min to complete (including baseline analysis). For this protocol, an Anton-Parr microwave reactor (Monowave 50p) was used throughout. The application example is for water quality sensing, although we have used the particles for cell imaging in other studies. ADA compliant procedures are used throughout the protocol (including both building lab space/design and analysis of synthesized particles).
Before start
Be sure to wear appropriate safety PPE throughout (lab coat, gloves, eyewear).* Electronic or physical lab notebook may be used throughout
- See experimental plan guide for tips on planning your work
Steps
SECTION 1) Preparation
Prepare Solution 1 (200 mM D-glucose)
- Prepare a sealed plastic or glass container that has at least
10mLof capacity and label as 200mM D-glucose - Weigh
0.721gof D-glucose and solvate in200mLof DI/nano-pure water - Mix solution and look carefully to ensure there are no precipitates
- Cover with Parafilm
- Heat in microwave for
0h 1m 30sto expedite solvation - Shake/stir well and look carefully to ensure there are no precipitates
- Seal vial immediately (contamination is a common problem)
Prepare Solution 2 (2.5 mM KCl)
- Prepare a sealed container with 1L capacity and label as 2.5 mM KCl
- Weigh
0.1864gand solvate in1Lof DI/nano-pure water - Mix and inspect carefully to ensure there are no precipitates
- Seal vial
Prepare Solution 3: (100mM MES buffer)
- Prepare a sealed plastic or glass container that has at least 1L of capacity and label as 100mM MES buffer
- Prepare a solution of
0.1Molarity (M)2-(N-morpholino)ethanesulfonic acid (MES buffer). This buffer has a pKa of 6.15 at 25°C; MW=195.2 g/mol (link to Good’s buffers) - For a
1Lbuffer solution, weigh19.52gof MES in a plastic weigh boat - Transfer the MES powder from the weigh boat to the labeled storage container
- Add
1Lof DI water or nano-pure water - Mix solution and look carefully to ensure there are no precipitates
- Check the pH of the solution (should be approximately
6.2). - Seal vial
Prepare solution 4 (200mM La2CO3)
-
Prepare a sealed plastic or glass container that has 9.9mL of MES buffer and label as MES+200mM La2CO3
-
Prepare solution of
6Molarity (M)HCl (see guidance here)Safety information6M HCl should be handled under the chemical hood at all times. When storing under the chemical hood after use, be sure to place inside a secondary container to avoid spill accidents. The pH of HCl is 1.5 to 2.0 -
Weigh
0.916gof La2CO3 in weigh boat capable of holding 1mL of fluid -
Transfer the weigh boat and container to the chemical hood
-
Pipette
0.1mLof HCl (6M) into the petri dish and carefully agitate the dish until all powder is dissolved -
Carefully transfer the solvated La2CO3solution to the container
-
Mix solution and look carefully to ensure there are no precipitates
-
Calculate the theoretical pH according to Henderson/Haselbalch equation:

- Check the pH of the solution (should be approximately
5.5), or within 2% of calculation based on pKa - Seal vial
Prepare reaction vials
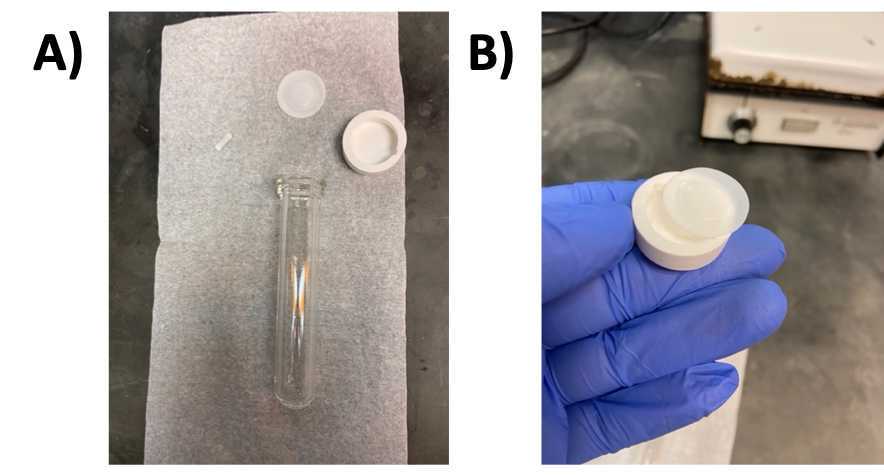
- Check vial cap and Teflon liner to make sure neither is damaged, and both are clean ( Fig 2A-B )
Add solution to reaction vial
- Pipette
3mLof0.2Molarity (M)D-glucose solution to a glass reactor vial - Add a nano stir bar to the reactor vial
- Add
3mLof the La2Co3+ buffer solution to the reactor vial - Place Teflon liner in cap
- Seal reaction vial with cap
- Invert vial three times to mix solutions
- Place in test tube rack
SECTION 2) Particle synthesis
Set up microwave reactor
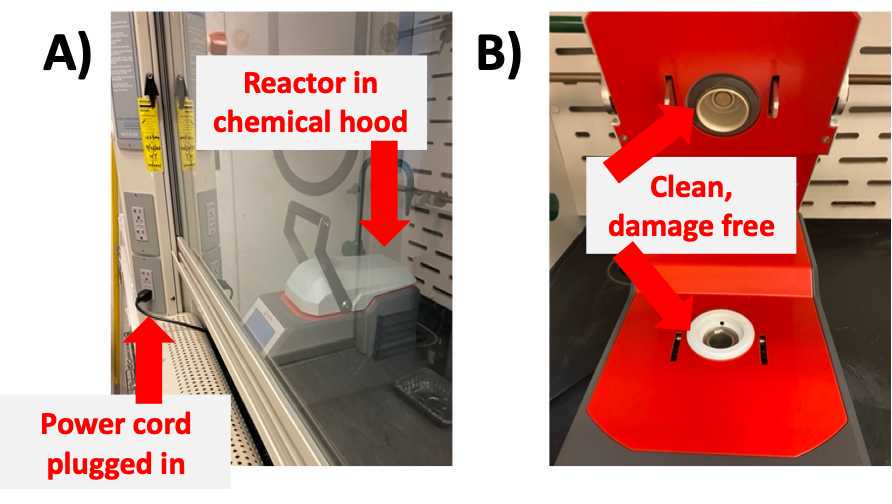
- Ensure that Anton-Paar reactor is in chemical hood and plugged in to the power outlet ( Fig 3A )
- If not placed in the chemical hood, the institutional safety committee must approve of the exhaust hose setup (using either a snorkel exhaust and/or valid tube/hose system)
- Open lid and place glass reactor in Anton-Paar reactor chamber ( Fig 3B )
- Close chamber lid and seal shut with handle
-
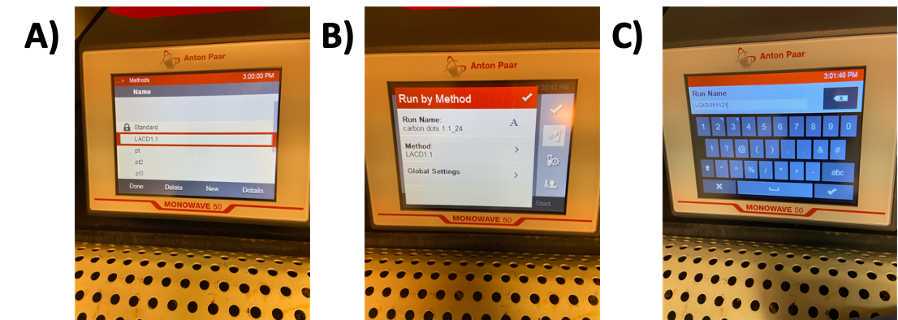
Select LaCD settings in the “Run by Methods” ( Fig 4 ) by pressing the Menu button
-
Press Menu
-
Press Methods button
-
Choose LACD1.1
-
Click Done
-
Click back
NoteCritical step : When running for the first time, LACD1.1 will need to be created. Create a method that has a maximum set temperature of 170 °C, a time to ramp as 5 minutes with a hold time of 1 minute. -
Choose Run Name
-
In the text box, name the file as “LACD-today’s date” ( Fig 4 )
-
Prior to starting the Monowave, make sure that the settings are correct and have not been changed
-
Maximum set temperature=
170°C -
Time to ramp setting=
0h 5m 0s -
Hold time=
0h 1m 0s
- Click run
- This protocol is similar to other lanthanum-doped carbon dots in the literature and has a variety of uses from cell labeling to water quality analysis (REF 1-3).
SECTION 3) Reactor data collection
Download reactor temp/pressure profile (Timing: 5 minute)
- Insert USB to port on right side of Monowave 50 p
- Press “Details”
- Press “Export”
- Choose the Export option, press “OK” when done
- Remove USB
SECTION 4) Stabilization and analysis (post cook)
Stabilize particles in buffer
-
Prepare a sealed plastic or glass container that has
10mLof capacity and label (Lanthanum-doped carbon dots + KCl).NoteCritical step : Be careful not to lose the nano stir bars, they are the most frequently misplaced item in this protocol. -
Mix the 6mL of pyrolyzed solution with
4mLof0.0025Molarity (M)KCl. This results in a final concentration of 1mM KCl + LACDNoteNote : If the recipe is altered, the storage buffer must be optimized. For this protocol, we used Zeta potential as an indicator of particle stability (analyzed daily over a 2 week experimental study) -
Inspect solution carefully for any colloids or particulate.
-
Seal vial
Qualitative analysis (color)
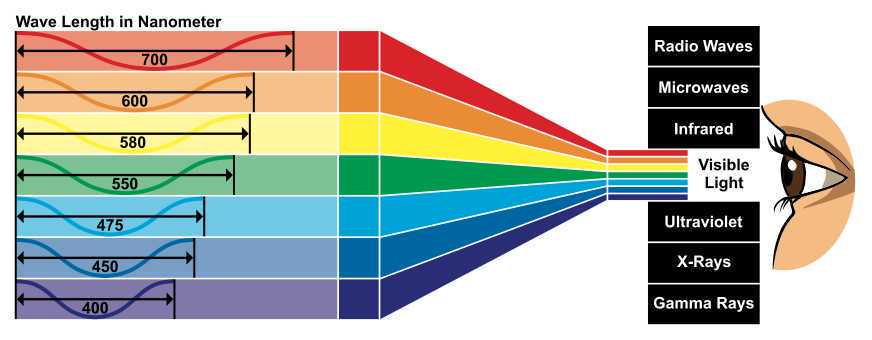
- The first step of qualitative analysis is visual inspection of the solution color
- Analysis of polychromatic visible (VIS) color is an important quality control mechanism in particle synthesis ( Fig 5 )
-
Observe the glass vials under white light (common lab lighting)
-
Representative photos of "as prepared" particle solutions are shown in Fig 6 .
-
The images depict a “burned sample” ( Fig 6A ), “undercooked sample” ( Fig 6B ) and an optimum sample ( Fig 6C )
-
In addition to visual inspection, UV-VIS may be used to analyze the samples
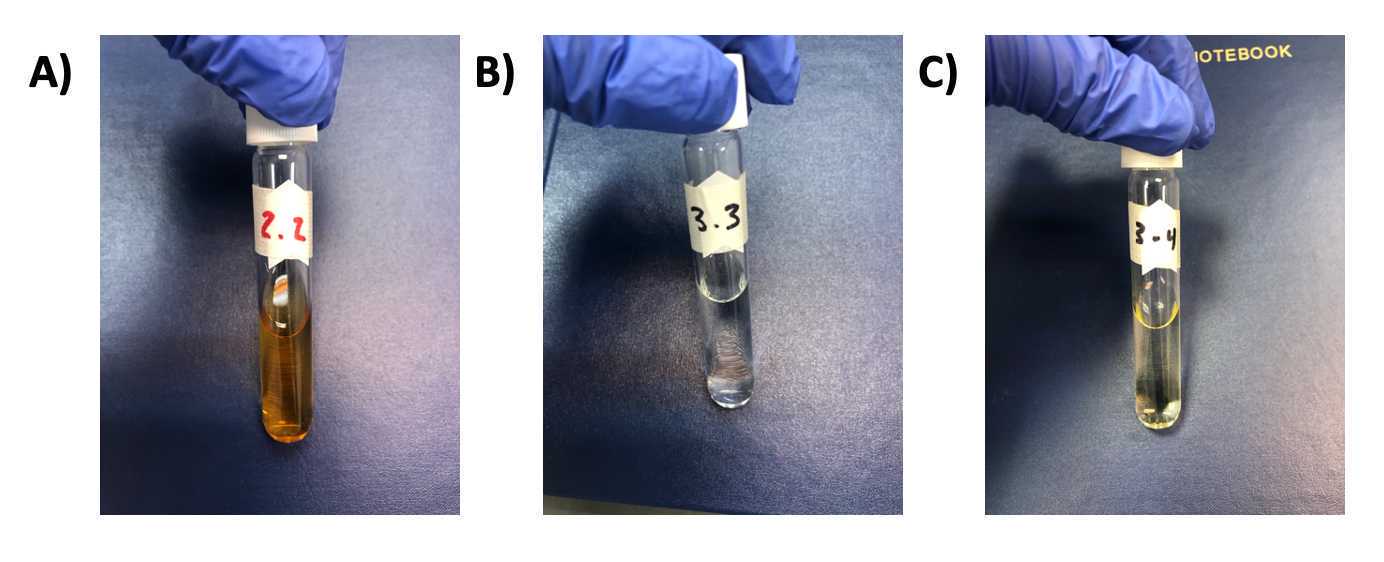
Figure 6. Representative photos of lanthanum-doped carbon dot solutions after microwave reaction. A) Sample with dark brown color that has been “burned” by either: reaction settings incorrect, contamination of the sample with a strong acid, or other problems. B) Sample that underwent insufficient reaction (clear color). C) Sample that is the optimum color for this protocol (based on extensive spectroscopy and material analysis). -
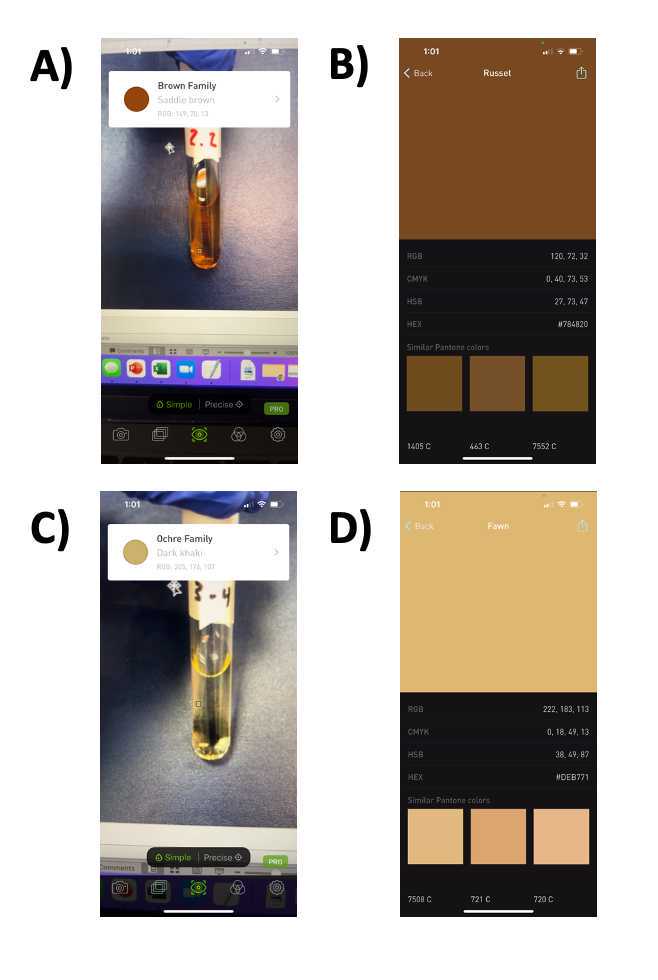
Representative results of using a mobile phone app for identifying color are shown below ( Fig 7 ).
-
The same photos as shown in Fig 6 are analyzed using an iPhone app, providing RGB and CMYK color space data for the identified color.
Qualitative analysis (fluorescence emission)
- Using either low light conditions or a prepared light box for analysis (e.g., black styrofoam), position a 395 nm UV pen perpendicular to glass storage vial,
- Turn on pen and inspect for an emission beam
- Fig 8A shows an example of fluorescence for a sample following the protocol described here
- This rapid analysis is useful for quality control immediately after synthesis of particles, but should be supported by subsequent quantitative analysis (shown in step below).
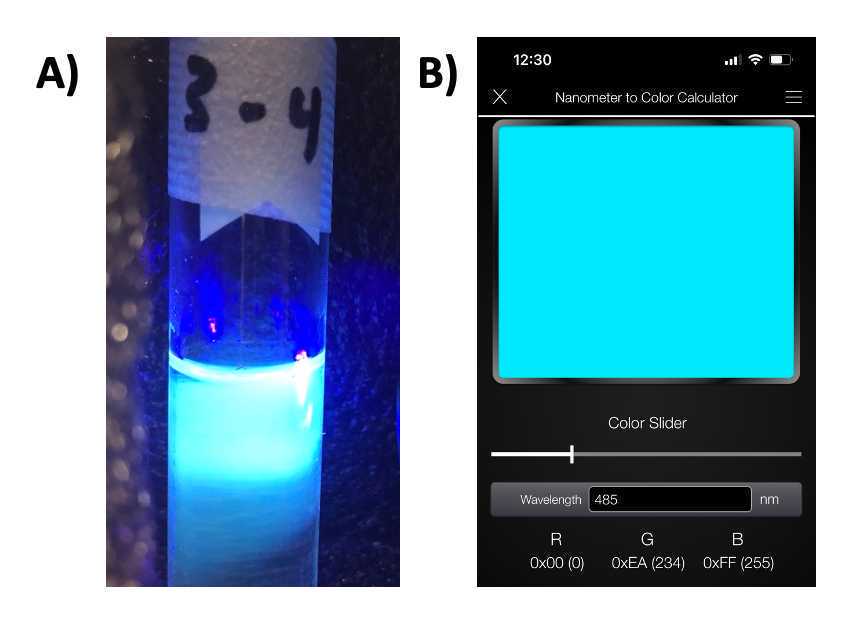
Figure 8. Reference comparison for UV pen fluorescence check of carbon dots. A) Photo of carbon dot solution in light box under 395nm excitation using UV pen. B) EE Toolkit used for analysis of emission signal. Based on visual observation, an emission peak of approximately 485 nm was detected using EE Toolkit (https://ee-toolkit.com/). This emission is represented by (0,234,255) in the RGB color space.
Quantitative analysis (fluorescence emission)
-
If available, use a spectroscopy instrument to analyze the emission spectra under UV excitation
-
Fig 9 shows a representative experiment with a 370nm excitation source (fiber optic spectrometer from Ocean Optics; Ocean HR2 UV-VIS)
-
The figure shows changing fluorescence emission during addition of a quenching molecule
-
Three peaks are identified (denoted as λm1, λm2, λm3), each with a different characteristic response to increasing concentration of the quencher molecule.
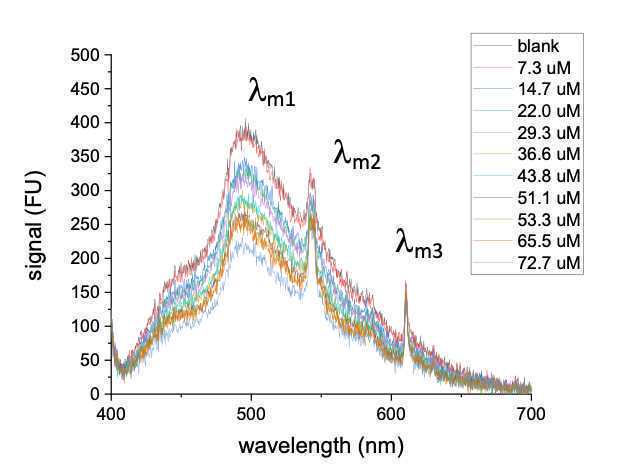
Figure 9. Representative UV-VIS emission under an excitation of 370nm using a fiber optic spectrometer. One broad peak and two distinct peaks are noted (denoted as λm3, λm2, λm3),. The curves represent characteristic response to increasing concentration of the quencher molecule. -
When analysis is complete, place LACD in dark for up to 2 weeks (shelf life currently unknown; 2 weeks is conservative estimate)
SECTION 5) Cleanup
Clean up space and dispose of waste
- Turn off Monowave and unplug it from power outlet
- Dispose of used chemicals according to the lab safety plan
- Wash all glass reactors with mild detergent and warm water. A bottle brush may be required to remove carbon residue from the inner wall of glass vials
- Carefully remove the Teflon lining from the cap and wash with mild detergent and warm water oIf the cap or the Teflon lining is damaged, they should be discarded according to the lab safety plan.
SECTION 6) Data management
Data management (reactor data only)
-
File naming : For saving all versions of this protocol, use the following file structure: LACD1.1_(insert date here).ai
-
File storage : Store all methods in the Desktop folder.
-
Backup files : At least once per year, ensure that the folder is backed up on the lab external hard drive.
-
Note: data management for spectroscopy data is covered in a separate protocol.

