Micro-CT acquisition and image processing to track and characterize pulmonary nodules in mice
May Zaw Thin, Axel Behrens, Christopher Moore, Thomas Snoeks, Tammy Kalber, Julian Downward
Extended
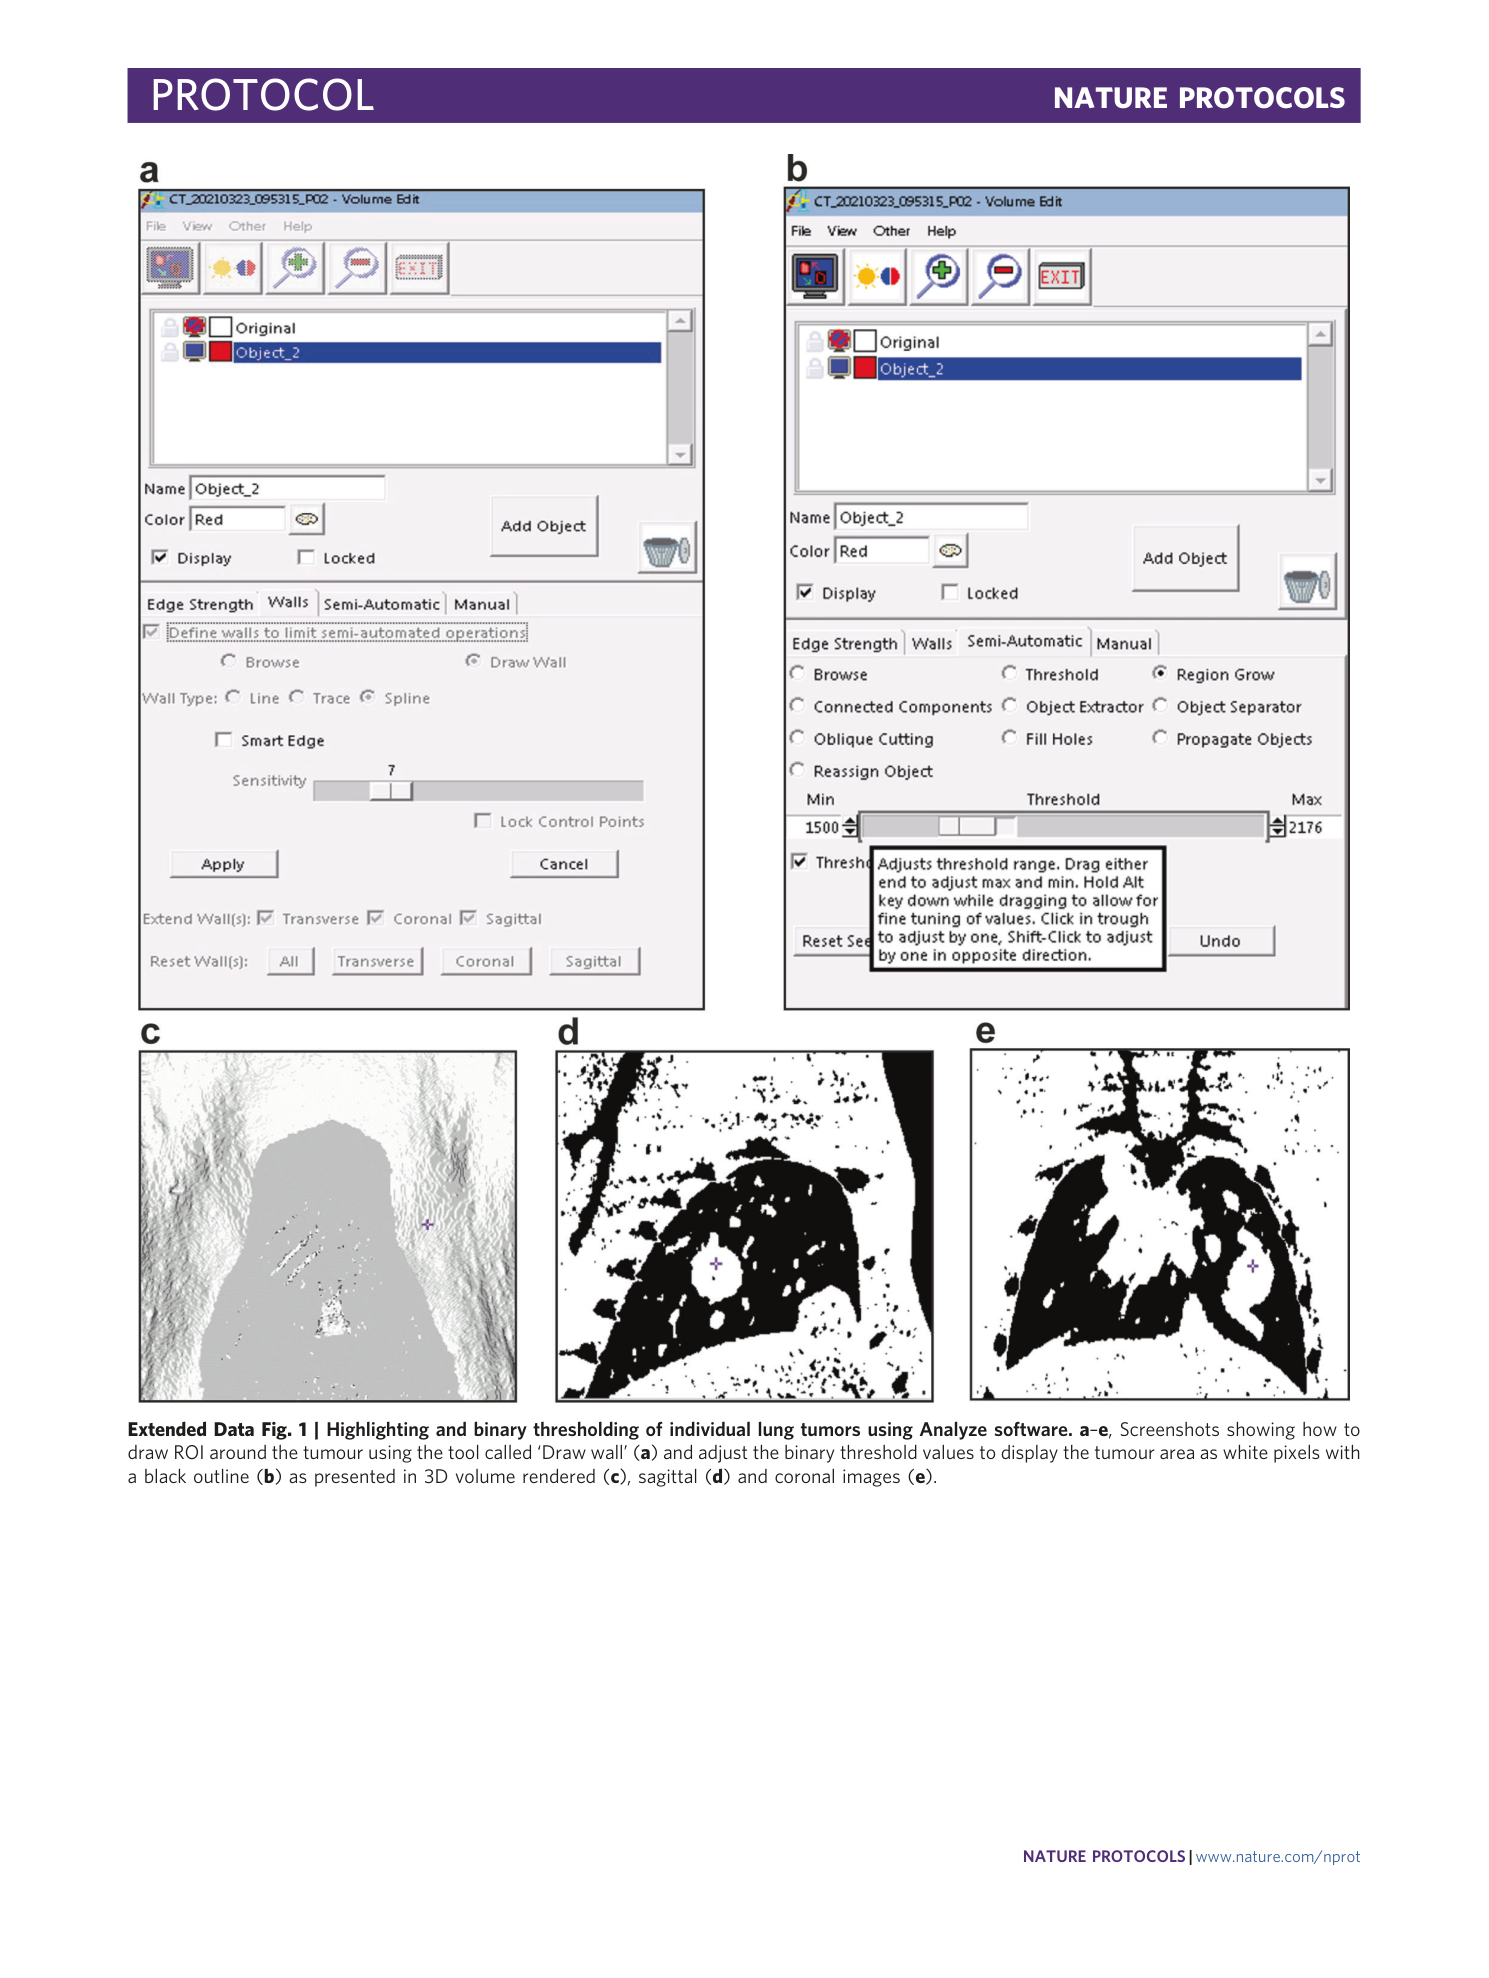
Extended Data Fig. 1 Highlighting and binary thresholding of individual lung tumors using Analyze software.
a – e , Screenshots showing how to draw ROI around the tumour using the tool called ‘Draw wall’ ( a ) and adjust the binary threshold values to display the tumour area as white pixels with a black outline ( b ) as presented in 3D volume rendered ( c ), sagittal ( d ) and coronal images ( e ).
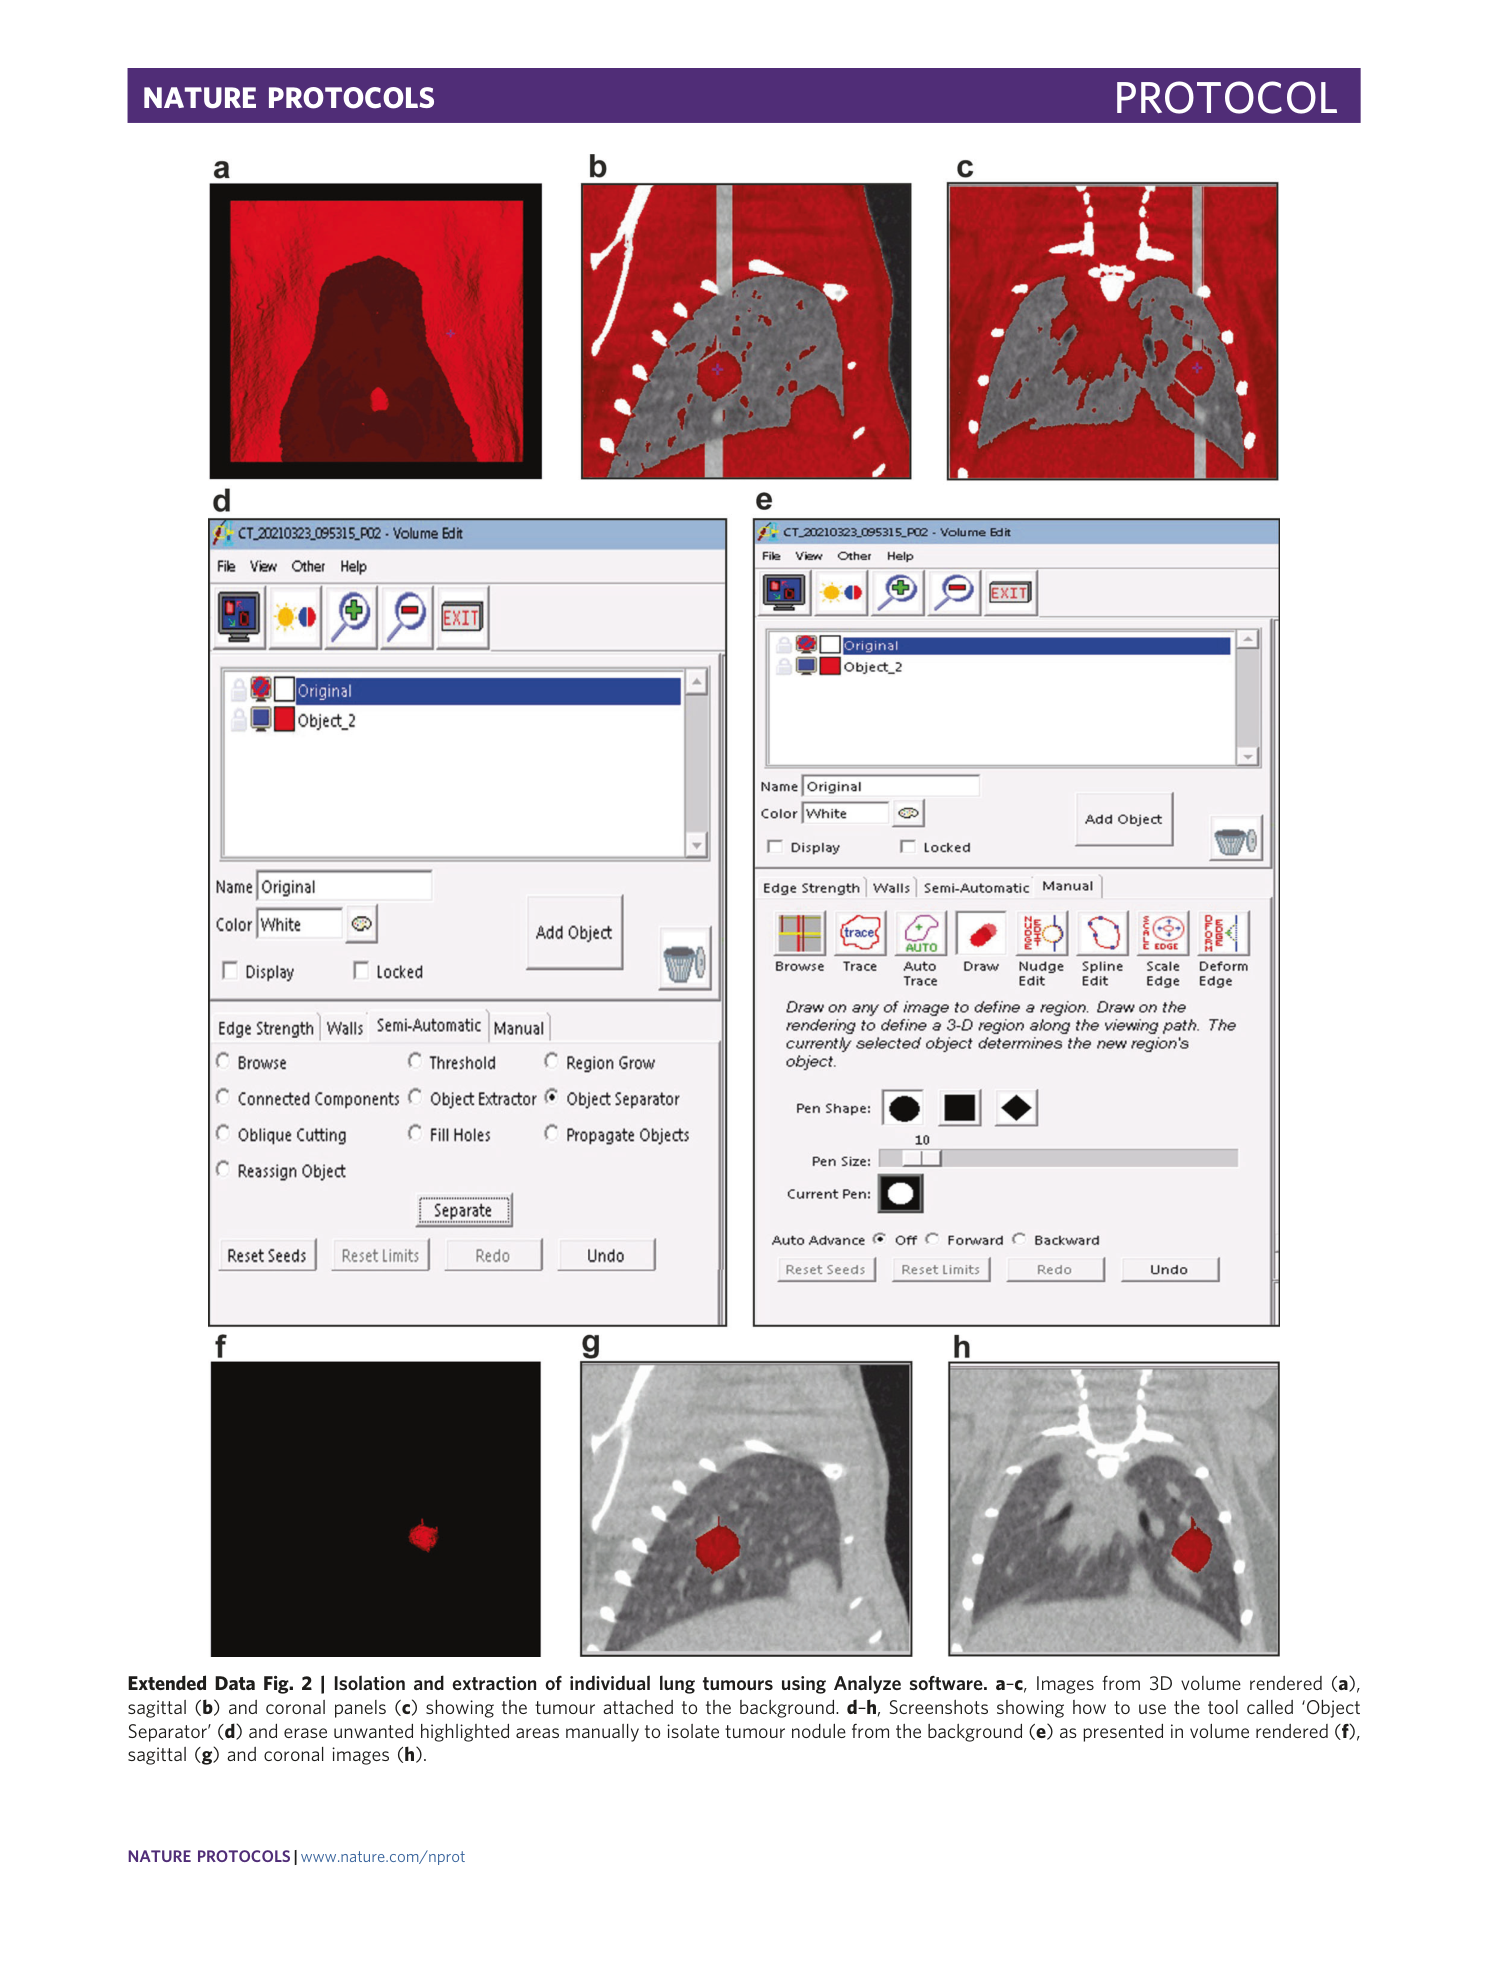
Extended Data Fig. 2 Isolation and extraction of individual lung tumours using Analyze software.
a – c , Images from 3D volume rendered ( a ), sagittal ( b ) and coronal panels ( c ) showing the tumour attached to the background. d – h , Screenshots showing how to use the tool called ‘Object Separator’ ( d ) and erase unwanted highlighted areas manually to isolate tumour nodule from the background ( e ) as presented in volume rendered ( f ), sagittal ( g ) and coronal images ( h ).
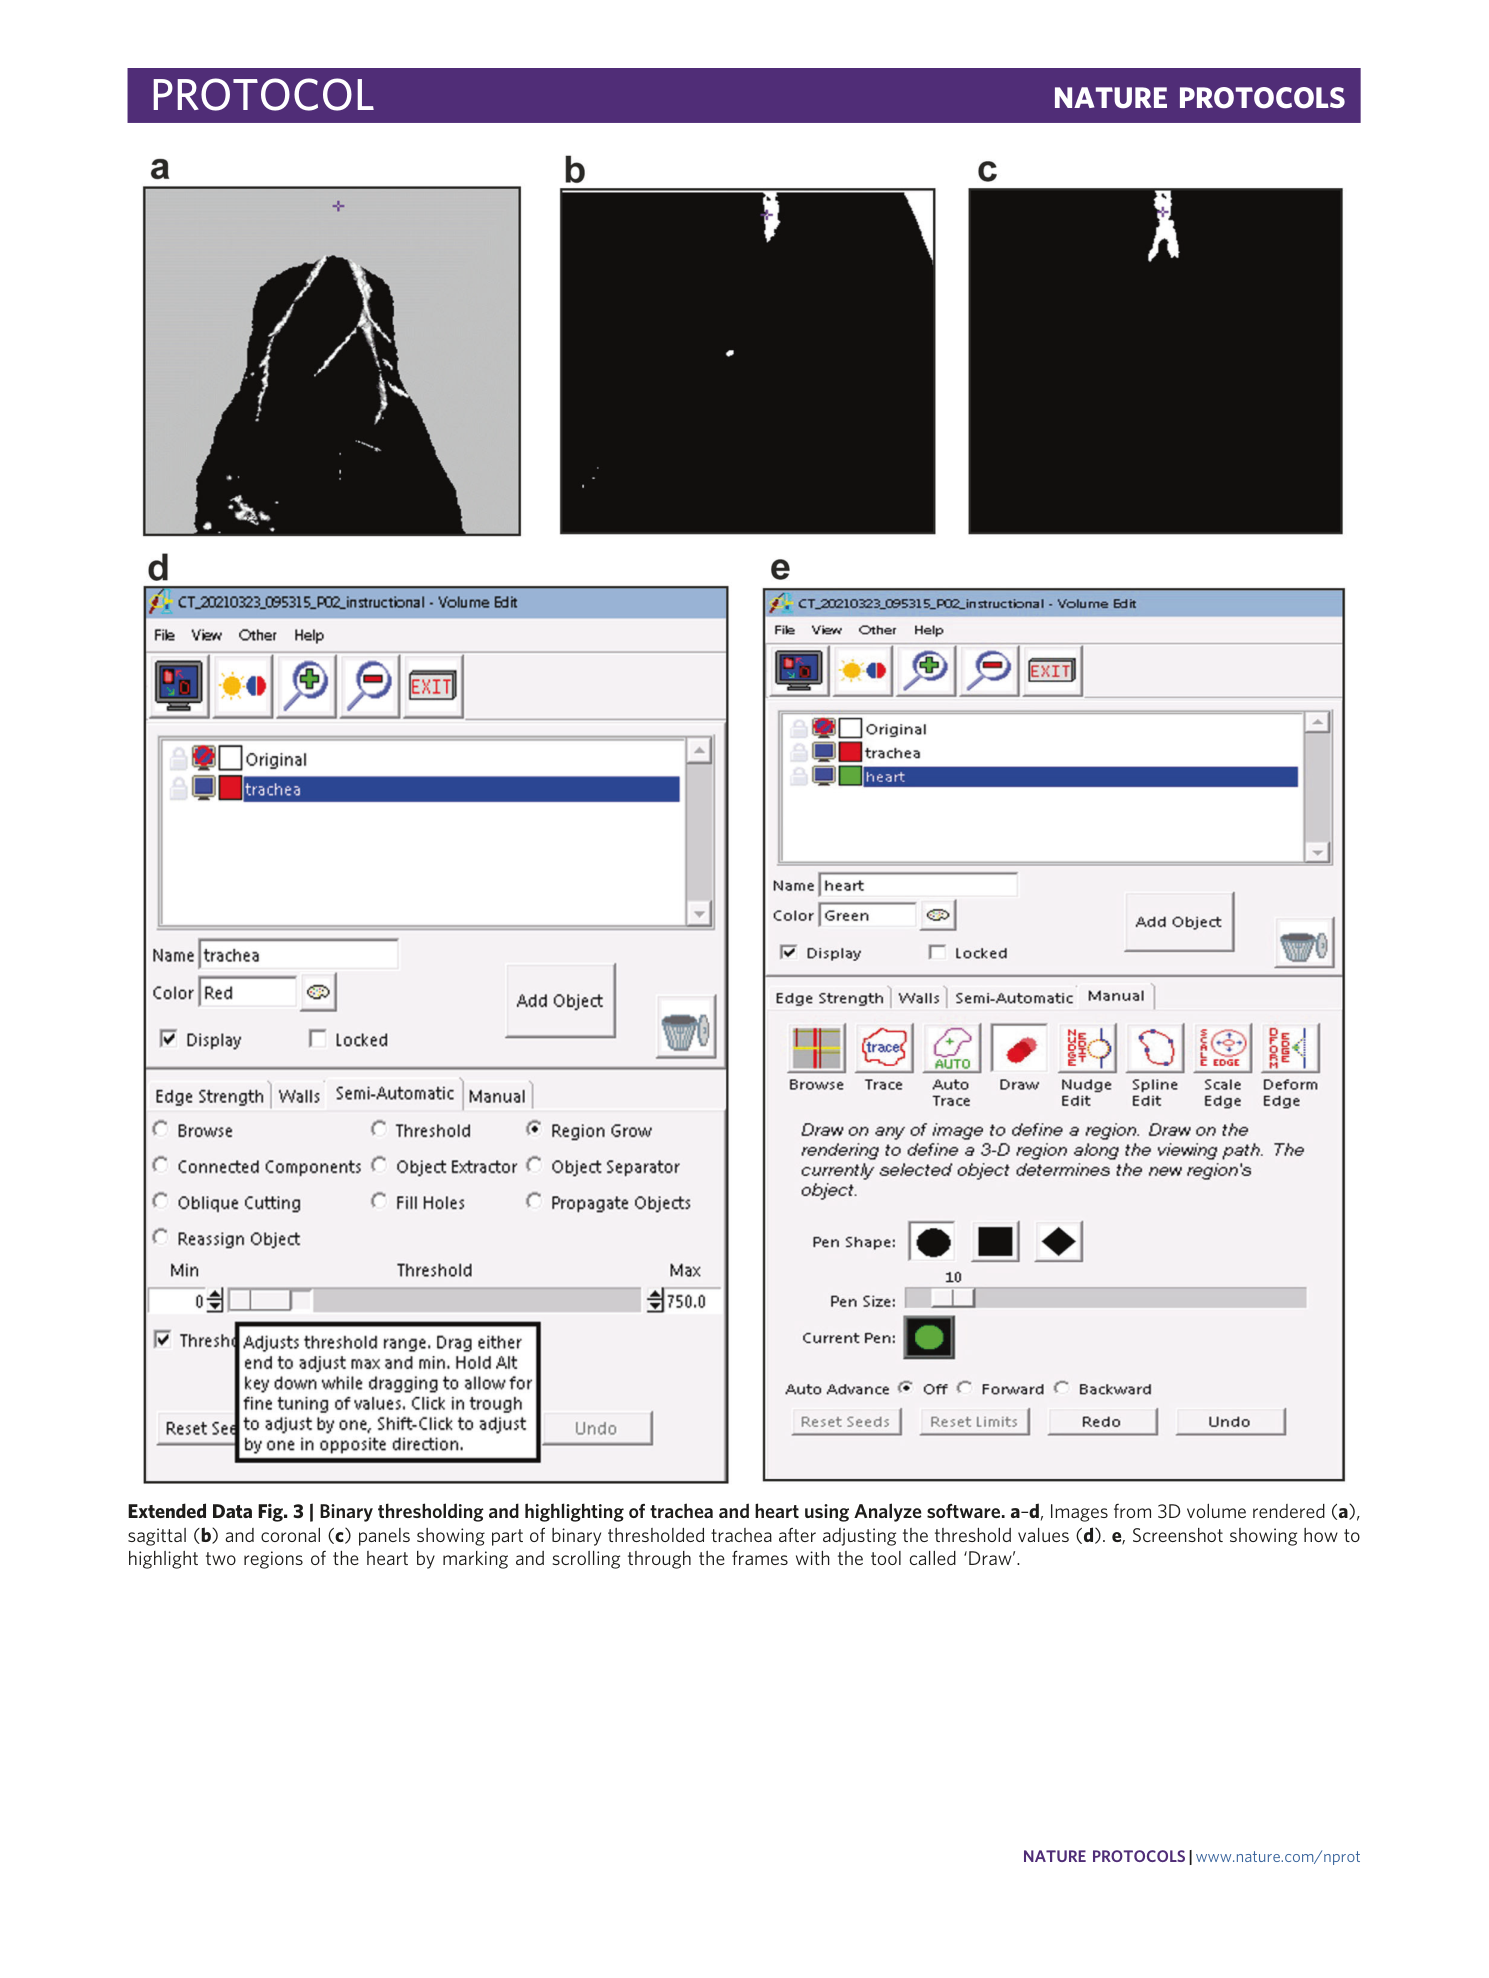
Extended Data Fig. 3 Binary thresholding and highlighting of trachea and heart using Analyze software.
a – d , Images from 3D volume rendered ( a ), sagittal ( b ) and coronal ( c ) panels showing part of binary thresholded trachea after adjusting the threshold values ( d ). e , Screenshot showing how to highlight two regions of the heart by marking and scrolling through the frames with the tool called ‘Draw’.
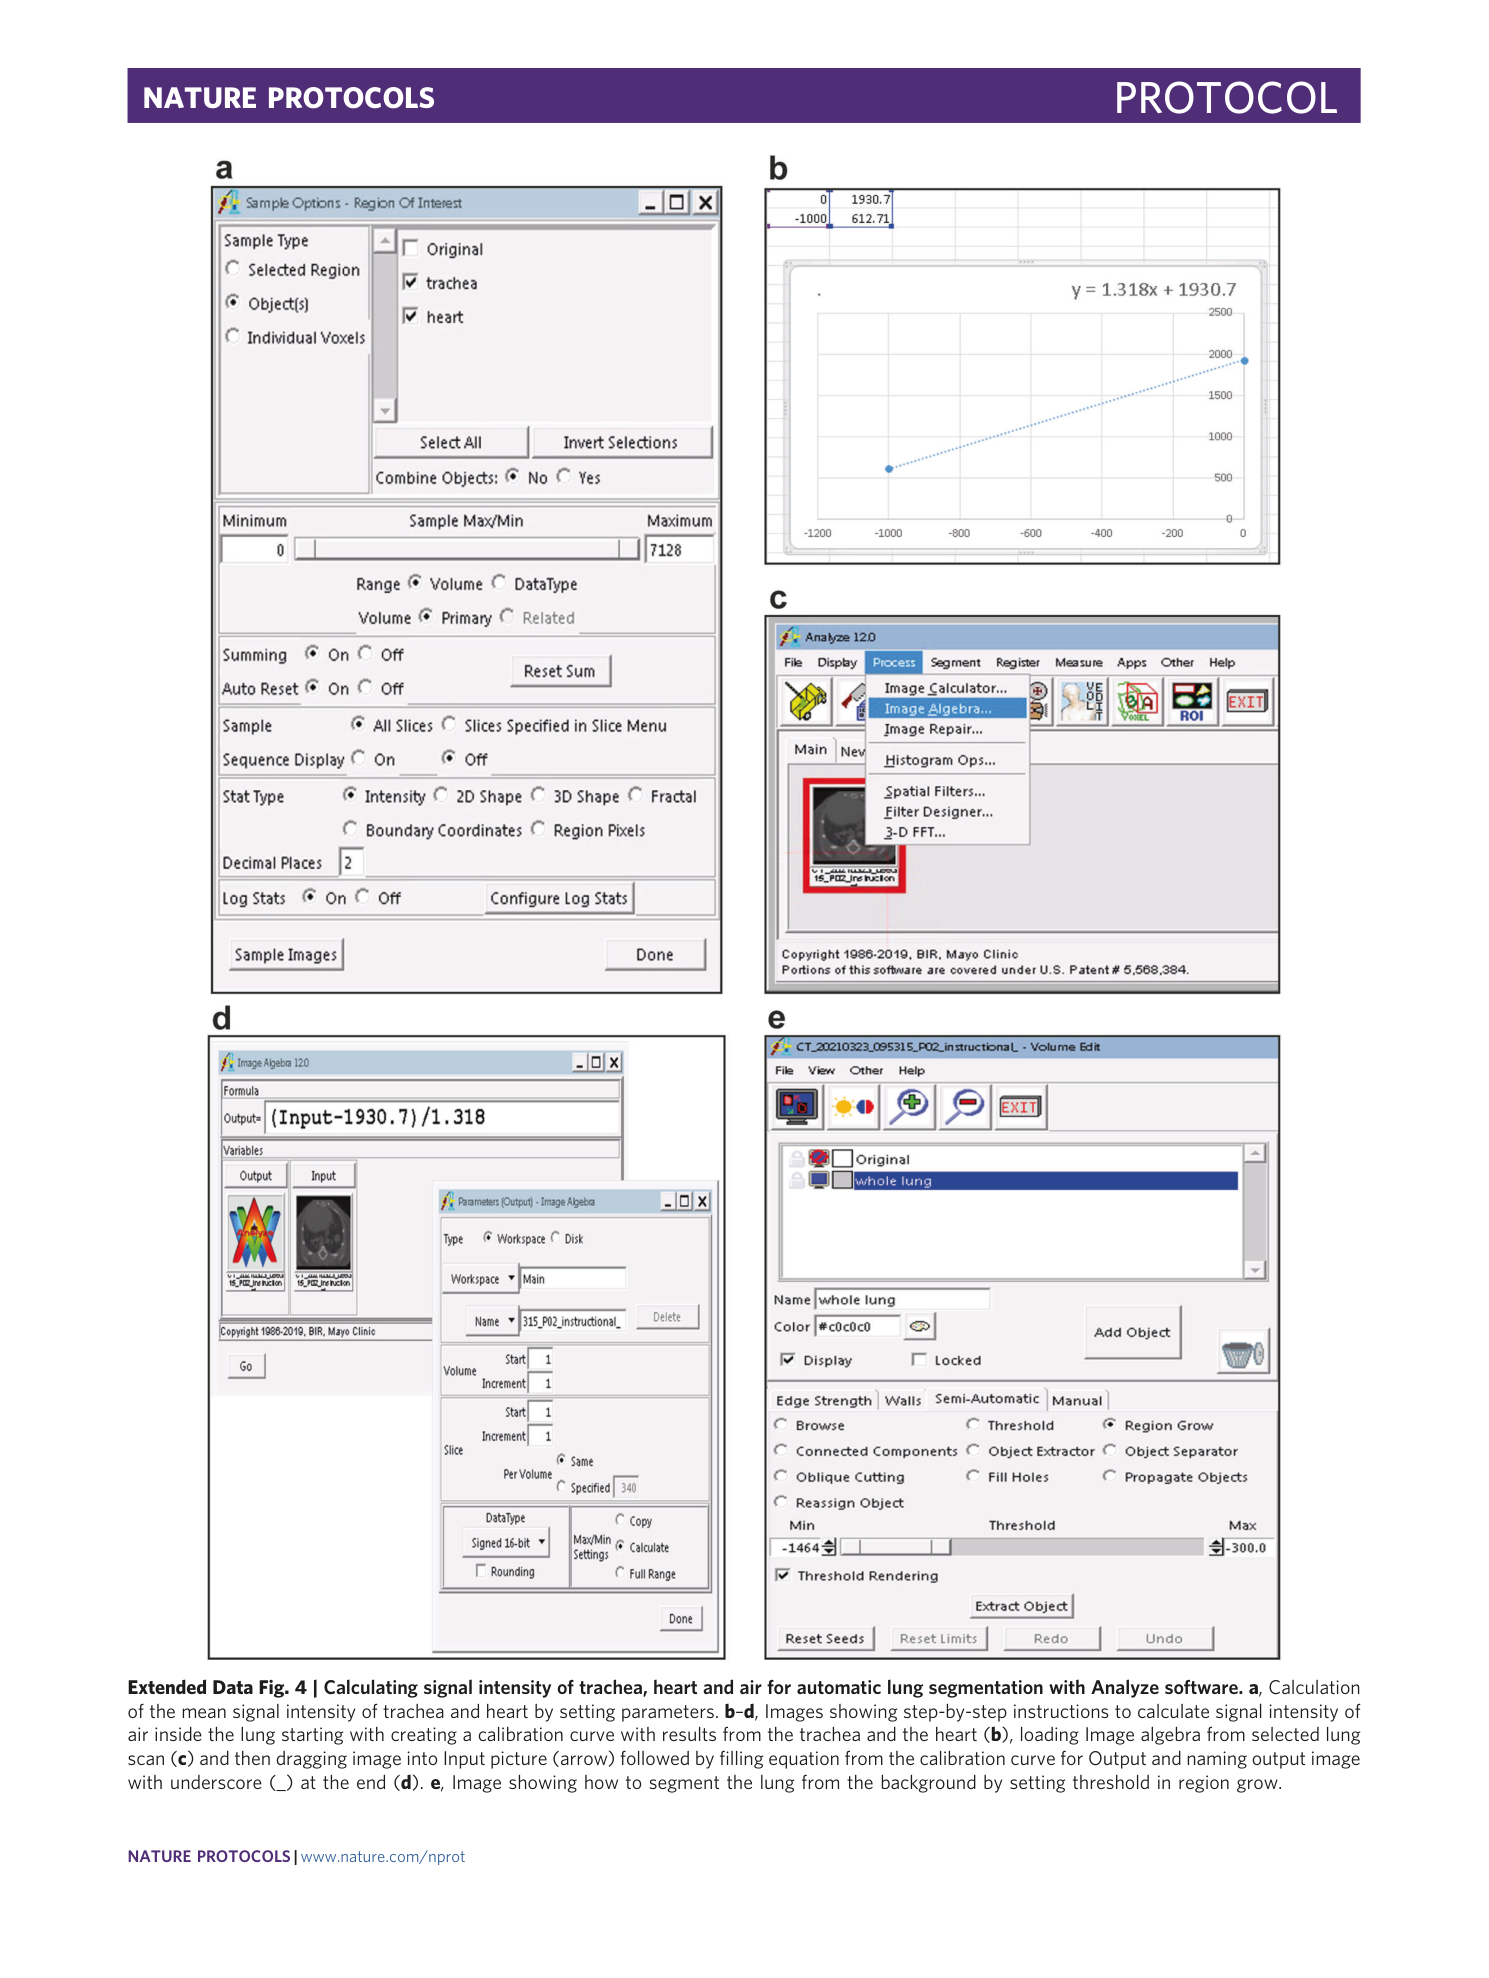
Extended Data Fig. 4 Calculating signal intensity of trachea, heart and air for automatic lung segmentation with Analyze software.
a , Calculation of the mean signal intensity of trachea and heart by setting parameters. b – d , Images showing step-by-step instructions to calculate signal intensity of air inside the lung starting with creating a calibration curve with results from the trachea and the heart ( b ), loading Image algebra from selected lung scan ( c ) and then dragging image into Input picture (arrow) followed by filling equation from the calibration curve for Output and naming output image with underscore (_) at the end ( d ). e , Image showing how to segment the lung from the background by setting threshold in region grow.
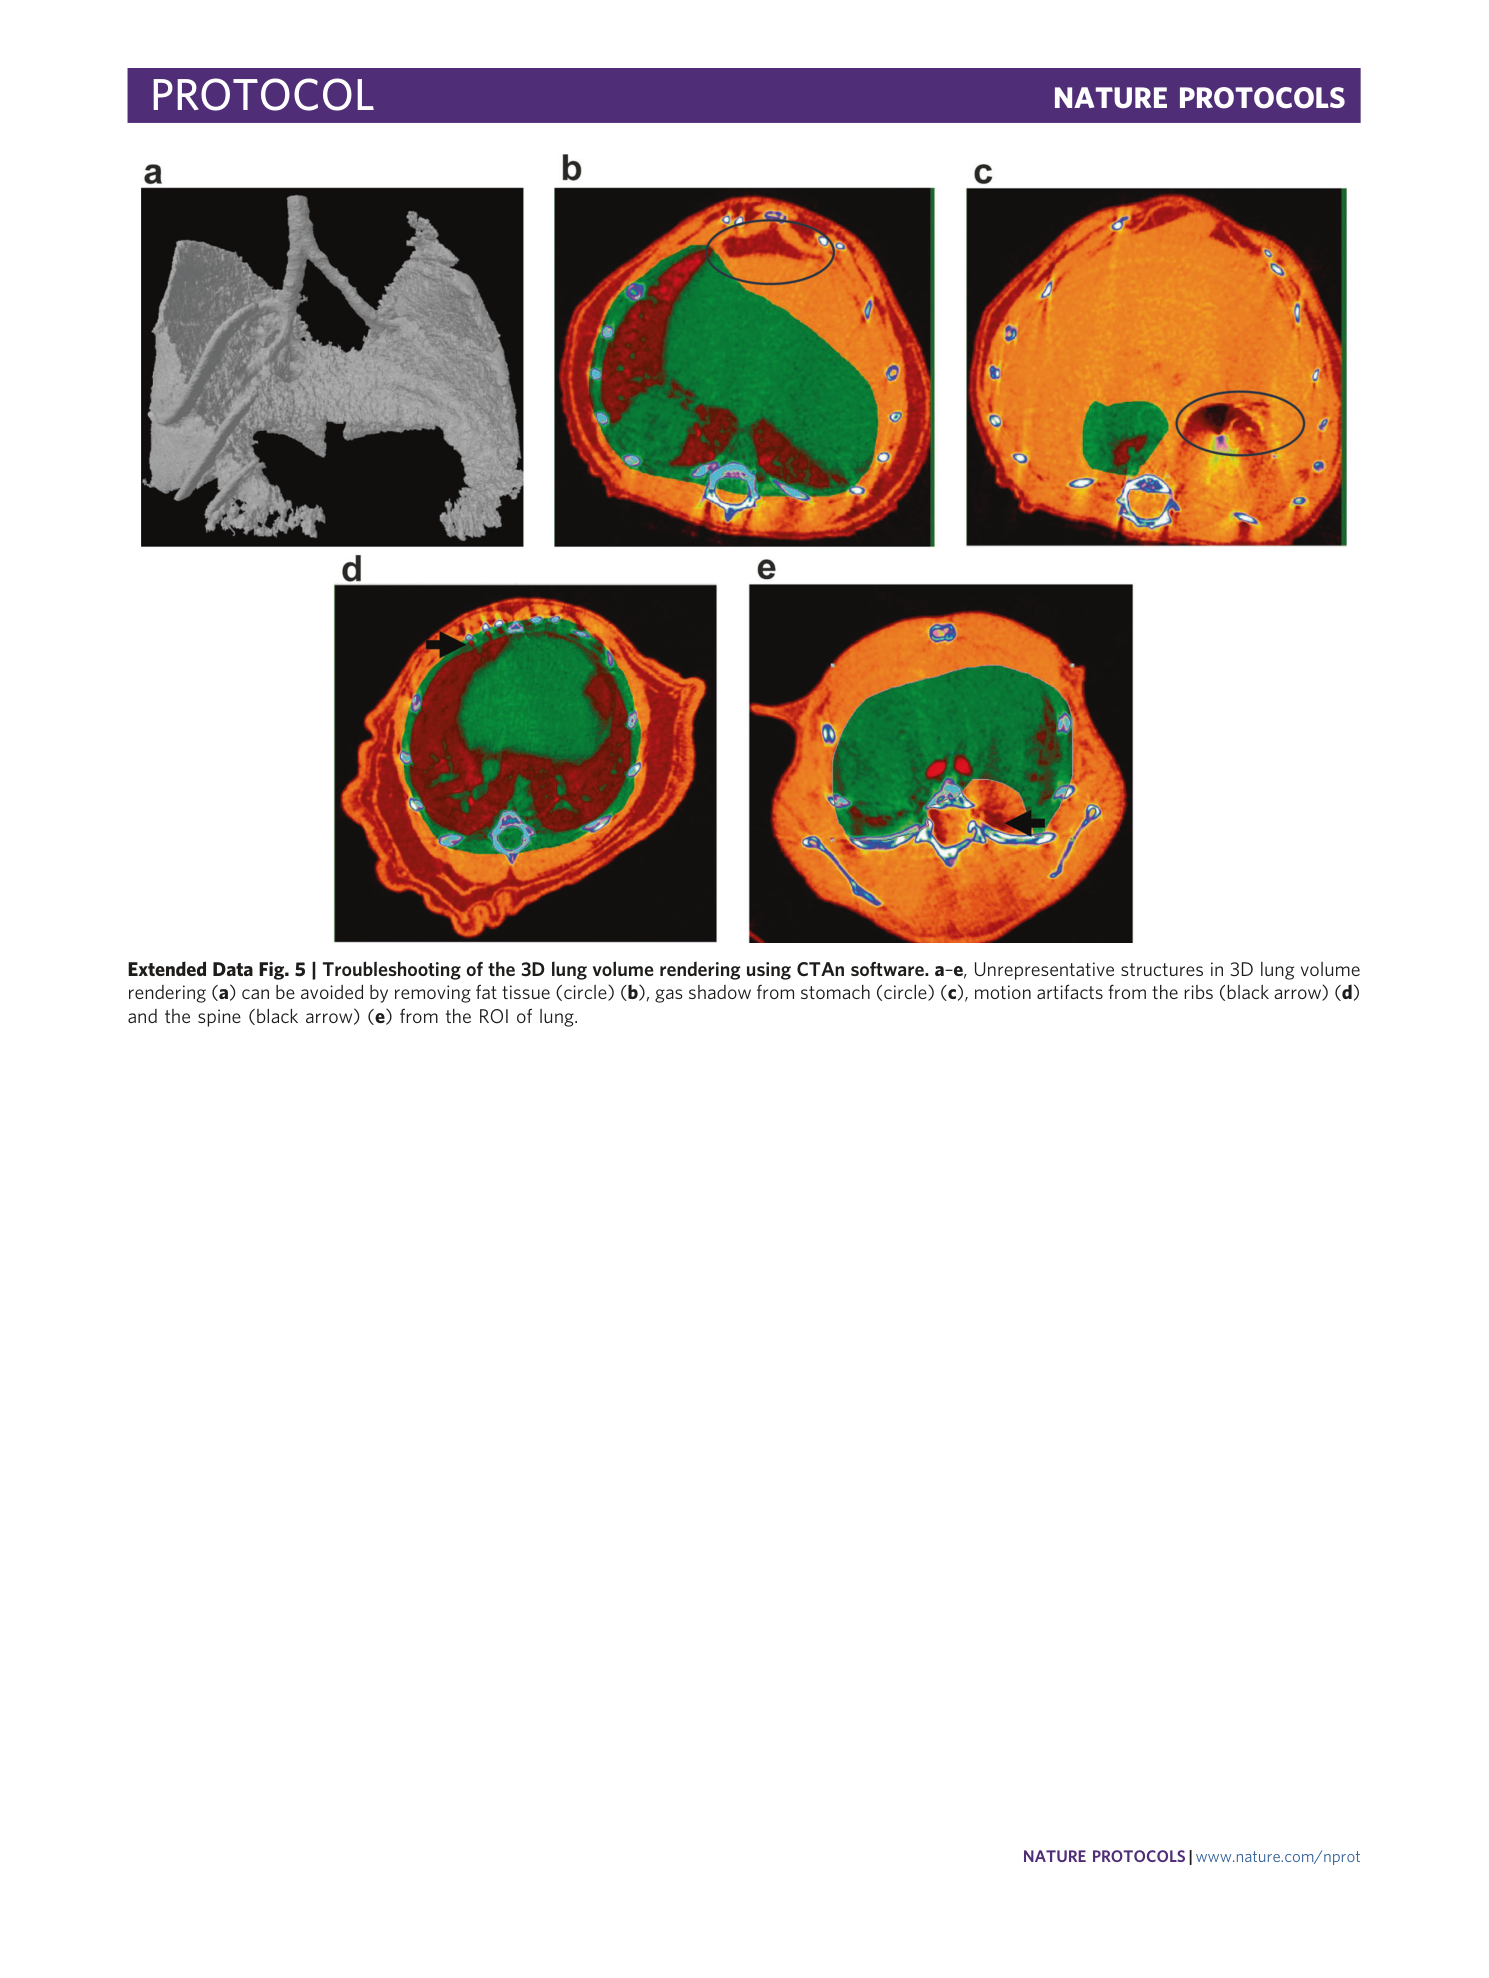
Extended Data Fig. 5 Troubleshooting of the 3D lung volume rendering using CTAn software.
a – e , Unrepresentative structures in 3D lung volume rendering ( a ) can be avoided by removing fat tissue (circle) ( b ), gas shadow from stomach (circle) ( c ), motion artifacts from the ribs (black arrow) ( d ) and the spine (black arrow) ( e ) from the ROI of lung.
