Measuring photophysiological traits of diatoms from Rapid Light Curves using a Water-PAM
Phoebe Argyle, Jana Hinners, Nathan G. Walworth, Naomi M. Levine, Martina A. Doblin, Sinead Collins
Abstract
This is a brief protocol for how to measure ETRmax, alpha (α) and Ik for microalgae cultures using the Rapid Light Curve protocol included in the WinControl software used with a Walz Water-PAM instrument.
Based on the protocol developed in:
Ralph, P.J., Gademann, R., 2005. Rapid light curves: a powerful tool to assess photosynthetic activity. Aquat. Bot. 82(3), 222-237.
This method was used in:
Argyle, P. A., Walworth, N. G., Hinners, J., Collins, S., Levine, N. M., & Doblin, M. A. (2021). Multivariate trait analysis reveals diatom plasticity constrained to a reduced set of biological axes. ISME Communications , 1 (1), 59.
Argyle, P. A., Hinners, J., Walworth, N. G., Collins, S., Levine, N. M., & Doblin, M. A. (2021). A high-throughput assay for quantifying phenotypic traits of microalgae. Frontiers in microbiology , 12 , 706235.
Steps
Prepare culture
Take a 2mL aliquot of microalgae culture into a glass cuvette compatible with the WATER-PAM instrument.
When the overall culture volume is limited (i.e. <2 mL of culture available for the measurement), take 0.5-1mL and dilute with sterile seawater to a final volume of 2mL.
Notes:
The optimal volume for the WATER-PAM is 2-3mL .
Make measurements
Set up the WATER-PAM according to the manufacturer's instructions.
Equipment
| Value | Label |
|---|---|
| Water-PAM | NAME |
| PAM fluorometer | TYPE |
| WALZ | BRAND |
| WATER-PAM-II | SKU |
Initiate a Rapid Light Curve by clicking Program > Light Curve in WinControl.
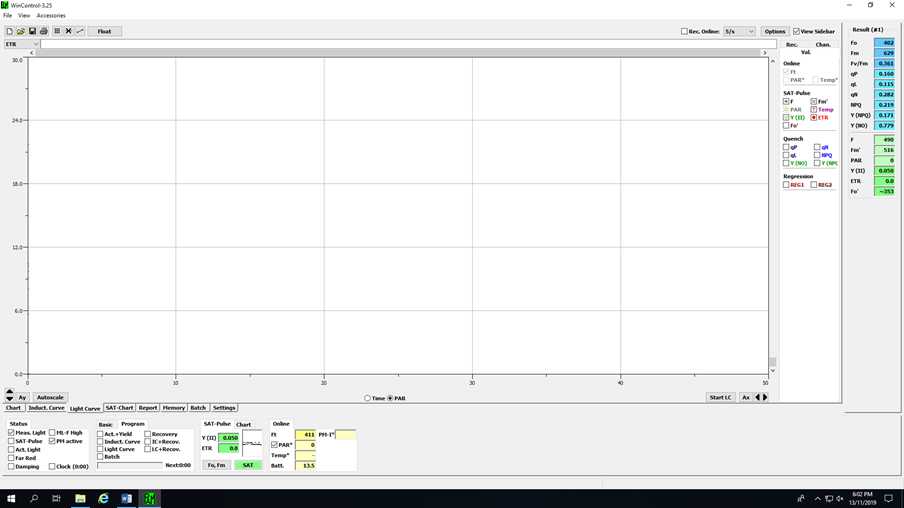
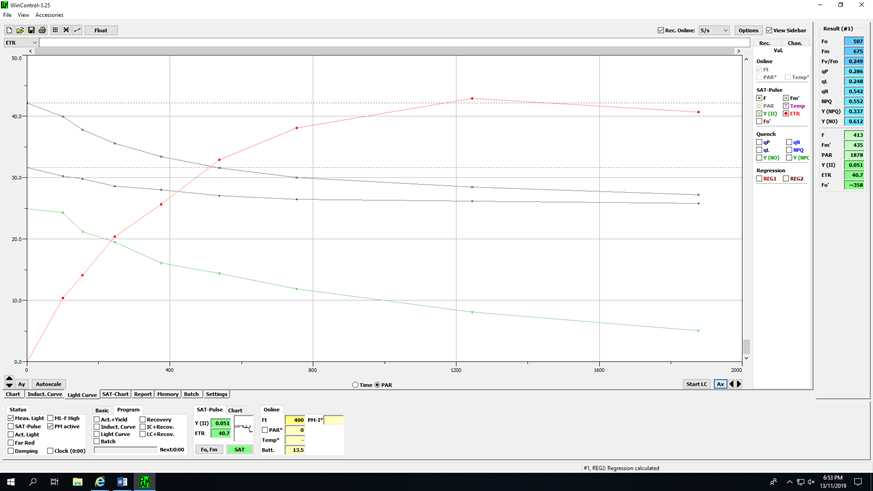
To achieve a successful RLC, there should be at least 3 points on the rise, multiple points to estimate the ETRmax, and at least one point on the decline at the highest irradiance (see instrument manual).
If the curve does not achieve these criteria, this may require optimization of the instrument settings such as the gain and irradiance steps.
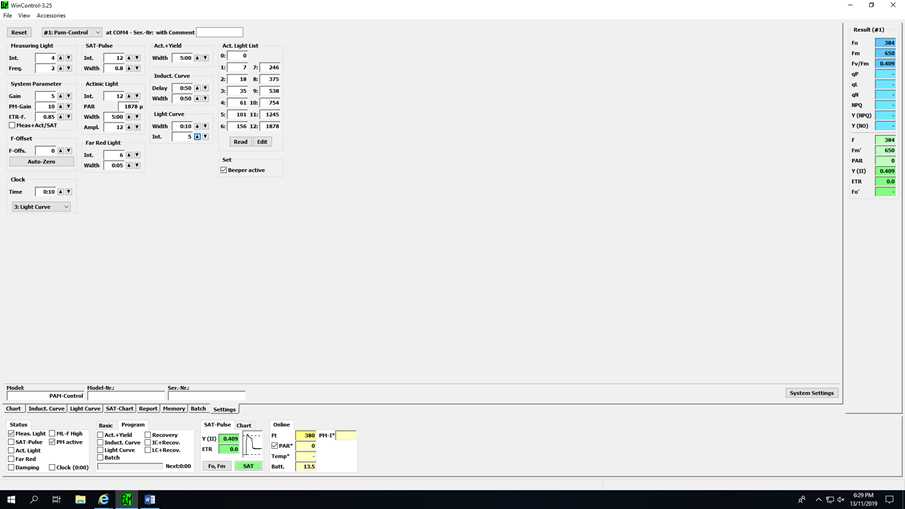
Modify the Light Curve Intensity (LI) to change the first irrandiance step of the curve, keeping in mind there will always be 8 steps to the curve.
Gain settings should be adjusted by the user, if Fo or Fm exceeds the maximum value (>4000) then reduce the gain, or dilute the sample.
NB: Do not adjust the gain settings in between samples as this renders the data incomparable.
The curve width is usually set to 10 seconds.
NB: If comparing different cultures, it is important to conduct all measurements within a similar time window based on the photoperiod. I.e. within a 1-2 hour window 2 hours after the onset of light.
