Lagash Archaeological Survey and Recording System (LASRS) - Importing ArcGIS Field Maps Data to QGIS
Paul C. Zimmerman
Abstract
This protocol describes how data collected with ArcGIS Field Maps, using forms generated according to the Rectangular Survey Grid Creation with QGIS and Creating Collection Forms with ArcGIS Field Maps protocols, can be imported into QGIS and combined with tabular data of the collected artifacts (such as counts and weights) for further analyses such as the creation of heat maps.
Steps
Export the Targets Shapefile from ArcGIS Field Maps
Log into your ArcGIS Online account with the web browser of your choice.
Click on Content in the page header, navigate to where your Targets shapefile is stored, and click on its name.
Click the Download button on the right to download a zip file which will contain the components of the Targets shapefile.
Locate the Archive.zip file on your computer (probably in the Downloads folder) and rename it to Targets.zip .
Export Observations Recorded with ArcGIS Field Maps
Click on Content in the page header, navigate to where your Observations feature layer is stored, and click on its name.
On the right, choose Export Data > Export to CSV File , then click the Export button.
When the export file is created the page will refresh. Click the Download button on the right to download a zip file which will contain the data in the Samples and Notes layers.
Locate the zip file on your computer (probably in the Downloads folder) and expand it. The expanded folder should have two CSV files within it: Notes_1.csv and Samples_0.csv .
Import the Targets Shapefile into QGIS
Launch QGIS and open a project or create a new one. Make sure that the project CRS indicated in the lower right corner of the QGIS window shows the correct EPSG code.
In QGIS select Layer > Add Layer > Add Vector Layer…
Click the three dots button to the right of the Vector Dataset(s) field, locate the Targets.zip file, and click the Add button.
Find the Targets — Survey Grid.shp layer on the left, and rename it to Targets .
Import the Observations CSV into QGIS
in QGIS select Layer > Add Layer > Add Delimited Text Layer…
Click the three dots button to the right of the File name field and locate the Samples_0.csv file.
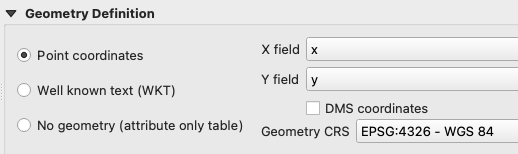
If necessary, expand the Geometry Definition panel. Make sure that Point coordinates is selected and that the X and Y fields are mapped properly. Change the Geometry CRS to EPSG:4326 - WGS 84 , then click the Add button.
Import the Collections and Measurements CSV into QGIS
Processing of the collections should result in well-formed tabular data that can be exported as a CSV. Each line in the CSV should have the data from a single Positive sample. One column in the table must have the target name, spelled exactly as the nodes are in the Targets layer, and each subsequent column must contain one discrete measurement.
The method by which collections can be processed is beyond this protocol. For LAP, we used a bespoke data collection form using Wildnote that prompted for counts and weights of certain classes of objects (e.g., counts and weights of simple pottery sherds and ceramic slag pieces). If the stability of your internet connection is sufficient, then a similar form can be generated with Google Forms. Direct entry into a spreadsheet or database is also possible, but the end result must be a well-formed table as described above. Note, however, that only Positive samples need to be recorded in the CSV file; Negatives and Write-Offs can be omitted.
in QGIS select Layer > Add Layer > Add Delimited Text Layer…
Click the three dots button to the right of the File name field and locate the CSV file with the processed collections.
In the Geometry Definition panel select No geometry (attribute only table) . In the Sample Data panel, verify that the data type for each column is correct, then click the Add button.
Find the newly-added geometry-less layer on the left and rename it to Collections_0 .
Join the Layers into a New Layer with All the Survey Data
If the QGIS Processing Toolbox isn’t visible, show it by selecting View > Panels > Processing Toolbox .
In the Search field of the Processing Toolbox, type join and double-click Join attributes by nearest .
In the Join attributes by nearest window, set Input layer to Samples_0 and Input layer 2 to Targets , then click the Run button.
Rename the newly-created layer to Joined layer_0 .
In the Processing Toolbox, double-click Join attributes by field value .
In the Join attributes by field value window, set Input layer to Joined Layer_0 and Table field to node . Set Input layer 2 to Collections_0 and Table field to target (or whatever the node name field is), then click the Run button.
Right-click on the newly-created Joined layer (not Joined layer_0 ) and select Export > Save Features As…
In the Save Vector Layer as… window set Format to GeoPackage . Click the three dots button next to the File name field and choose where you want to save the new file with the name Samples . Change the Layer name to Raw Measurements . Set the CRS to the project CRS, and then click the OK button.
Remove the Samples_0 , Collections_0 , Joined layer_0 , and Joined layer layers, then save your QGIS project.
Style the Samples — Raw Measurements Layer
Download the following QGIS style file: Samples Style.qml
Double-click the Samples — Raw Measurements layer to open its properties window.
Click the Style button at the bottom of the Layer Properties window and select Load Style…
Click the three dots button to the right of the File field and select the styles file downloaded in step 30 , then click the Load Style button.
Click the OK button to apply the style and close the Layer Properties window.
Next Steps
The result of the above steps is a map showing the status of each target’s collection with differently colored dots. It also preserves the location of each sample, as recorded in ArcGIS Field Maps, and the measurements for each collection as attributes of each point. The data from those attributes can be used as weights for creating contours or heat maps in QGIS. New attributes, created formulaically from the existing data can be created and also used as the basis for such visualizations. However, if modifications will be made to the data, it is recommended that you do so to copies of the Samples — Raw Measurements file (created via export), rather than to the source file.
