Image Analysis to Quantify Coral Bleaching Using Greyscale Model
Rowan Mclachlan, Andrea G Grottoli
Abstract
This protocol outlines a method of quantitatively measuring the degree of bleaching of a coral colony non-destructively in the field using image analysis. Previous studies have shown that mean intensity grey (MIG), also known as percent whiteness, is highly correlated with chlorophyll a and Symbiodiniaceae density (Chow et al. 2016, Amid et al. 2018), and therefore can be used to quantify the bleaching intensity of a coral colony. Color analysis can be done using digital photographs of live coral colonies either in situ (e.g., Maguire et al. 2003) or ex-situ in the lab (Amid et al. 2018; this protocol). Photographs must be taken prior to any preservation or processing of tissue, such as freezing, use of preservatives or fixatives, airbrushing etc., to ensure no alteration of the original coral color occurs. In this protocol, corals are photographed in front of a white reference standard and the resulting color images are subsequently converted to 8-bit greyscale and analyzed.
There are two steps to this protocol:
-
Photographing live coral fragments
-
Image analysis of mean grey value
This protocol was written by Dr. Rowan McLachlan and was reviewed by Dr. Andréa Grottoli.
Acknowledgments
I would like to thank Dr. Eugene Katrukha for kindly taking the time to teach me this method, and providing me feedback on how to produce higher quality images for analysis.
Steps
Photographing live coral fragments
For detailed instructions on how to photograph coral fragments, please refer to Section 1 of our published protocol: Geometric Method for Estimating Coral Surface Area Using Image Analysis ( dx.doi.org/10.17504/protocols.io.bpxcmpiw) dx.doi.org/10.17504/protocols.io.bpxcmpiw)
Additional notes:
- Use diffused lighting when photographing corals to minimize harsh shadows or glare from the wet tissue surface as these will preclude accurate color image analysis. For more information on how to diffuse light, check out this wikiHow.
- It is essential that the coral colony and the reference card receive the same uniform illumination/light field.
- If possible, coral colonies should be imaged from multiple angles in order to get a good representation of bleaching degree and colony color.
Image analysis of mean grey value
Download ImageJ. ImageJ can be downloaded for free from the NIH website: https://imagej.nih.gov/ij/download.html.
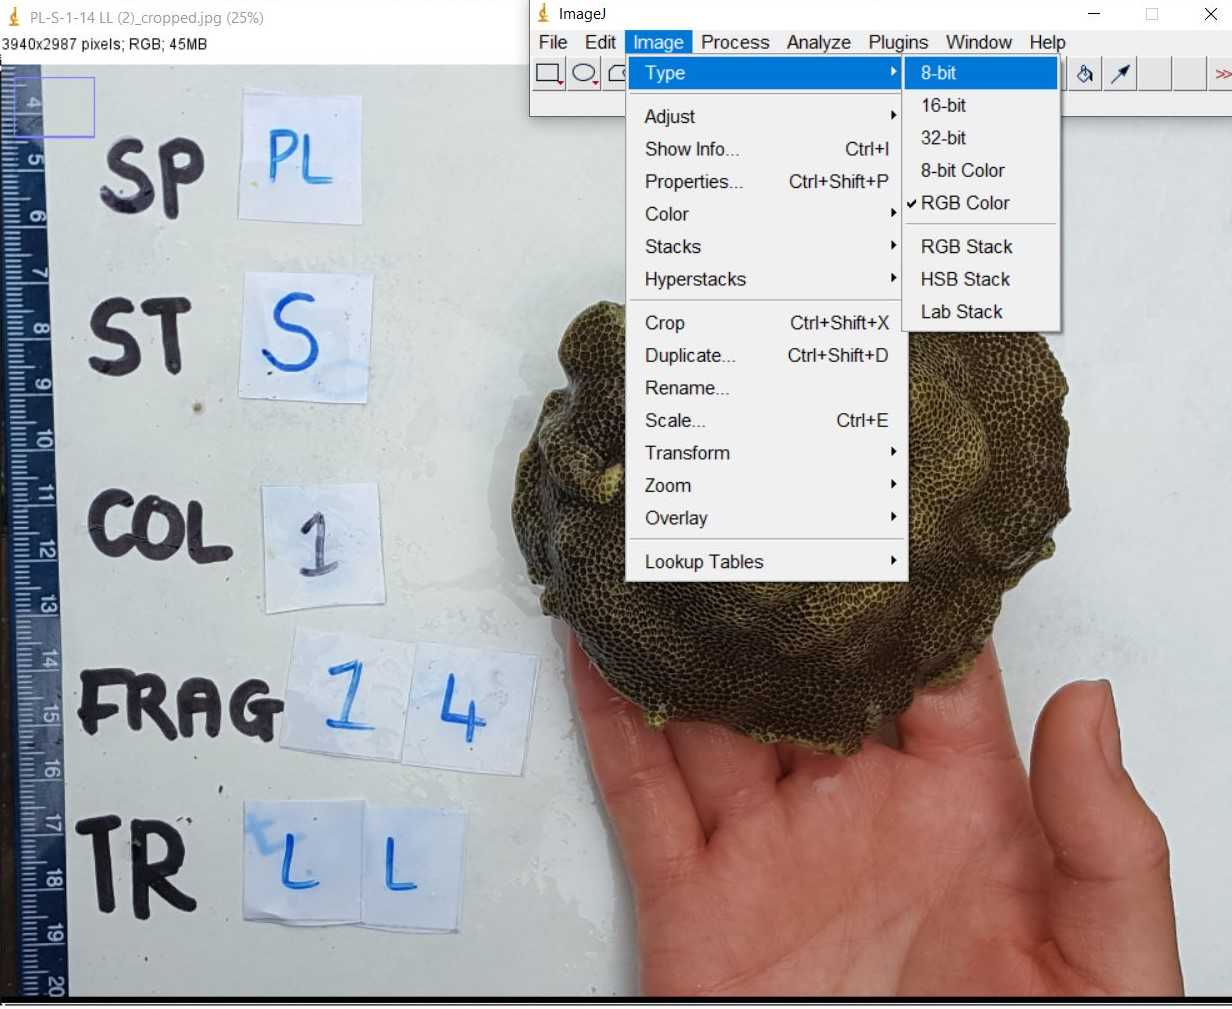
Import the first photograph of either the top (Fig. 1A) or the side (Fig. 1B) of the coral into the ImageJ software.

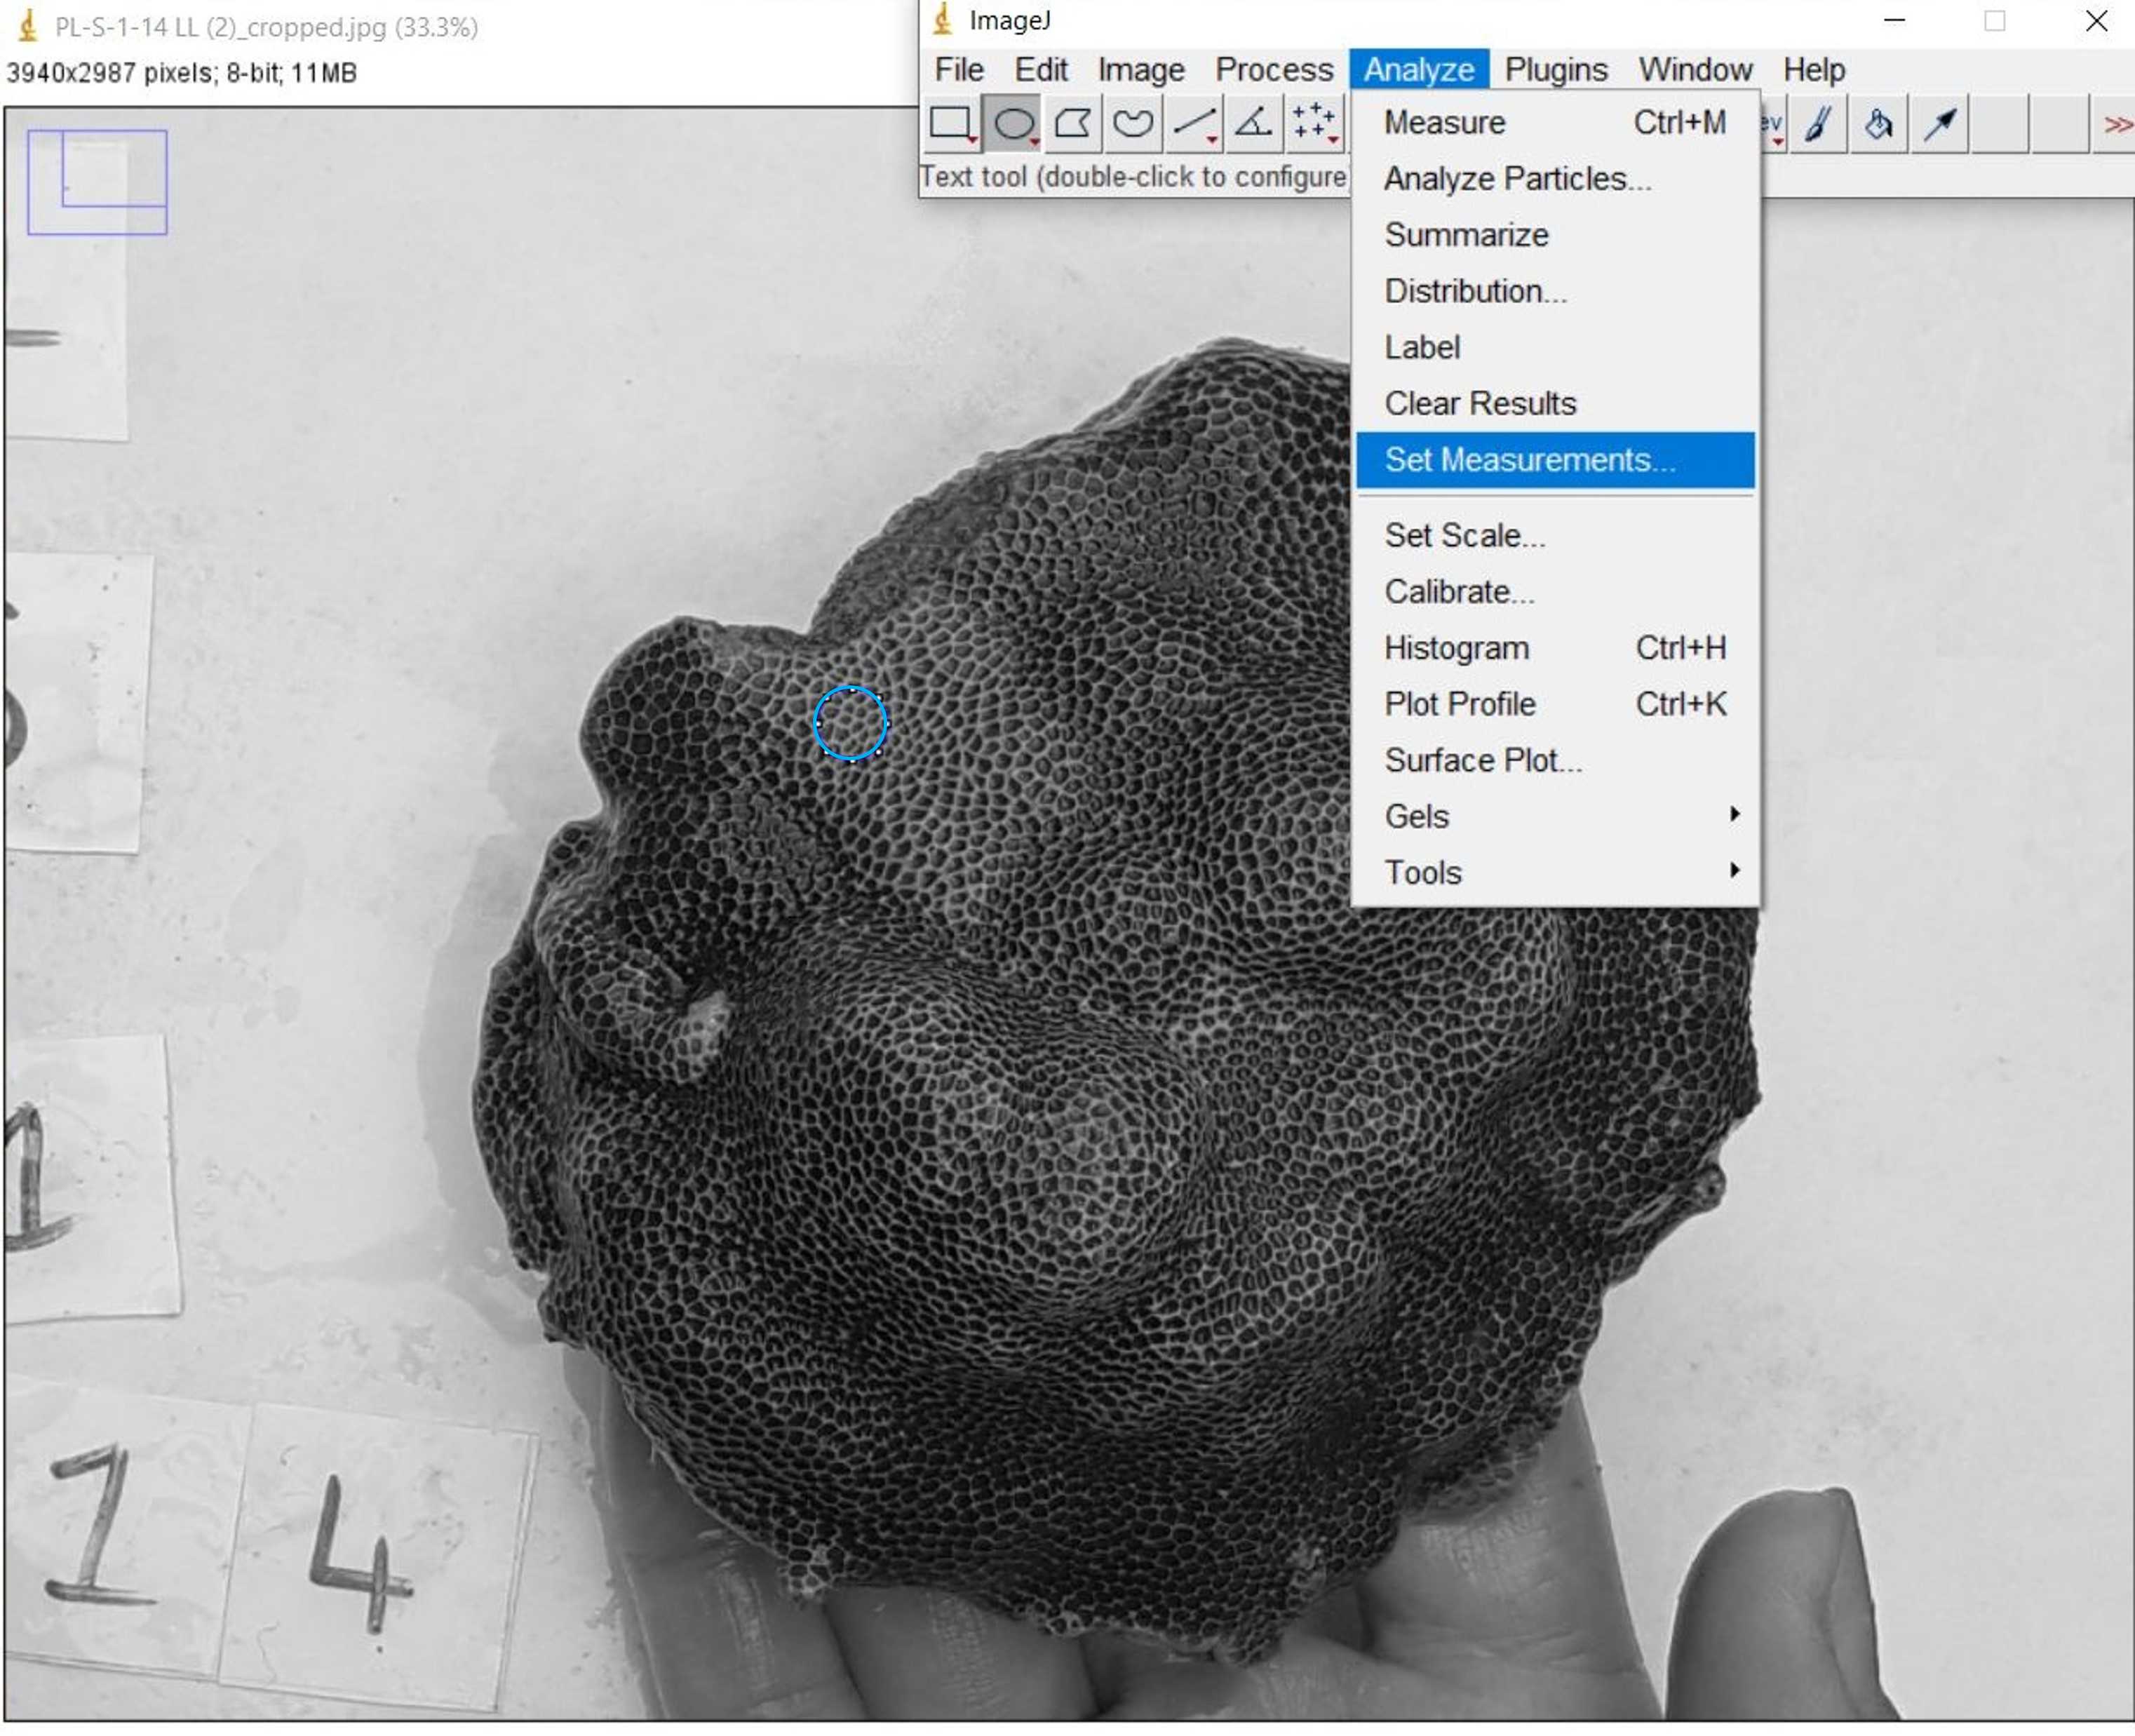
Using the hand tool and the zoom function (zoom shortcuts: Ctrl and + on PC keyboard, or left-click and scroll on PC mouse), zoom in and adjust the position of the image such that the coral fragment takes up all of the ImageJ window (Fig. 3). Select the "Oval" tool from the toolbar (second button from the left). Draw a circle on the image (small blue circle shown in Fig. 3). Take care to avoid regions of the coral that are in a shadow or reflecting light due to glare from wet tissue.
<img src="https://static.yanyin.tech/literature_test/protocol_io_true/protocols.io.bx8wprxe/Capture4_new.jpg" alt="Fig. 3. 8-bit greyscale image of Porites lobata colony. Notice a small blue circle has been dawn near the upper left hand side using the "Oval" button tool." loading="lazy" title="Fig. 3. 8-bit greyscale image of Porites lobata colony. Notice a small blue circle has been dawn near the upper left hand side using the "Oval" button tool."/>
Select the box next to "Mean grey value" (Fig. 5.)
<img src="https://static.yanyin.tech/literature_test/protocol_io_true/protocols.io.bx8wprxe/Capture6_new.jpg" alt="Fig. 5. ImageJ Set Measurements window. Make sure to select "Mean Grey Value"" loading="lazy" title="Fig. 5. ImageJ Set Measurements window. Make sure to select "Mean Grey Value""/>
Next, navigate to the toolbar, press "Analyze" followed by "Measure" [keyboard shortcut is Ctrl + M] (Fig. 6). This will bring up a Results window of the X and Y coordinates mean grey value for the region selected within the blue circle (Fig. 6).
<img src="https://static.yanyin.tech/literature_test/protocol_io_true/protocols.io.bx8wprxe/Capture8_new.jpg" alt="Fig. 6. ImageJ Results window showing "Mean Grey Value" of 96.783 for the first blue circle region." loading="lazy" title="Fig. 6. ImageJ Results window showing "Mean Grey Value" of 96.783 for the first blue circle region."/>
Next, draw a new circle somewhere different on the coral surface (Fig. 7). Again make sure to avoid areas with shadows and/or glare. Measure this new area (Fig. 7).
<img src="https://static.yanyin.tech/literature_test/protocol_io_true/protocols.io.bx8wprxe/Capture9_new.jpg" alt="Fig. 7. ImageJ Results window showing "Mean Grey Value" of 81.241 for the second blue circle region." loading="lazy" title="Fig. 7. ImageJ Results window showing "Mean Grey Value" of 81.241 for the second blue circle region."/>
Repeat the previous step until 5 different coral circle areas have been measured. Then draw a circle on the white standard (paper background in this example) (Fig. 8). Make sure the size of the circle drawn is similar in size to the previously drawn coral circles. Ensure you avoid areas of the white standard which have shadows, glare, or dirt specks.
<img src="https://static.yanyin.tech/literature_test/protocol_io_true/protocols.io.bx8wprxe/edy37bqe15.jpg" alt="Fig. 8. ImageJ Results window showing "Mean Grey Value" of for five coral areas (i.e., values 96.783 to 60.178) and one reference area (219.203)." loading="lazy" title="Fig. 8. ImageJ Results window showing "Mean Grey Value" of for five coral areas (i.e., values 96.783 to 60.178) and one reference area (219.203)."/>
Repeat the previous steps, and measure five new coral areas, and one new reference standard area (Fig. 9). Make sure to always draw circles in new areas (i.e., do not accidentally measure the grey value of the same coral polyps twice).
<img src="https://static.yanyin.tech/literature_test/protocol_io_true/protocols.io.bx8wprxe/edy77bqe8.jpg" alt="Fig. 9. ImageJ Results window showing "Mean Grey Value" of for five new coral areas (i.e., values 46.620 to 76.592) and one reference area (219.041)." loading="lazy" title="Fig. 9. ImageJ Results window showing "Mean Grey Value" of for five new coral areas (i.e., values 46.620 to 76.592) and one reference area (219.041)."/>
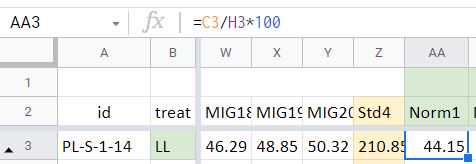
Normalize the coral Mean Grey Values to the white reference standard Mean Grey Values using the equation shown in Fig. 12. Normalize the following coral values to the following white reference standard values:
- coral circles #1 – #5 normalize to White Std1
- coral circles #6 – #10 normalize to White Std2
- coral circles #11 – #15 normalize to White Std3
- coral circles #16 – #20 normalize to White Std4

For an example of how to set up your spreadsheet, see attachment. Example spreadsheet.xlsx
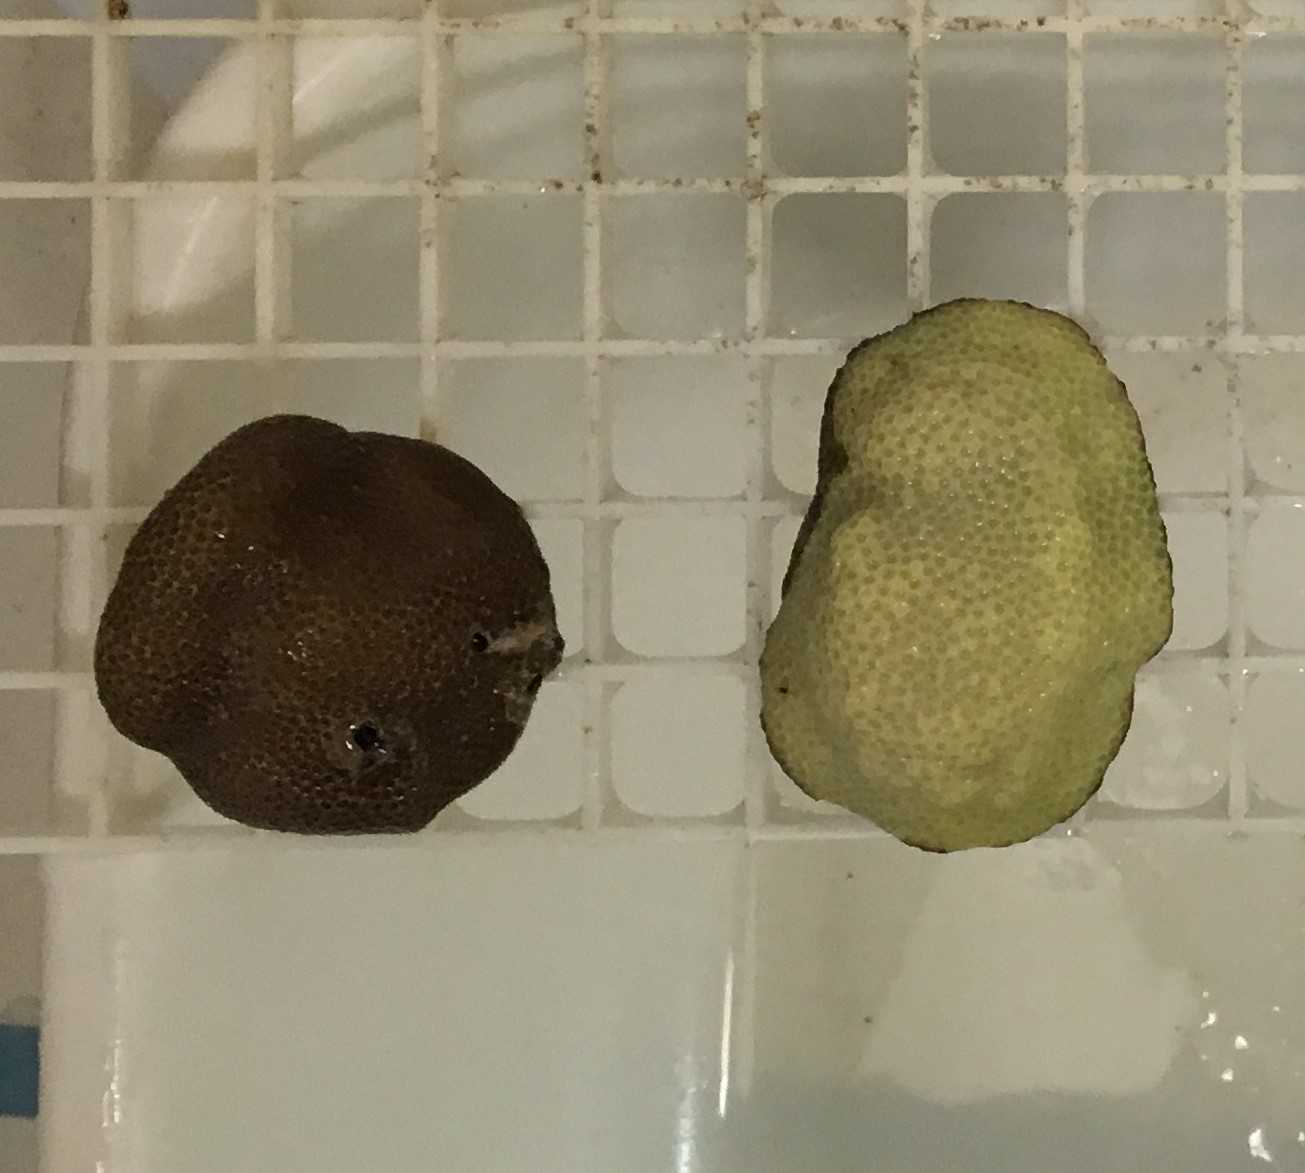
This method is particularly useful when comparing experimental control and treatment corals colonies, photographed at similar times, using the same lighting (Fig. 14).


