How to Measure the Illumination Overhead (IO) of a Fluorescence Microscope
Claire M Brown, Cesar Leonardo Villa, Alexander Kiepas, kmichiel, Alexander Nowakowski, alexander.kiepas
Disclaimer
DISCLAIMER – FOR INFORMATIONAL PURPOSES ONLY; USE AT YOUR OWN RISK
The protocol content here is for informational purposes only and does not constitute legal, medical, clinical, or safety advice, or otherwise; content added to protocols.io is not peer reviewed and may not have undergone a formal approval of any kind. Information presented in this protocol should not substitute for independent professional judgment, advice, diagnosis, or treatment. Any action you take or refrain from taking using or relying upon the information presented here is strictly at your own risk. You agree that neither the Company nor any of the authors, contributors, administrators, or anyone else associated with protocols.io, can be held responsible for your use of the information contained in or linked to this protocol or any of our Sites/Apps and Services.
Abstract
This protocol outlines in detail how to measure illumination overhead (IO) and collect raw illumination intensity data using the Rigol ds1054z oscilloscope. In fluorescence microscopy, IO is defined as the time a sample is illuminated without the emitted light being captured by the camera, resulting in unnecessary photobleaching and phototoxicity. Minimizing IO is critical for all live imaging experiments.
IO occurs due to delays/errors in the synchronization between the microscope fluorescence excitation light source, exposure of the sample to excitation light and the camera exposure time for capturing emitted fluorescence light. The amount of IO varies greatly across setups due to software settings, physical hardware and how components are connected and triggered by the hardware and/or software. Thus, it is recommended that each individual measure the IO of their own microscope and experimental setup including for their exact image acquisition settings.
More details use of this protocol and the need to measure IO can be found in Kiepas et. al. JCS, 2020 (https://pubmed.ncbi.nlm.nih.gov/31988150/) and Kiepas et. al. Microscopy Today, 2020 (https://www.cambridge.org/core/journals/microscopy-today/article/microscope-hardware-and-software-delays-cause-phototoxicity/B964736E4617AEC17C8B1BBD8B4F37B8)
Before start
This protocol uses the Rigolna ds1054z oscilloscope (https://www.rigolna.com/products/digital-oscilloscopes/1000z/#ds1000Z/ds1054z/). To collect the raw data, ensure that the oscilloscope's drivers are installed. One may download them from the website "https://www.rigolna.com/products/digital-oscilloscopes/1000z/". Under the "downloads" tab, navigate to the "software" section and download both the "UltraScope Remote Interface and Control SW" and the "UltraSigma Instrument Connectivity Driver." Remember to extract the zip files and run the installers.
Steps
Measuring IO Using the Rigol DS1054Z Oscilloscope.
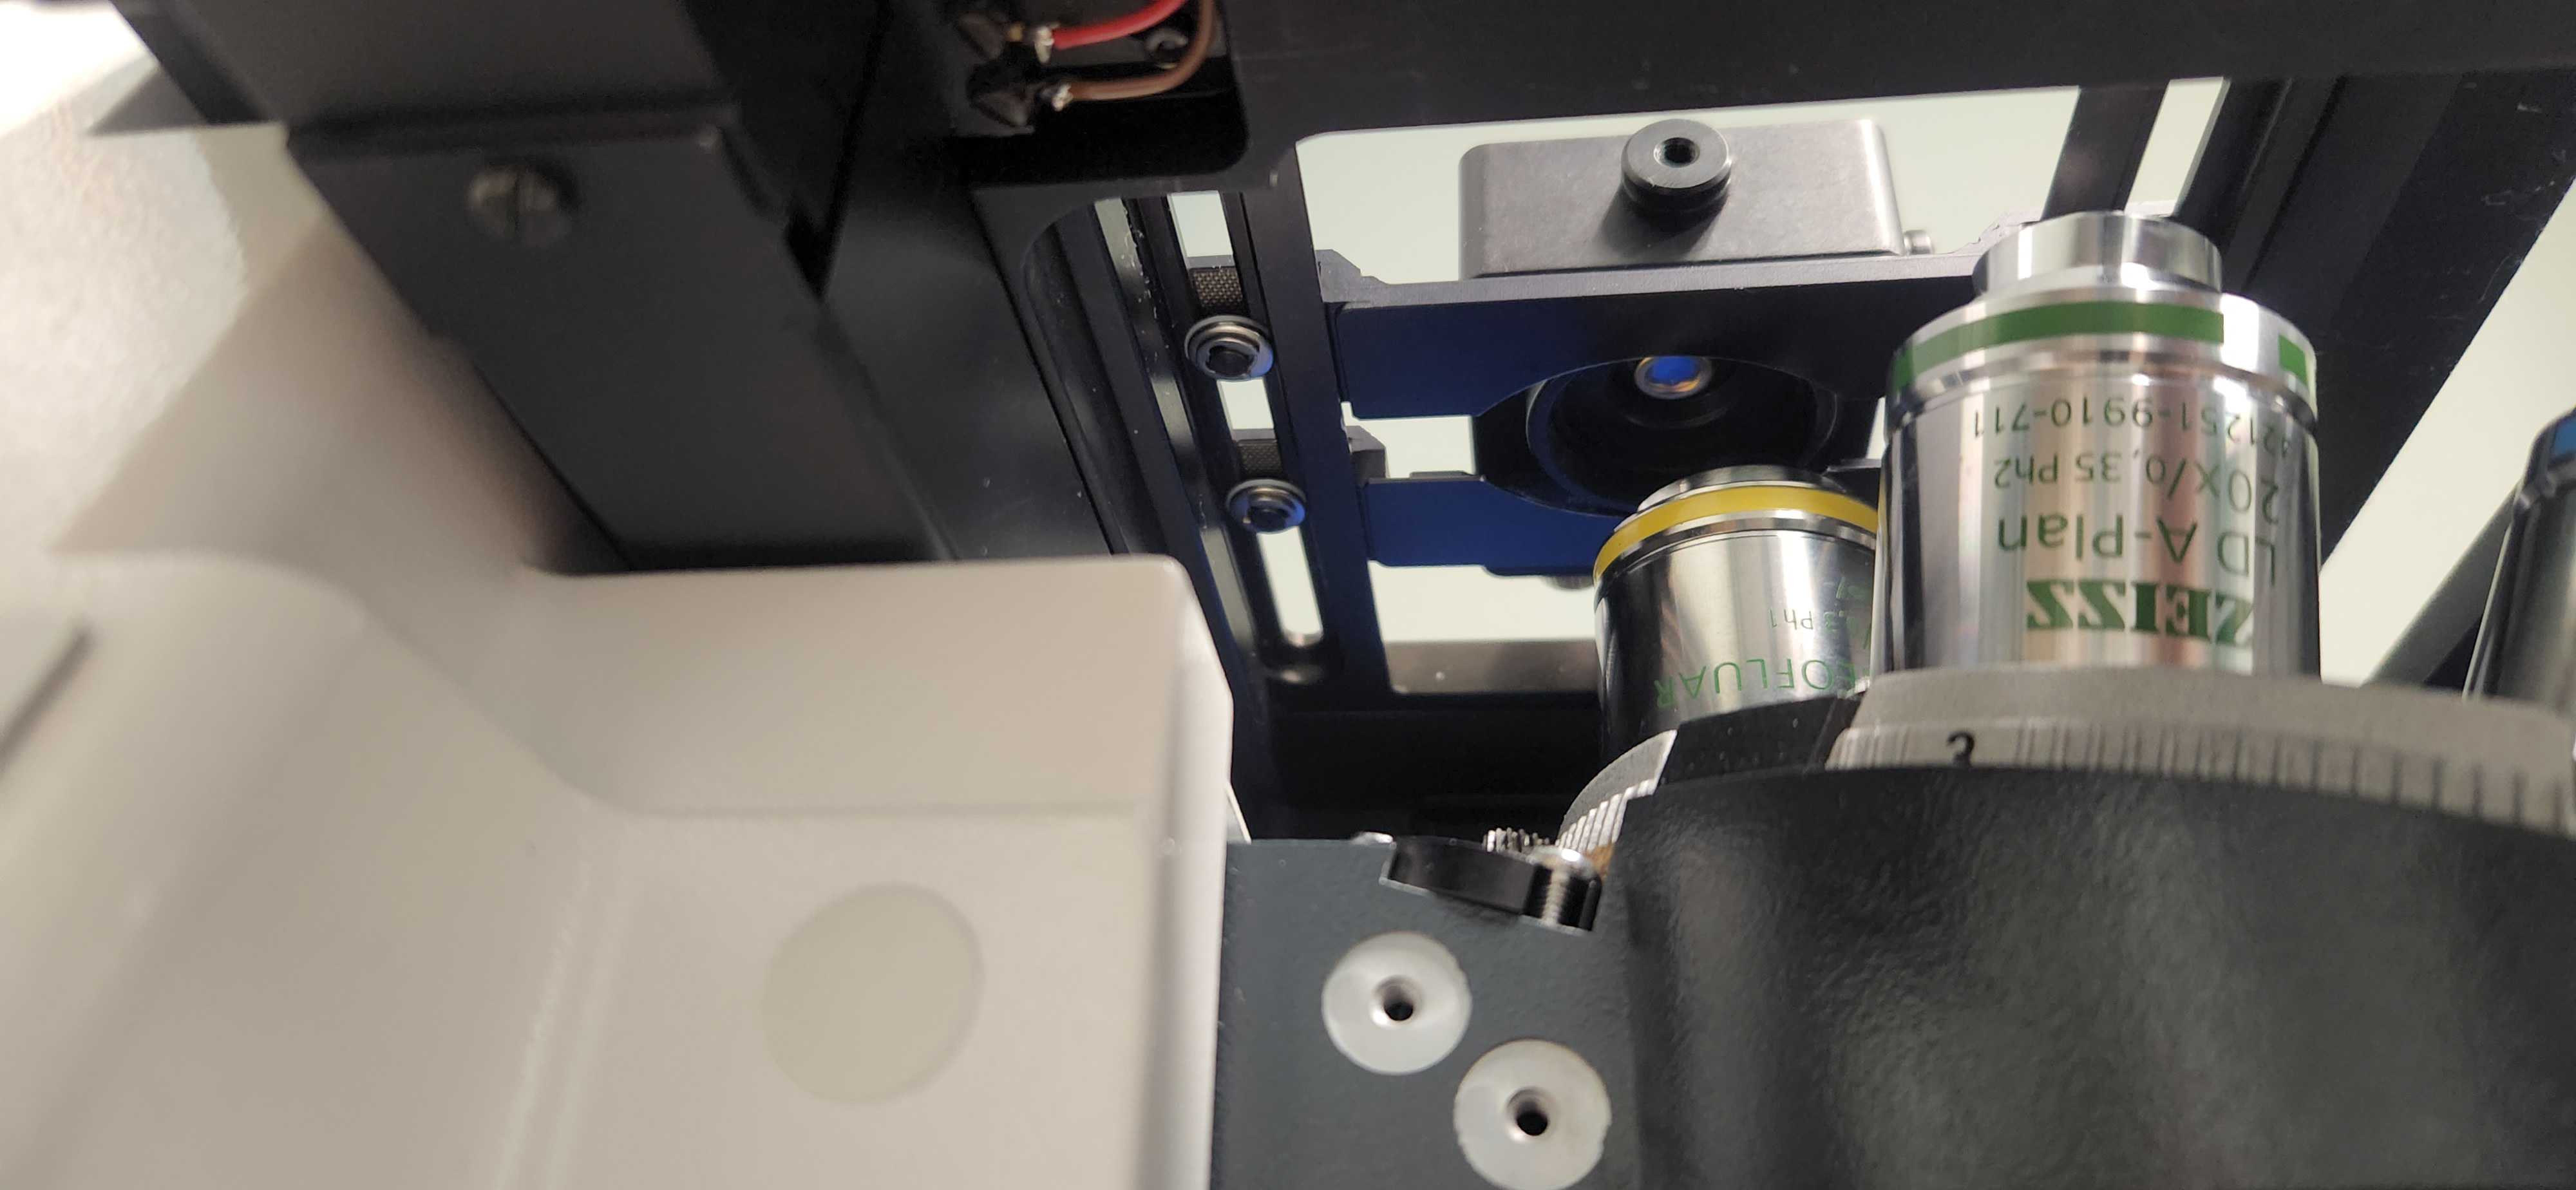
Put a 10x/0.3 NA or similar lens in place.
Put a sample on the microscope stage and focus on it.
Remove the sample.
Turn on the oscilloscope by plugging it into an outlet and pressing the power button at the bottom left.

Set up the oscilloscope light sensor over the objective lens such that the light falls onto the sensor when turned on.
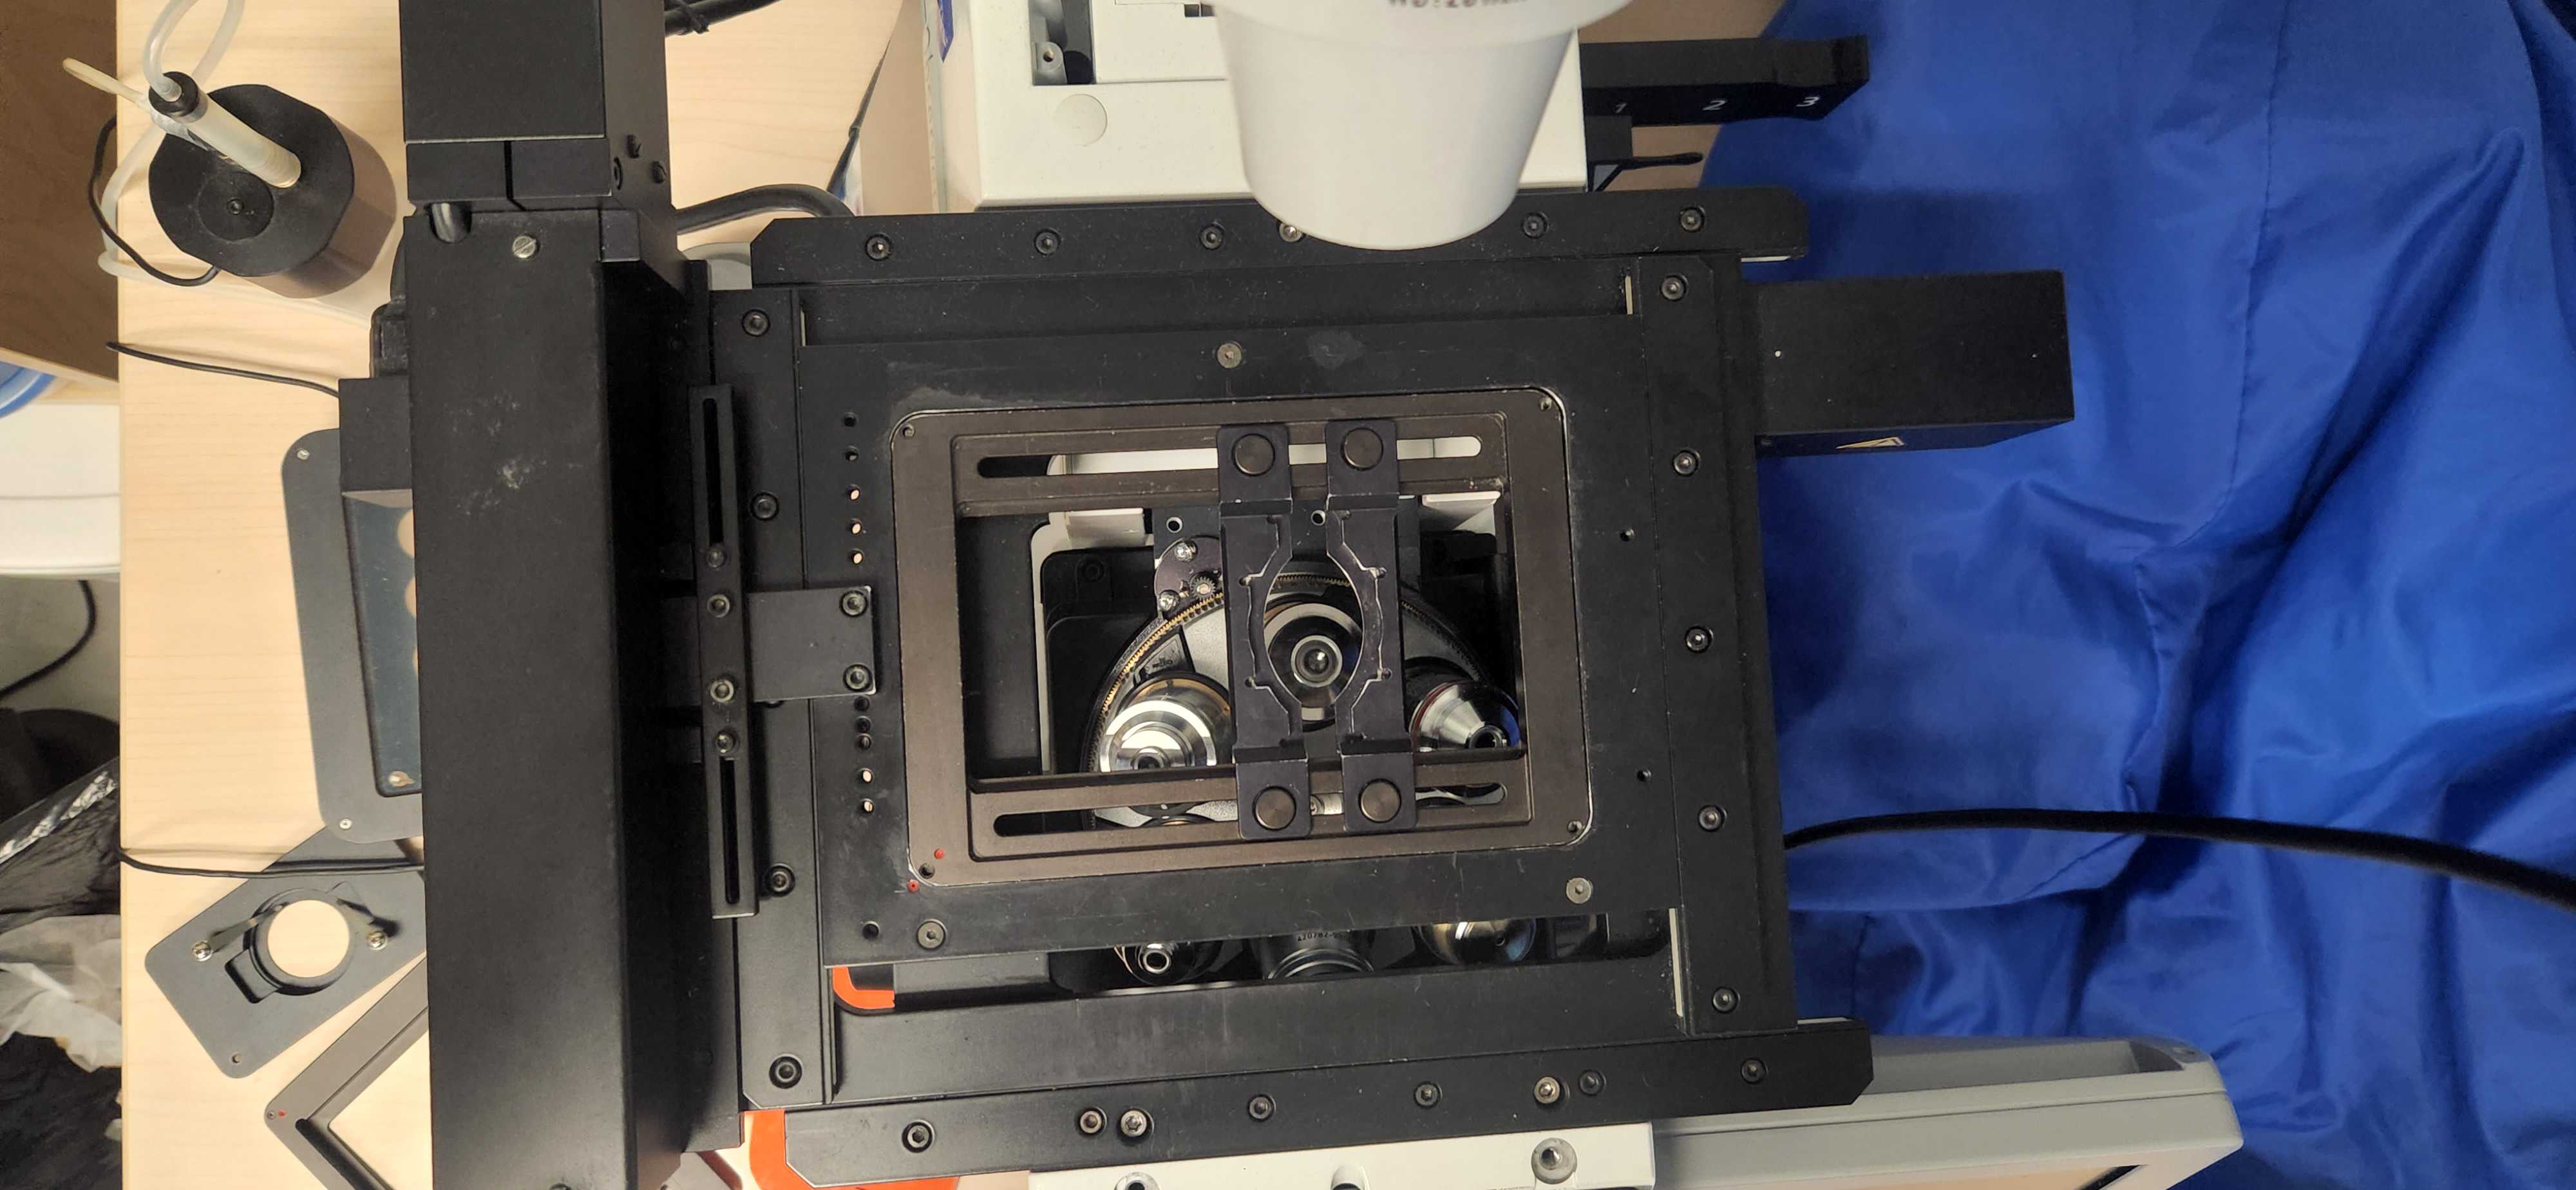
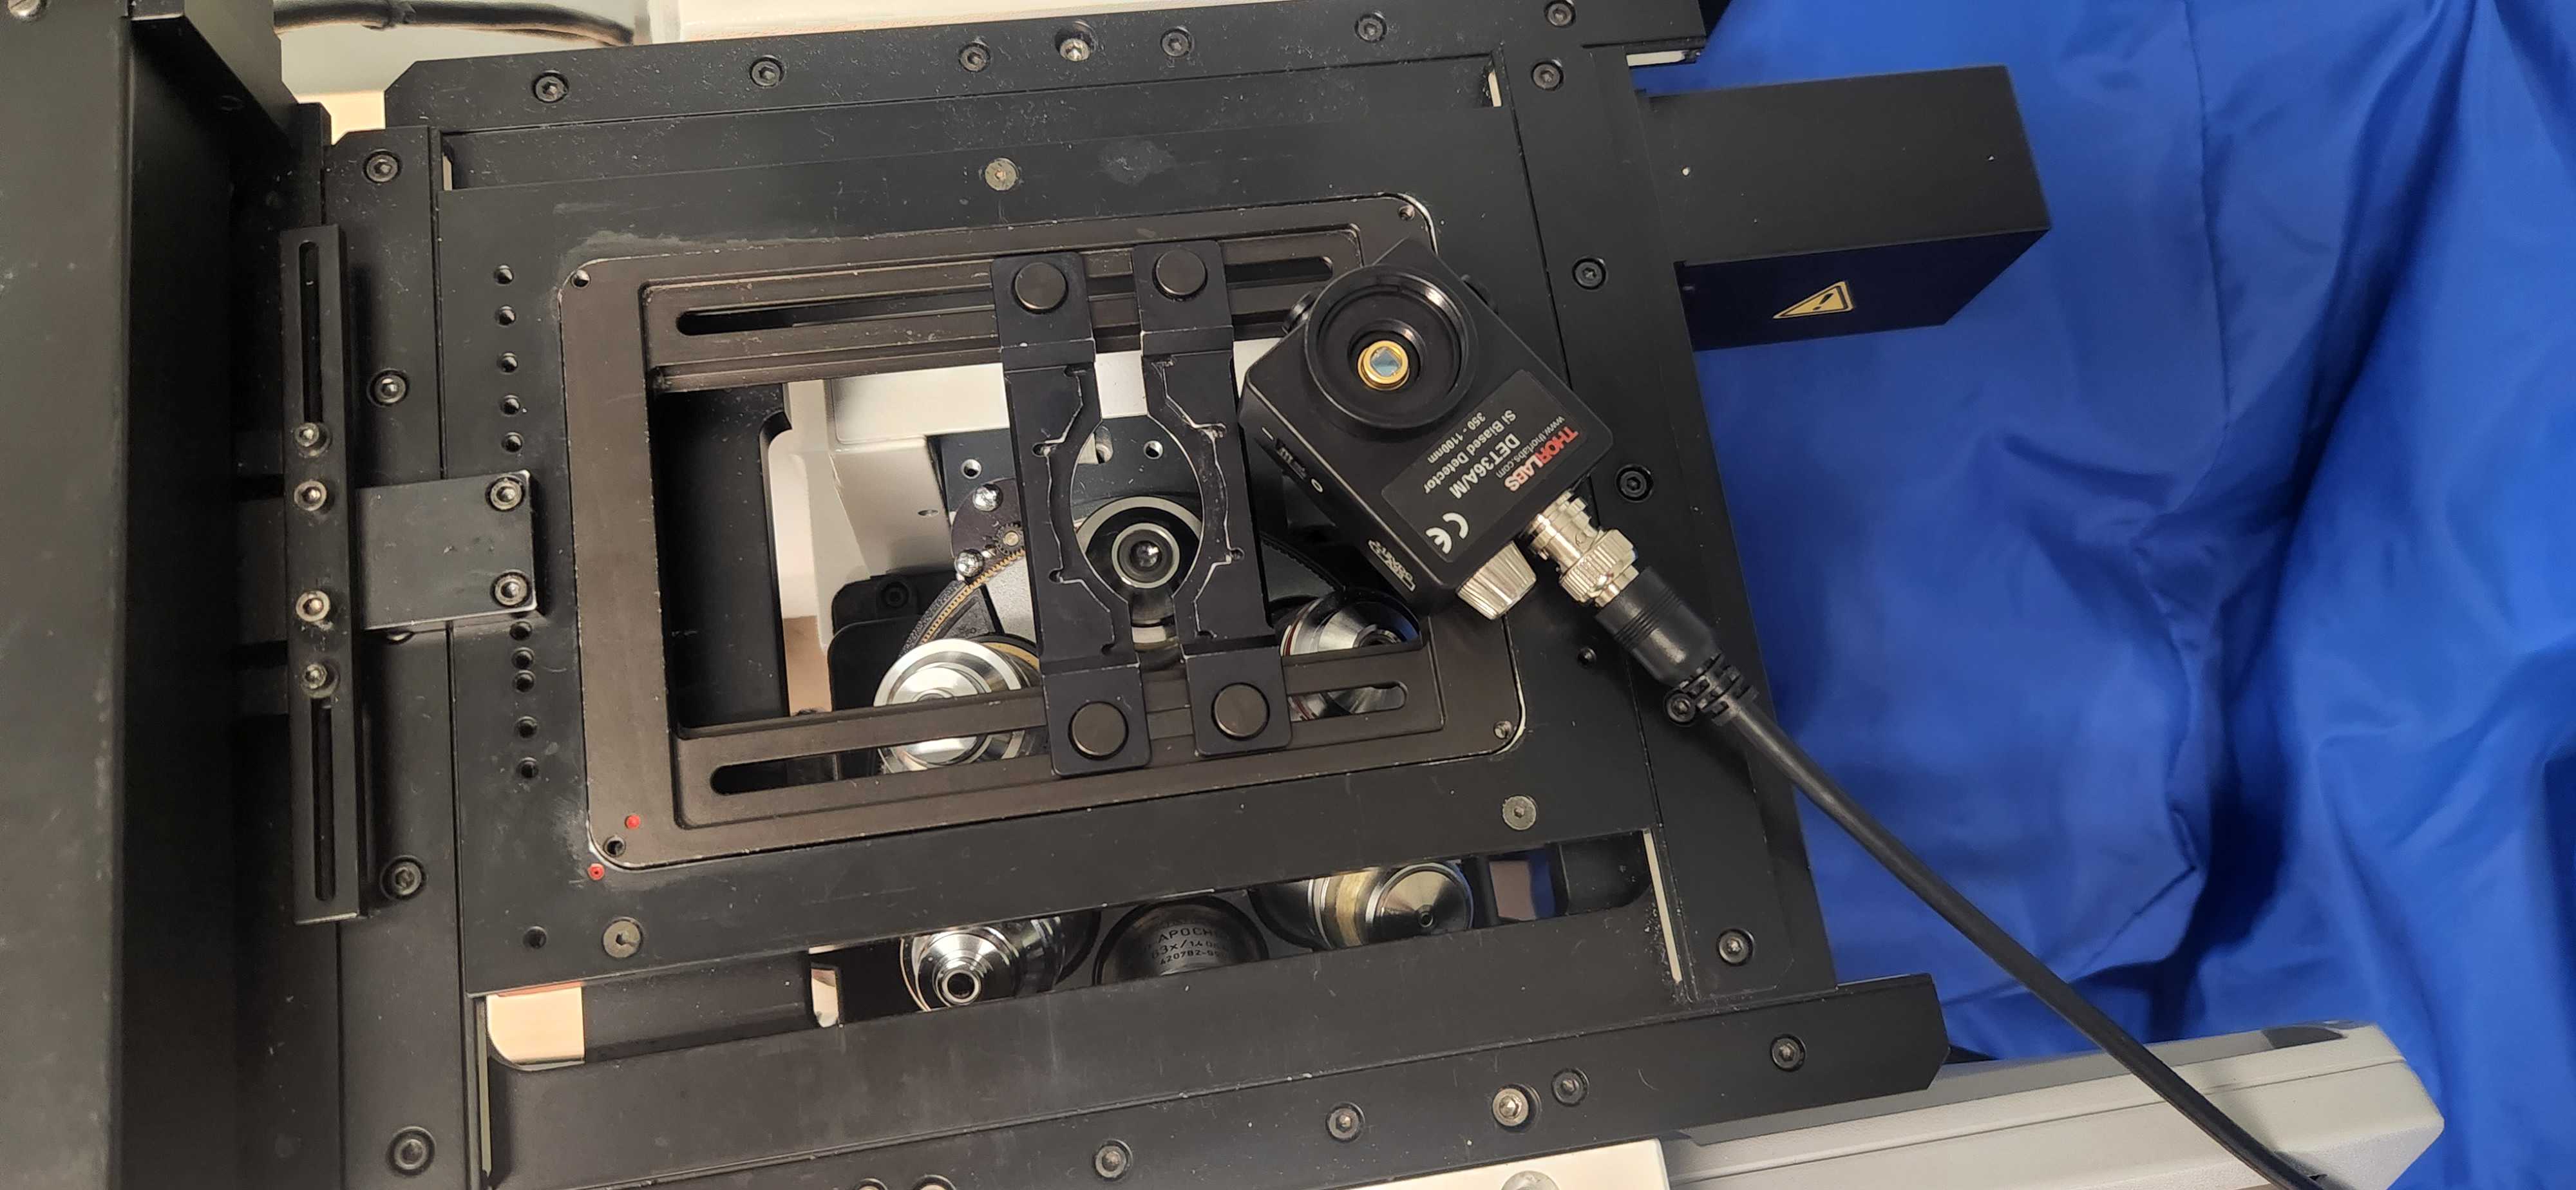
Connect the light sensor to the oscilloscope and select the corresponding channel.
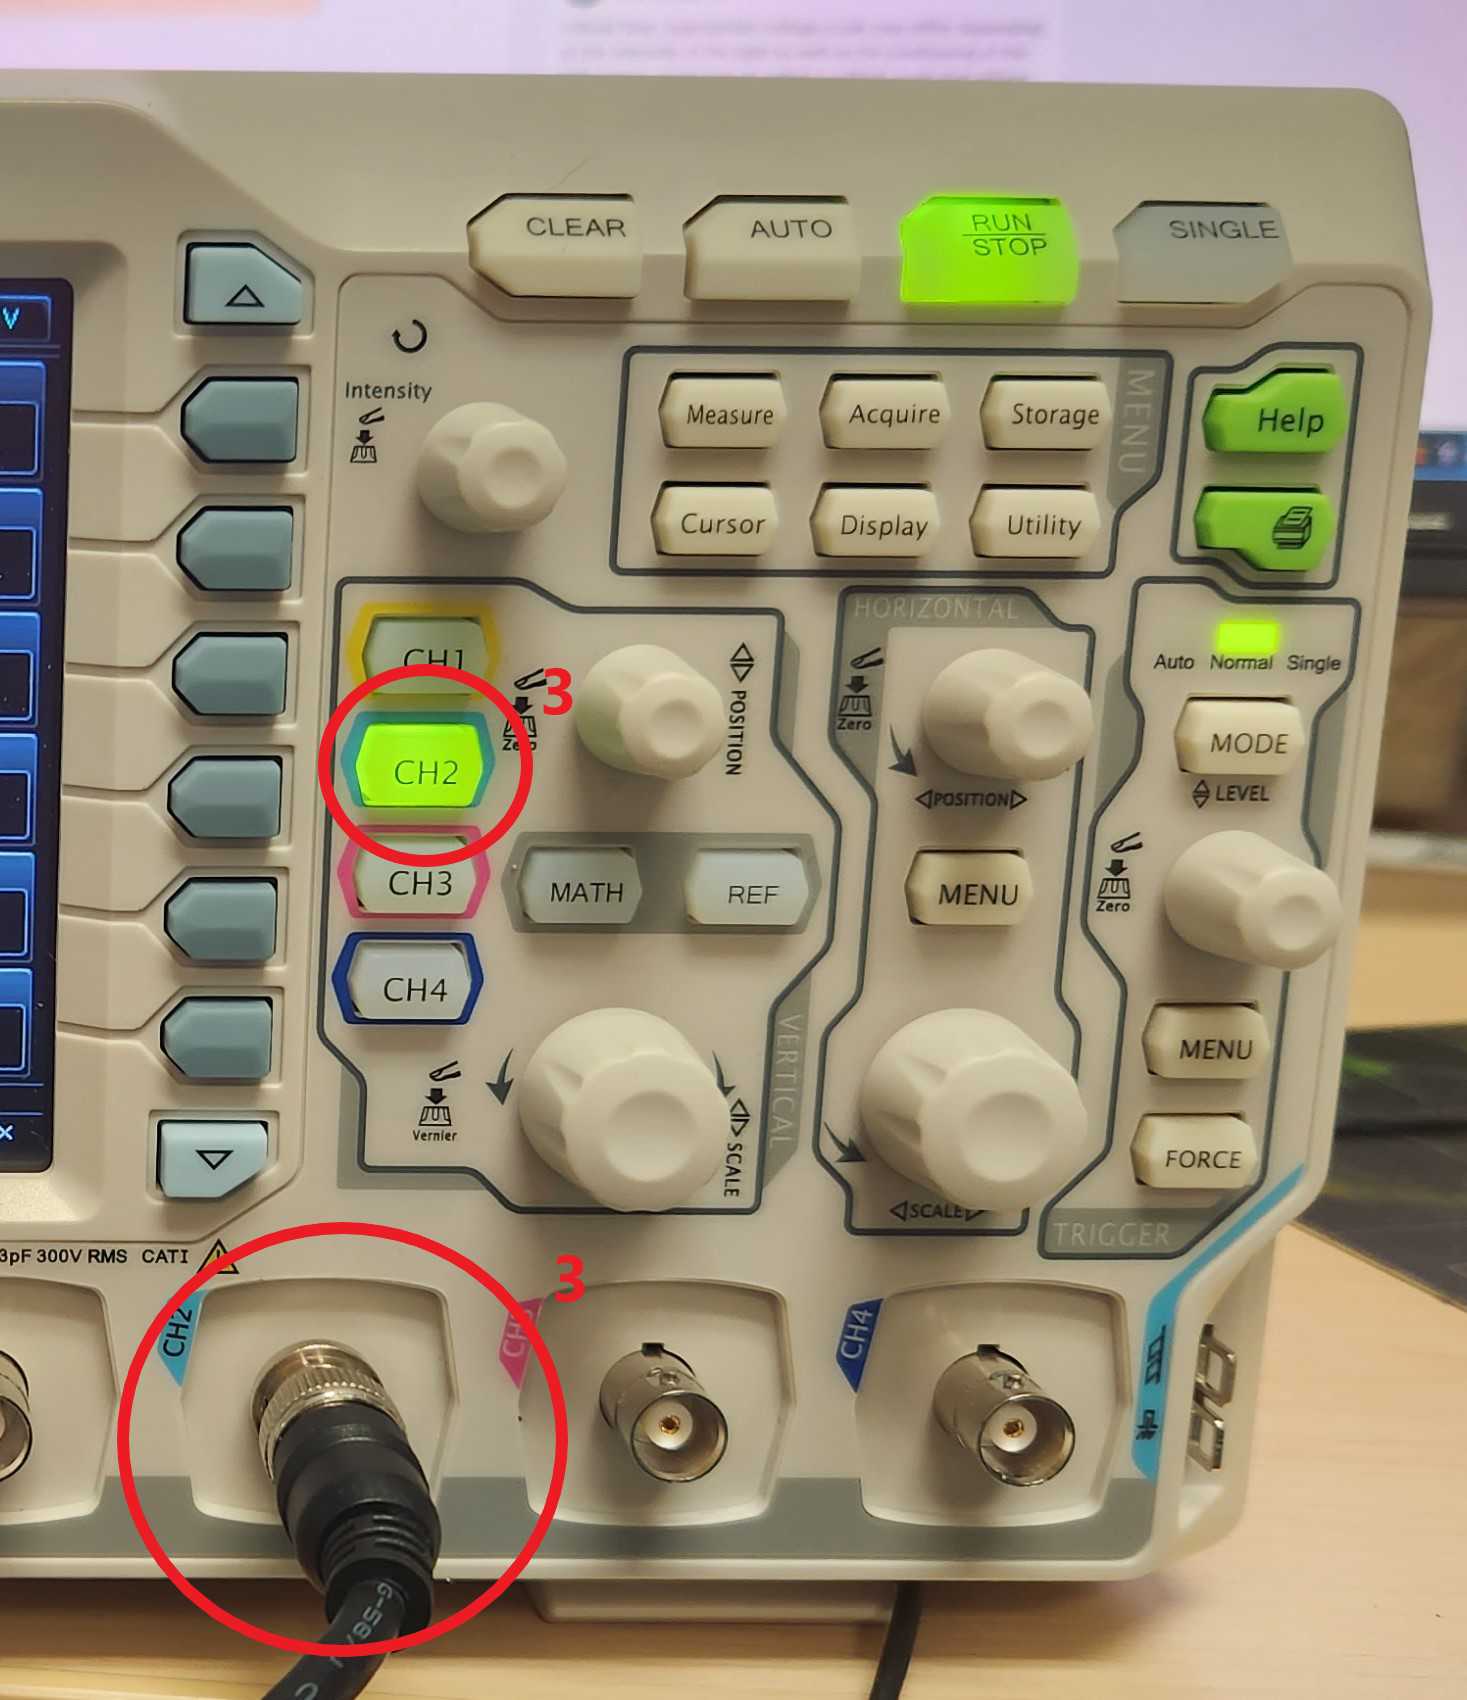
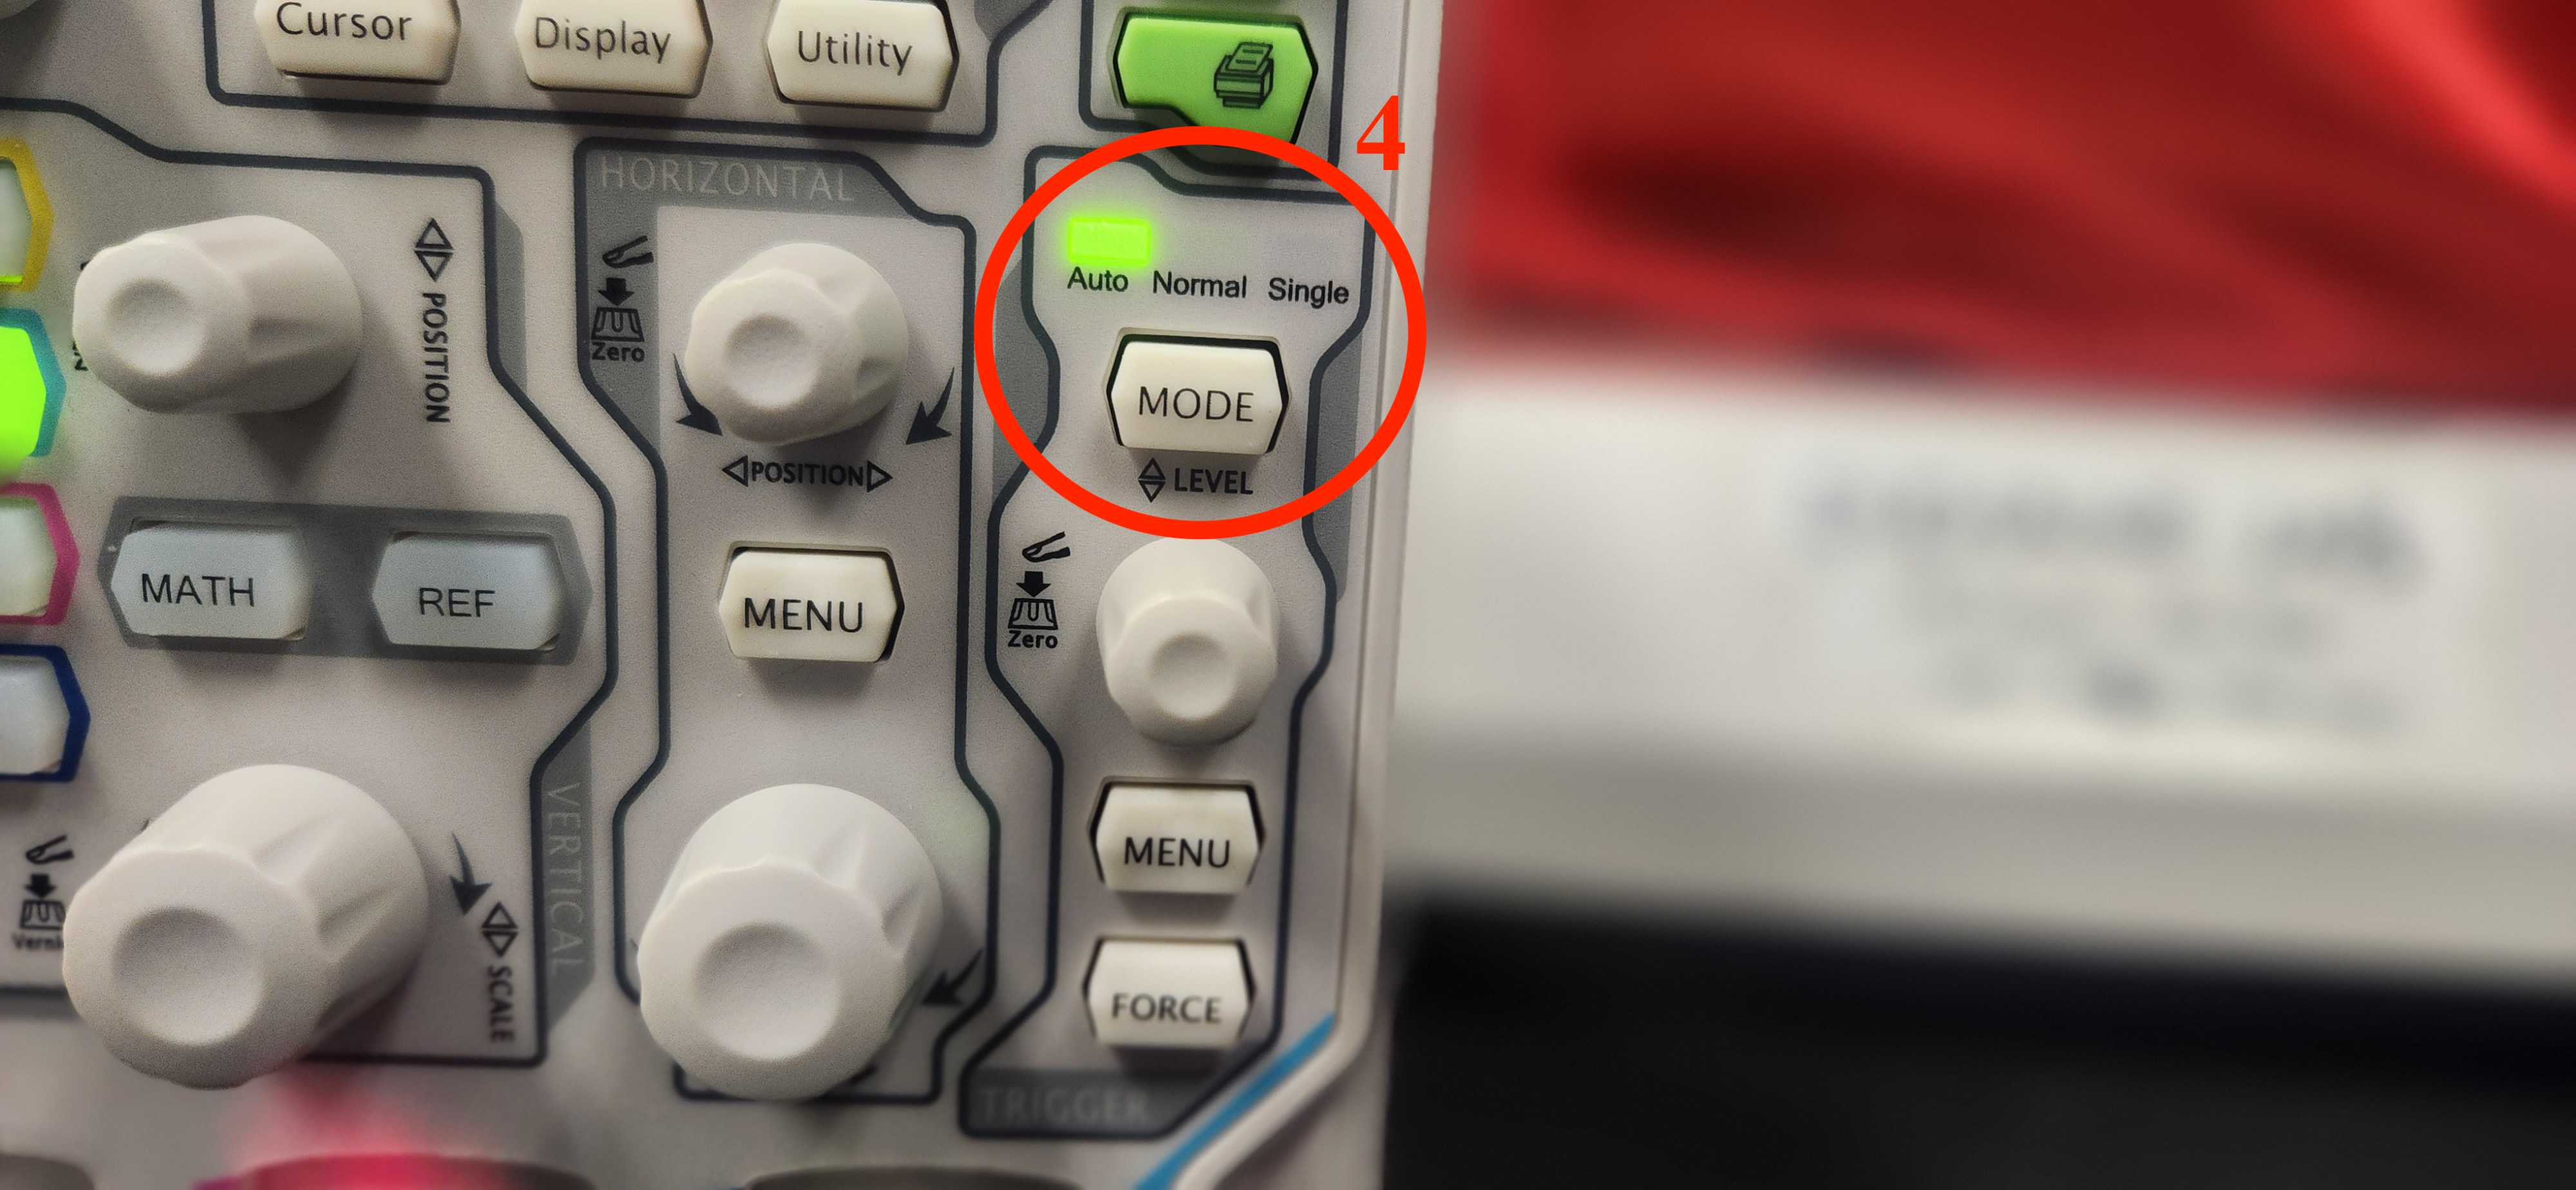
Set the triggering mode to auto by pressing the mode button until the auto light above it turns on.
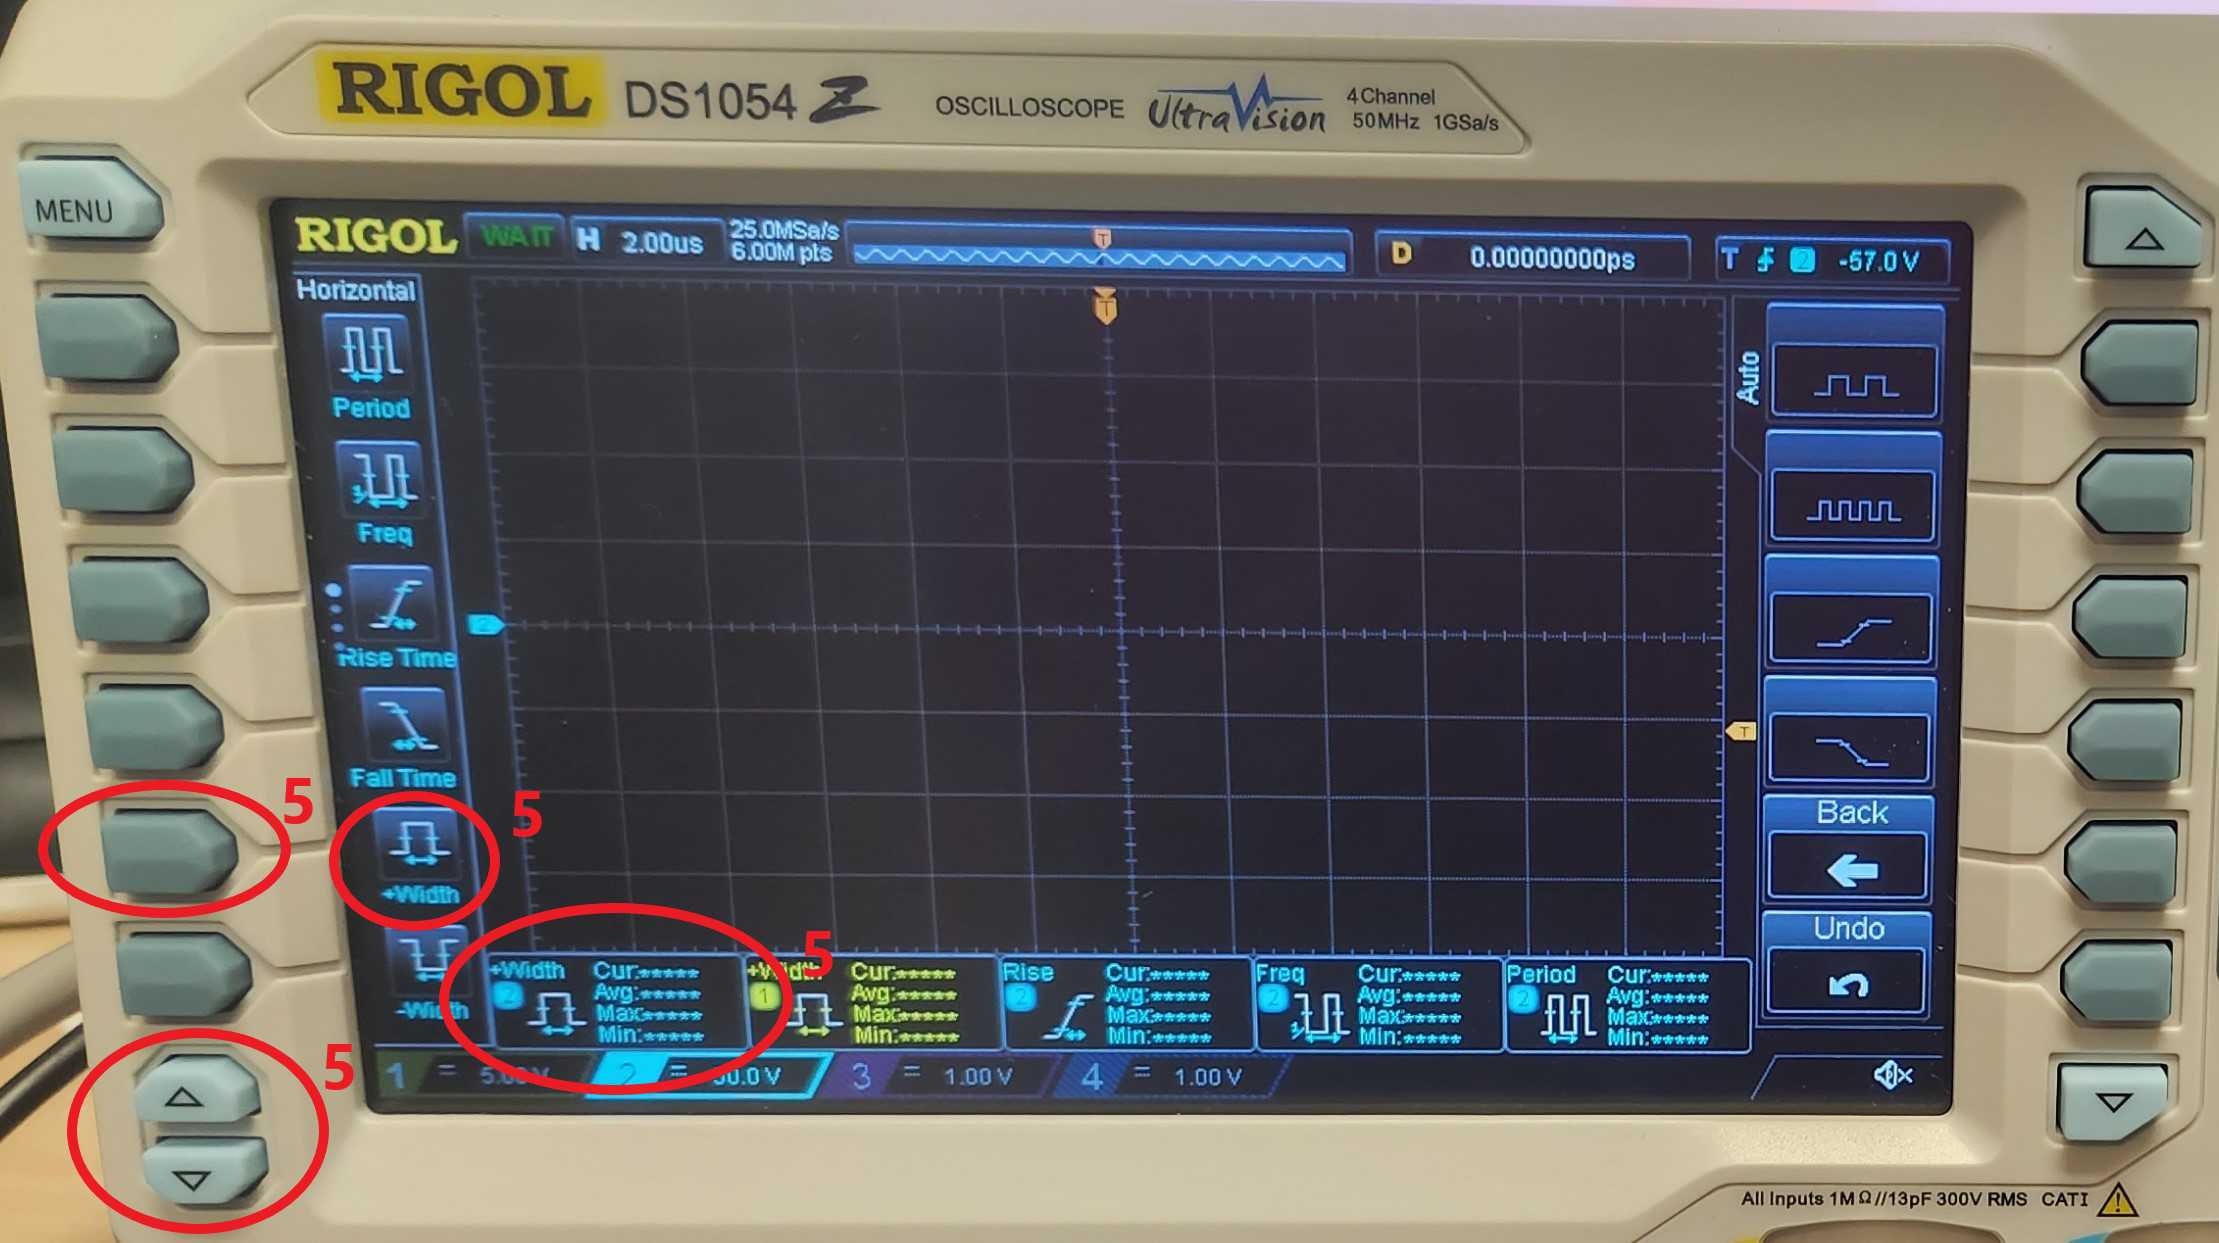
On the left side of the oscilloscope, select the “+width” setting with the upwards wave image using the side buttons, if the option is not displayed, use the arrows at the bottom left to scroll through the options. By selecting +width, a small window should pop up at the bottom of the display (if not already there) that indicates the width of the recorded wave.
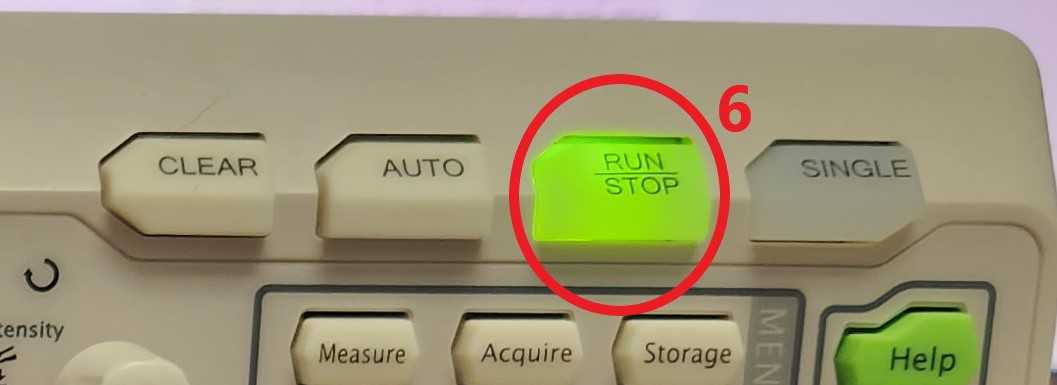
Press the run/stop button at the top right of the oscilloscope to start measuring data. The button should turn green, if it already is green, there is no need to press the button.
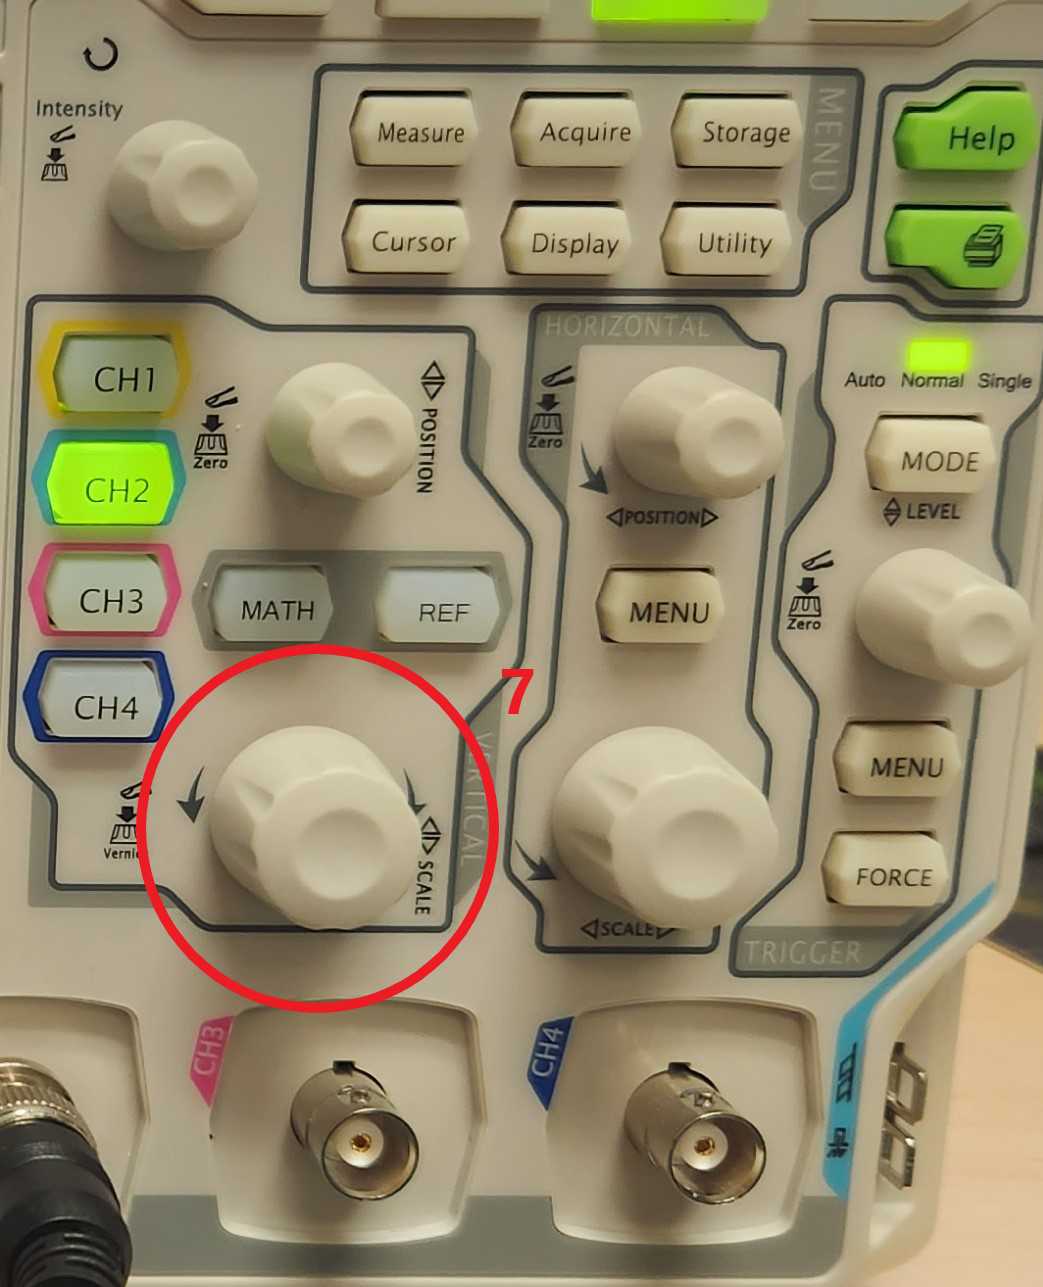
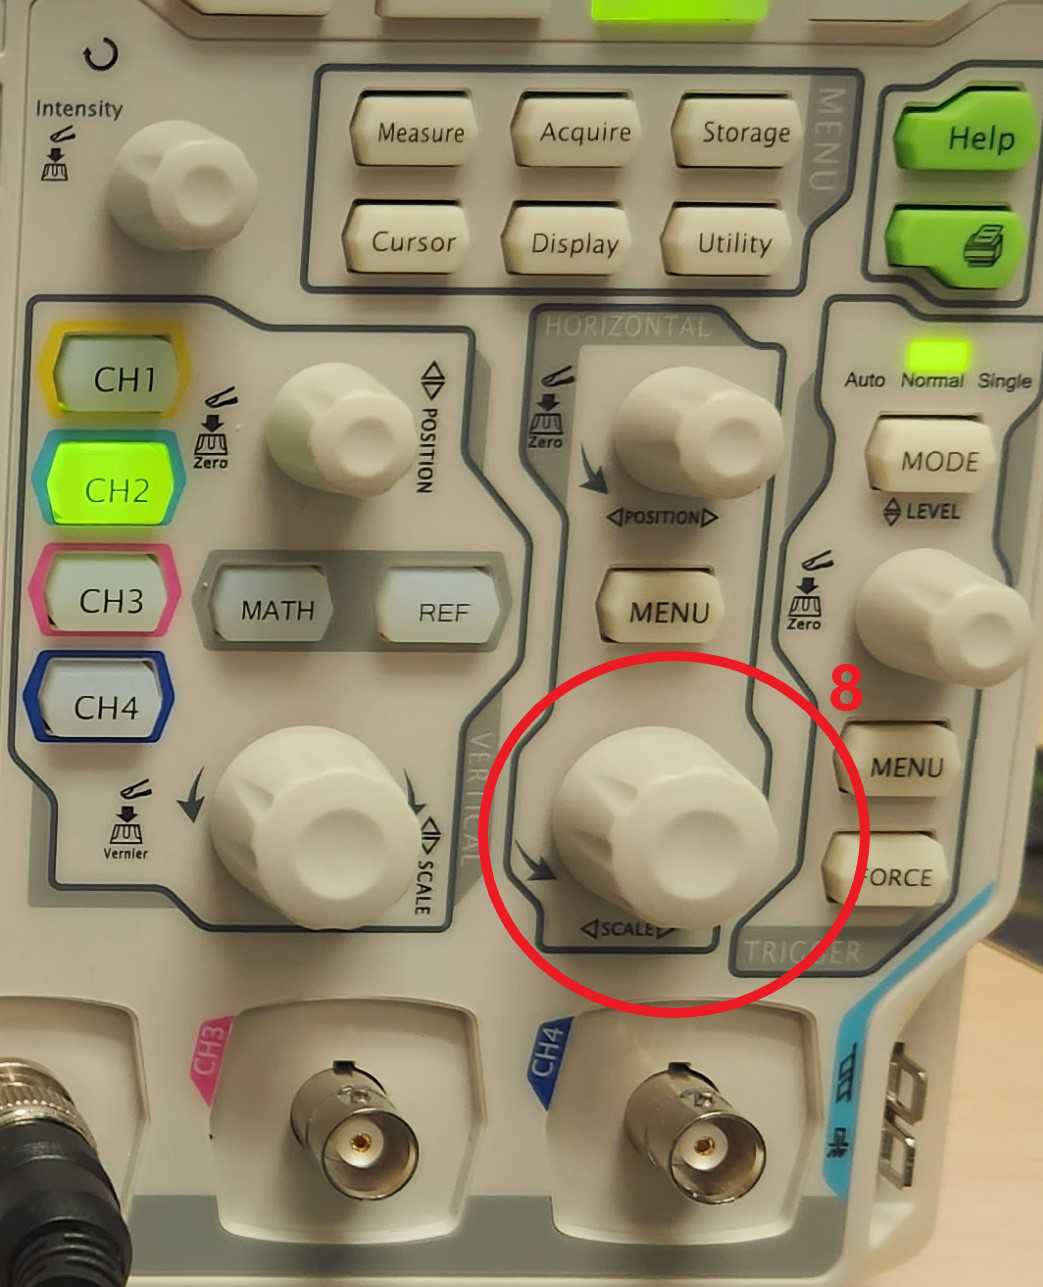
Set a vertical voltage scale using the vertical scale knob underneath the "math" and "ref" buttons. The scale should be set such that one is able to observe a significant change in voltage when the light is turned on. Generally, a 2 to 50 volt voltage scale works well.
Set an appropriate horizontal time scale using the horizontal scale knob that allows the wave to be fully displayed on the oscilloscope screen. Generally, a scale anywhere from 2 to 3 times the set exposure time of the camera works.
Set the camera exposure time in the microscope image acquisition software.
Take snapshots using the microscope software.
Read the width of the wave from the width display at the bottom of the screen.
Collecting Raw Data
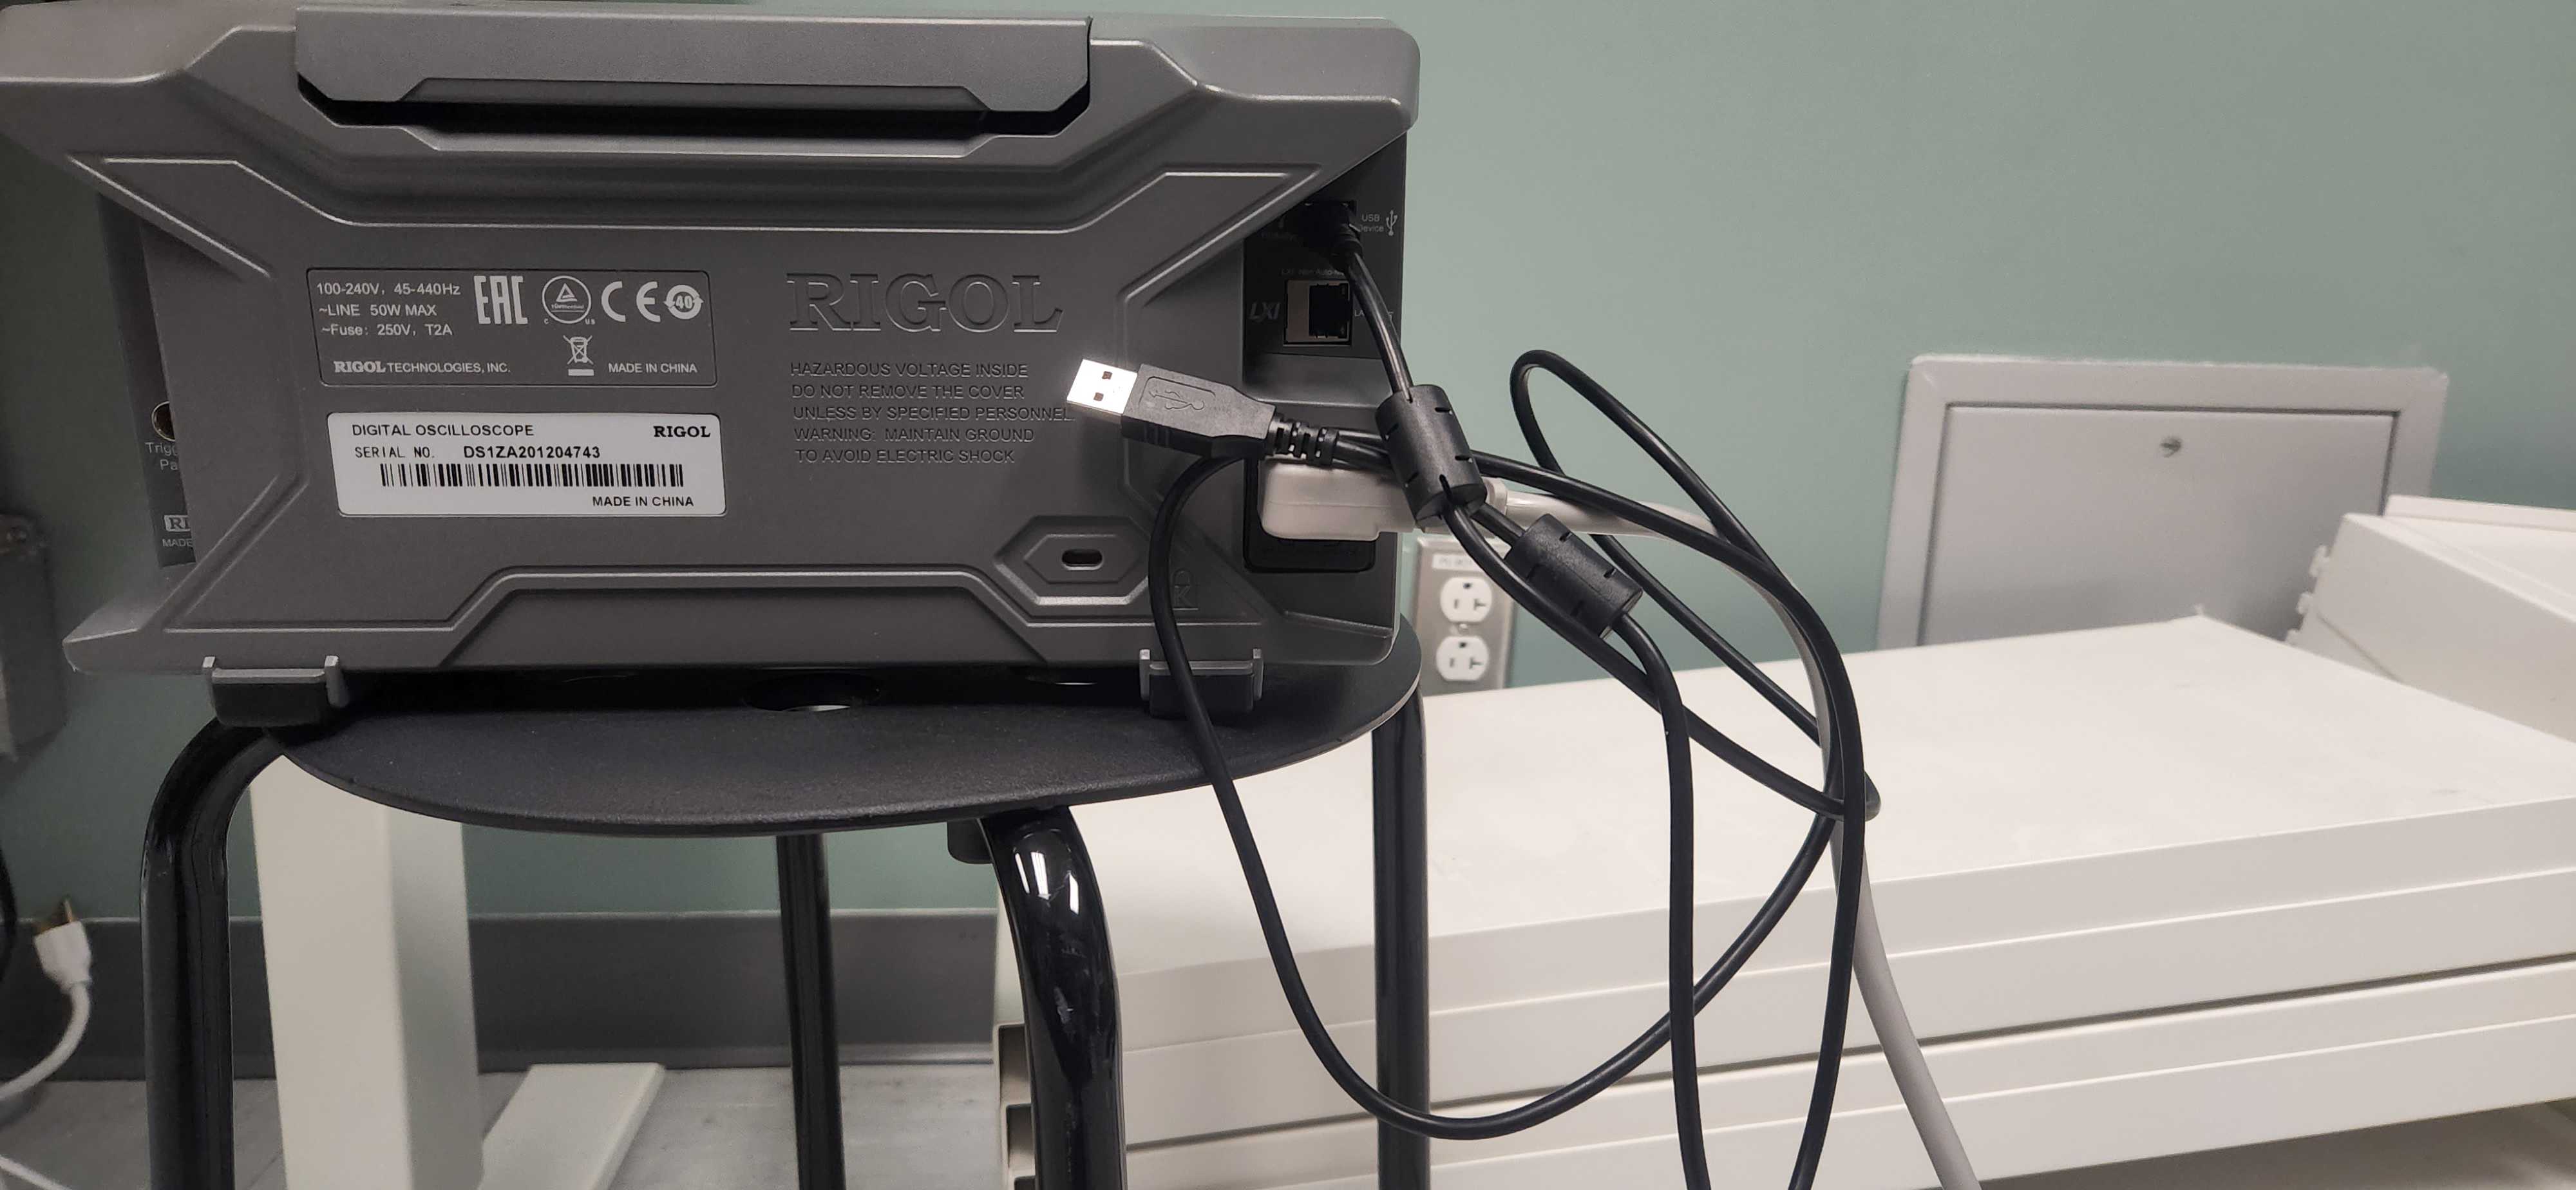
Connect the oscilloscope to a computer using the oscilloscope’s USB connector.
Install the Ultra Sigma Software on the computer.
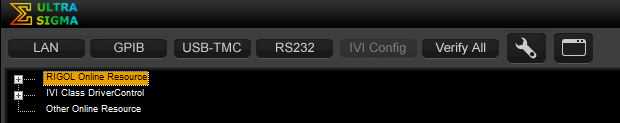
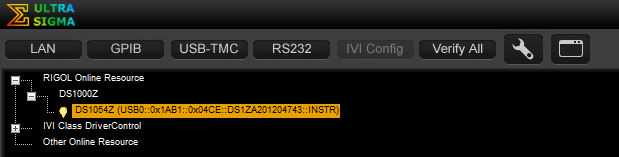
Open Ultra Sigma and double click on “RIGOL Online Resource.”
Double Click on “DS1000Z.”
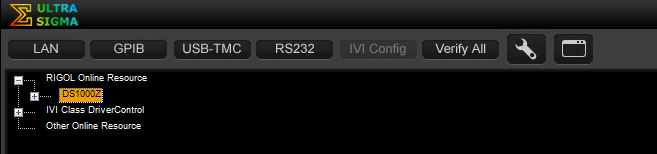
Right Click on “DS1054Z…” and left click the “UltraScope” option.
Select the corresponding channel at the bottom of the Rigol UltraScope software display by left-clicking on the channel number. Change the y-axis setting to the appropriate channel by right clicking the vertical axis and selecting the channel. Ensure that "Oper Chan" is set to the appropriate channel as well.

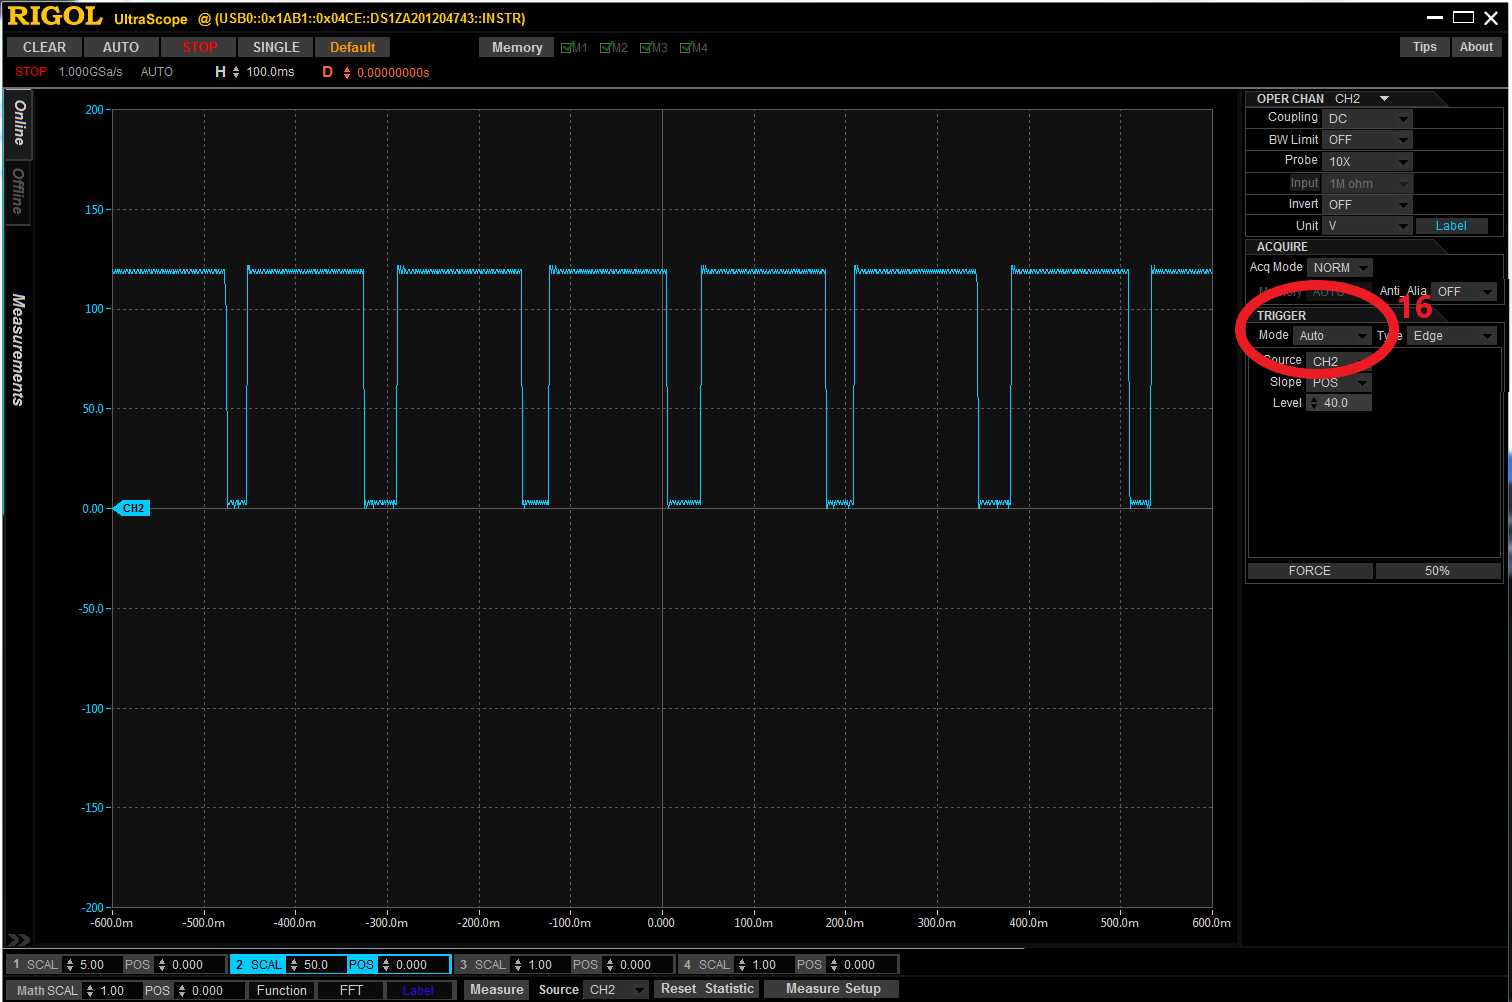
Ensure trigger mode is set to the auto mode.
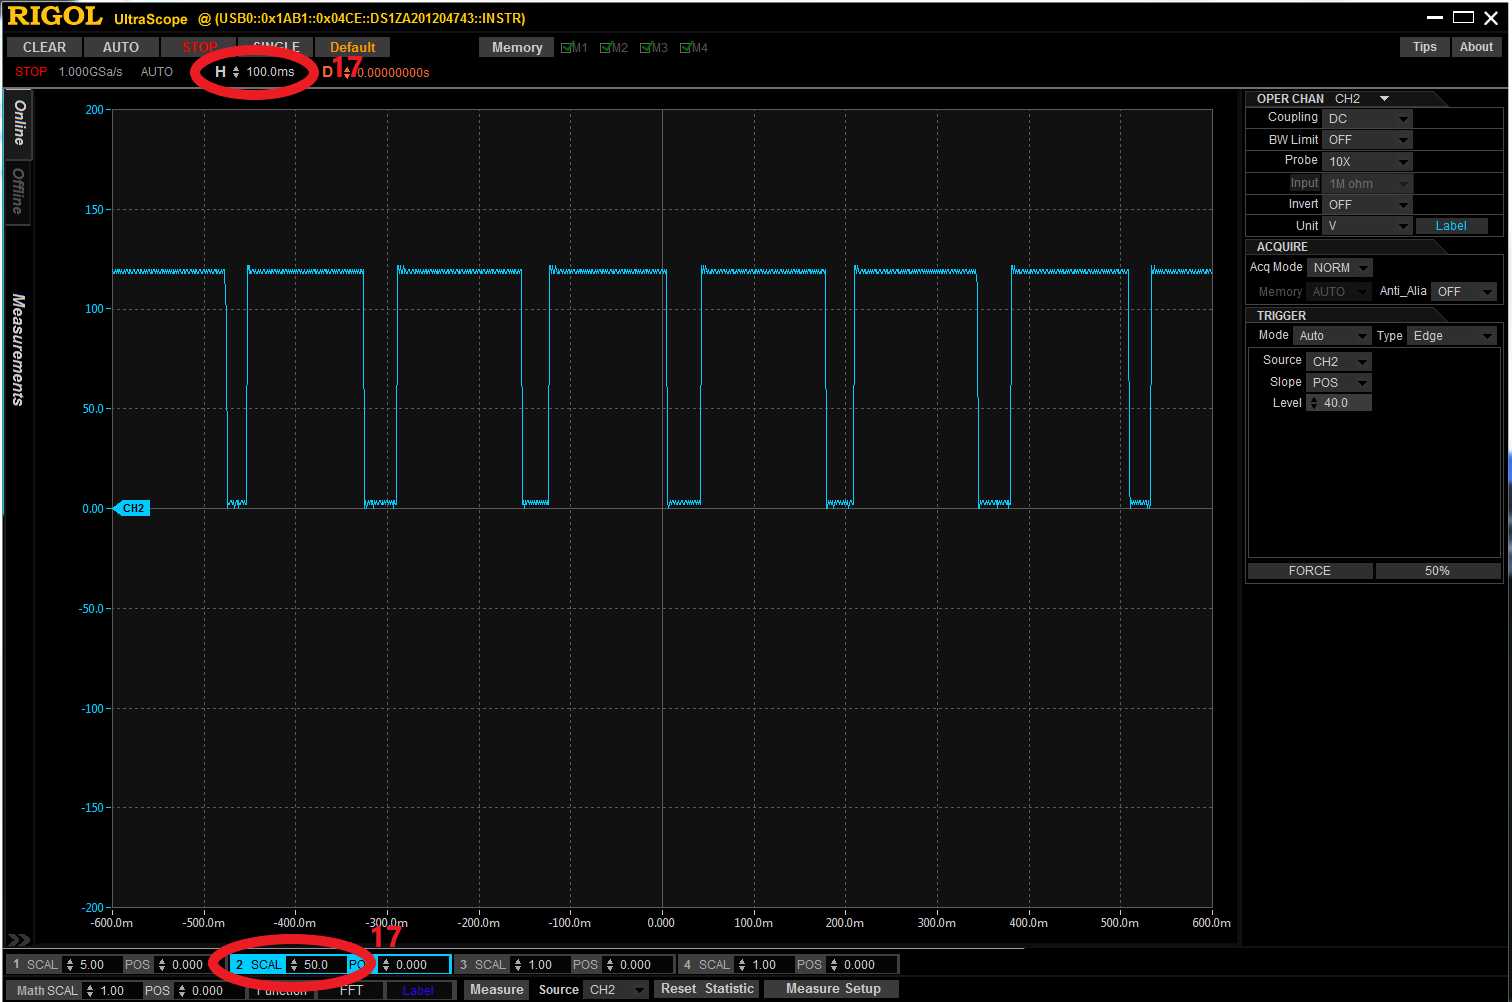
Select appropriate horizontal (time) and vertical (voltage) scales in the software. Change the scale in the software not physically on the oscilloscope hardware.
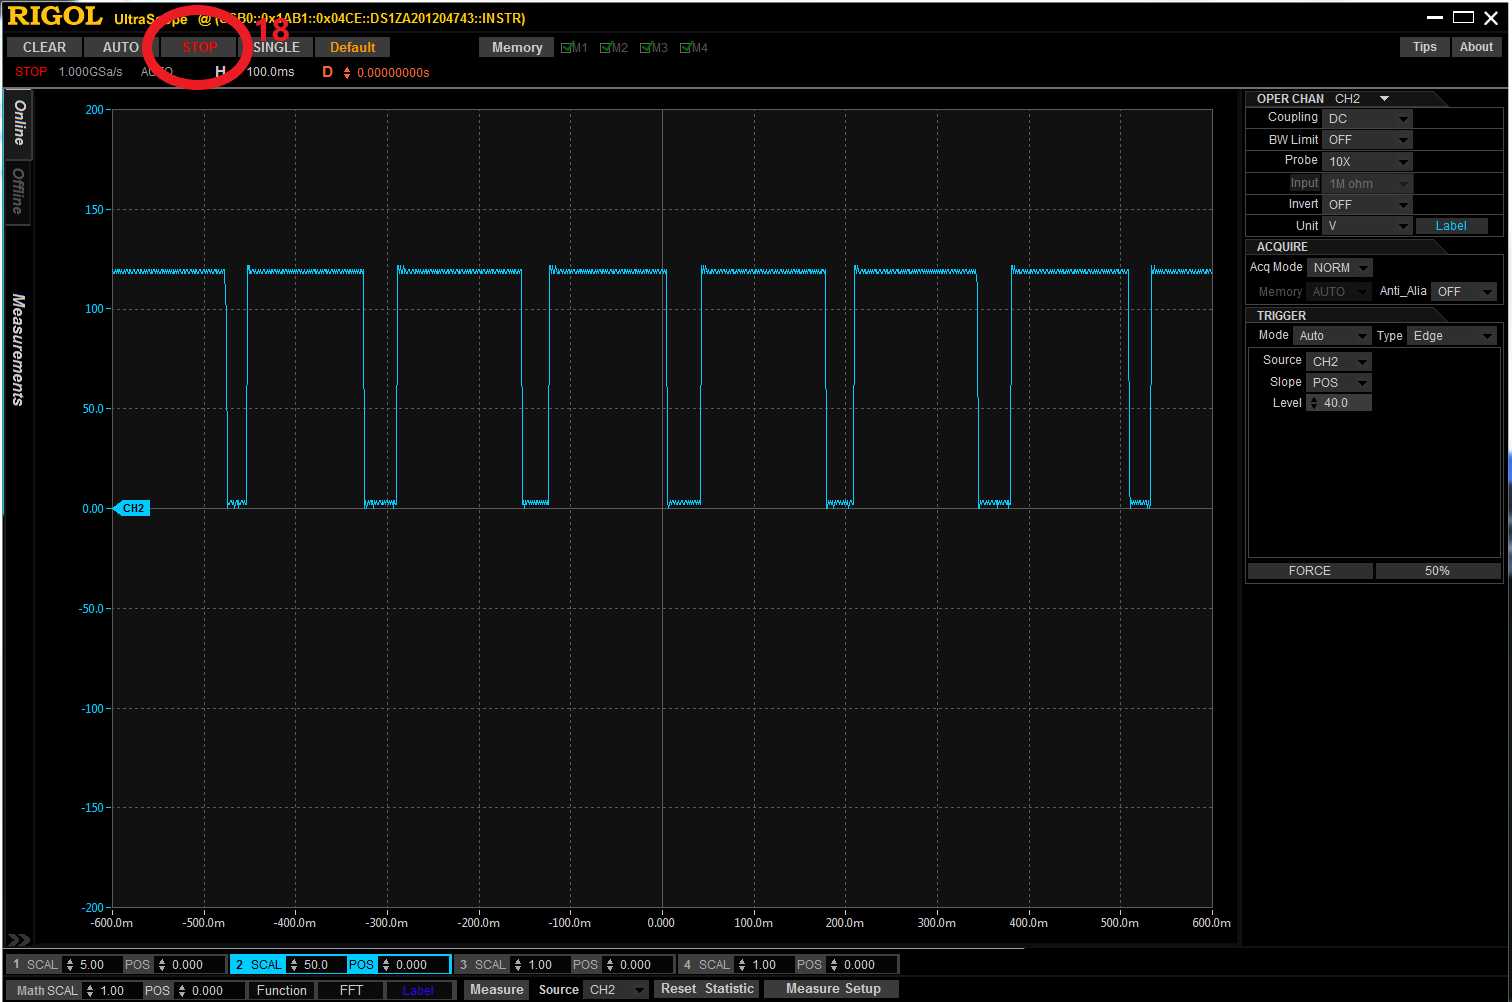
If the button at the top of the display does not already say “RUN,” but instead says “STOP,” click on it to switch it to “RUN” and take snapshots using the microscope image acquisition software as described above in “Measuring IO Using the Rigol DS1054Z Oscilloscope.” When the desired graph is displayed, click the “RUN” button at the top of the UltraScope software to change it to “STOP” and freeze the graph on the display.
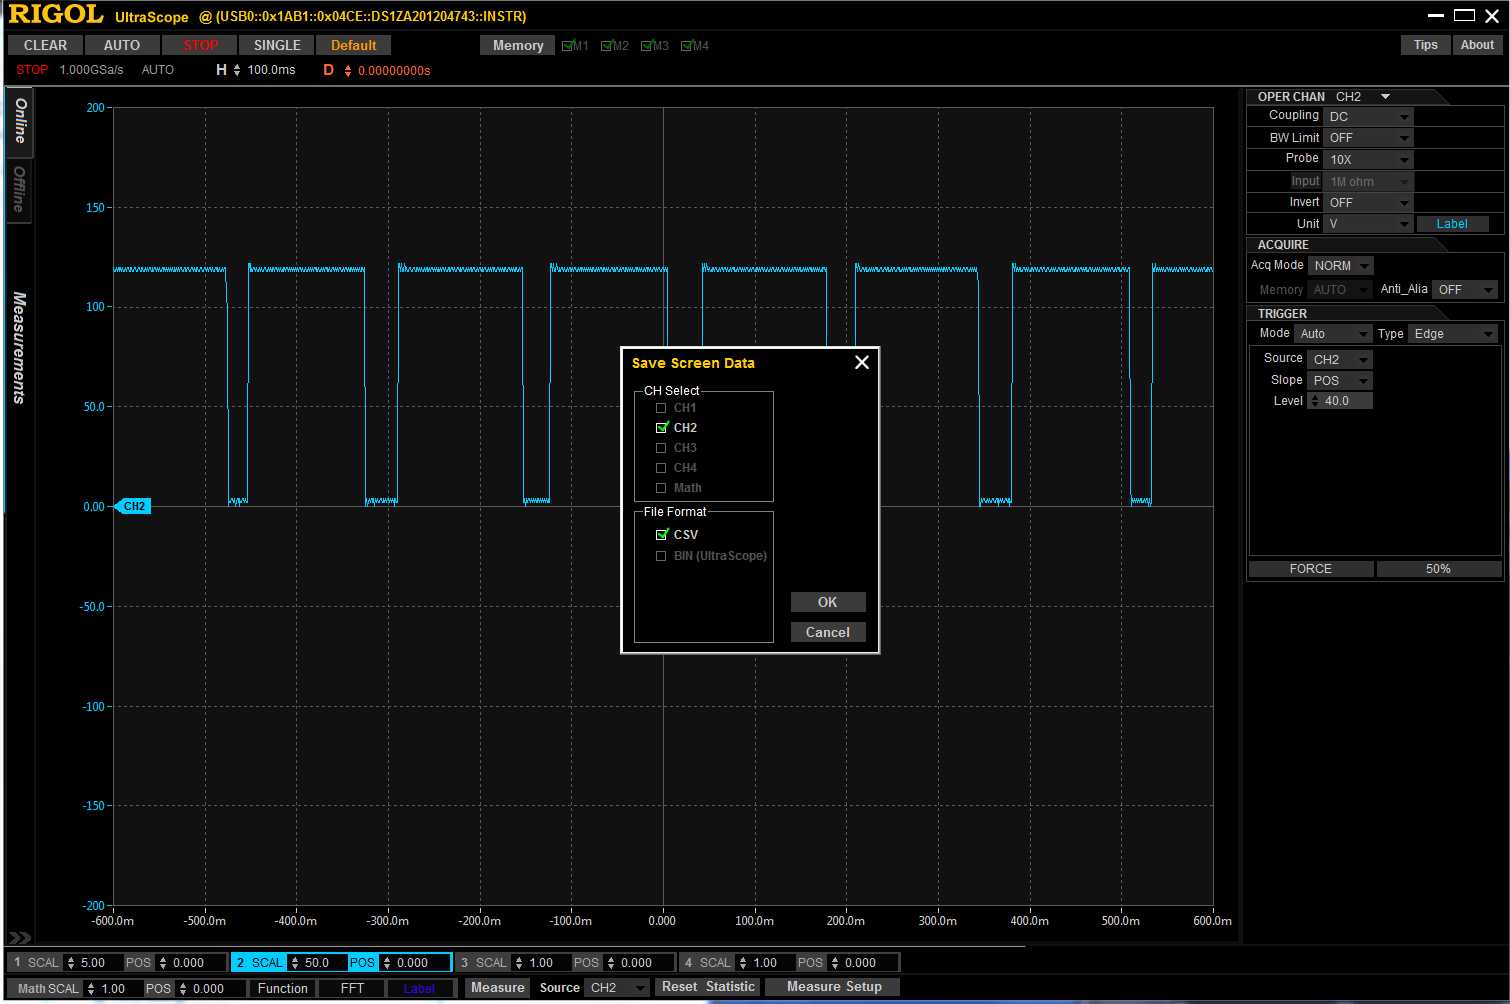
Right click on the graph and select “save channel.”
Make sure that the corresponding channel and CSV are both checked off, then click “OK” and save the channel voltage and time information as a .csv file in the desired file destination.
If desired, press “clear” on the oscilloscope hardware or at the top of the software window to clear the screen, then press the “STOP” button on the software again. Change the "STOP" to "RUN" to collect the next set of data.
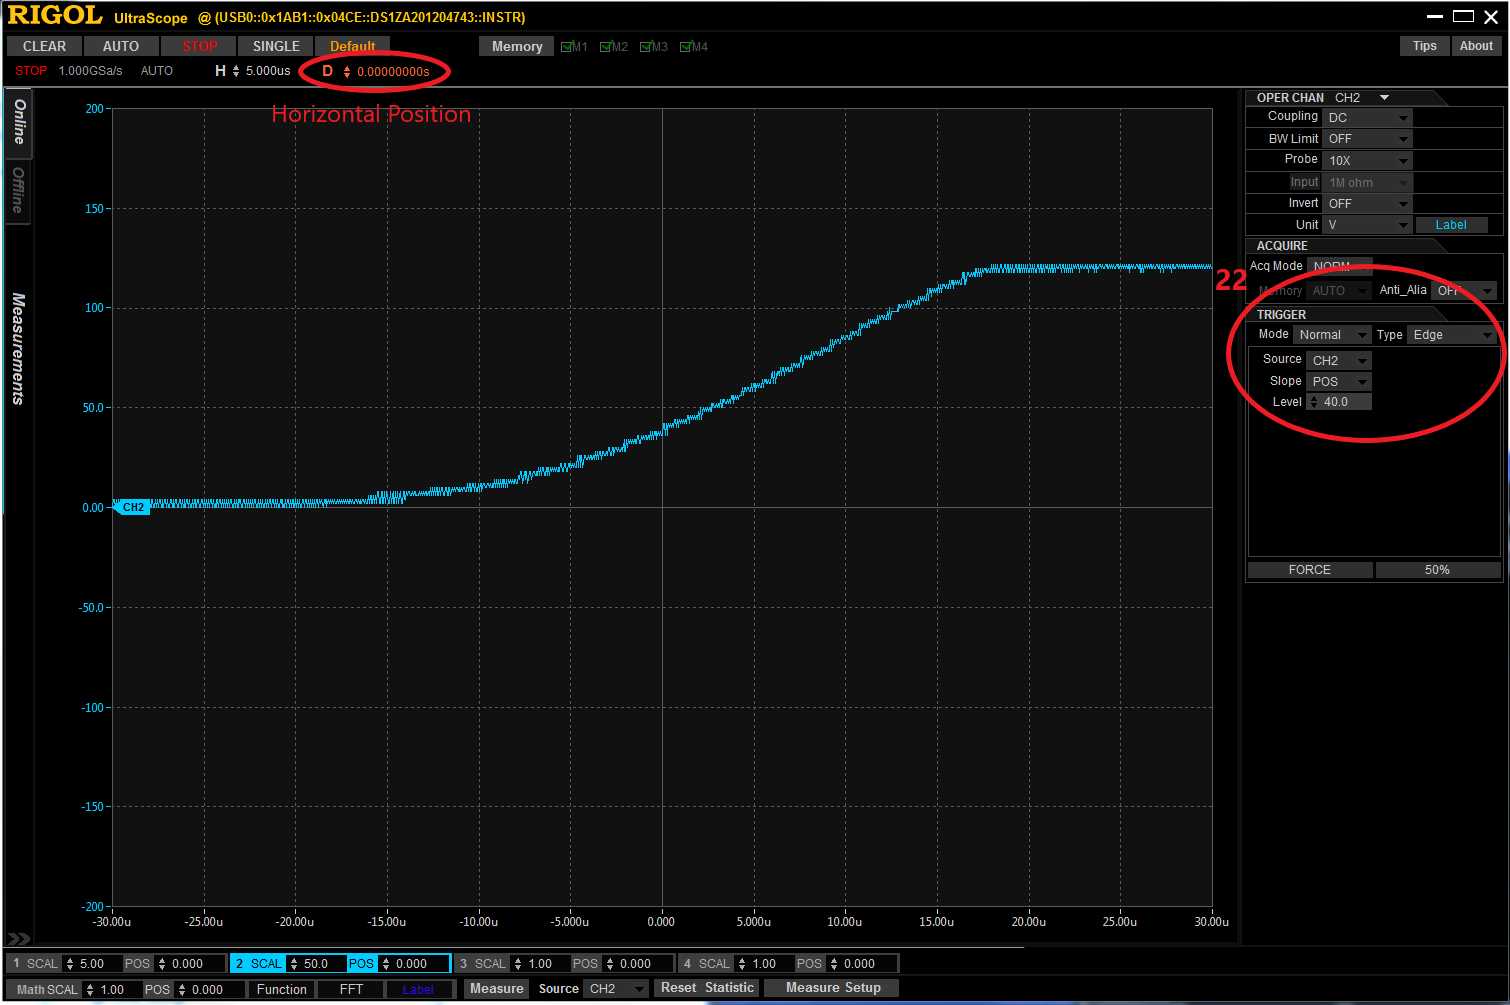
To obtain the rapid ramp on and ramp off time versus voltage values of the microscope light source, in UltraScope, under the trigger option, select “Normal” for mode and ensure that the type is set to “Edge.” Set the source to the appropriate channel.
For ramp on values, select “POS” for slope, and for ramp off values, select “NEG” for slope. For the level, select a value in between the minimum and maximum voltage values of a wave. Use the continuous function in the microscope software and a low exposure time such as 20 ms.
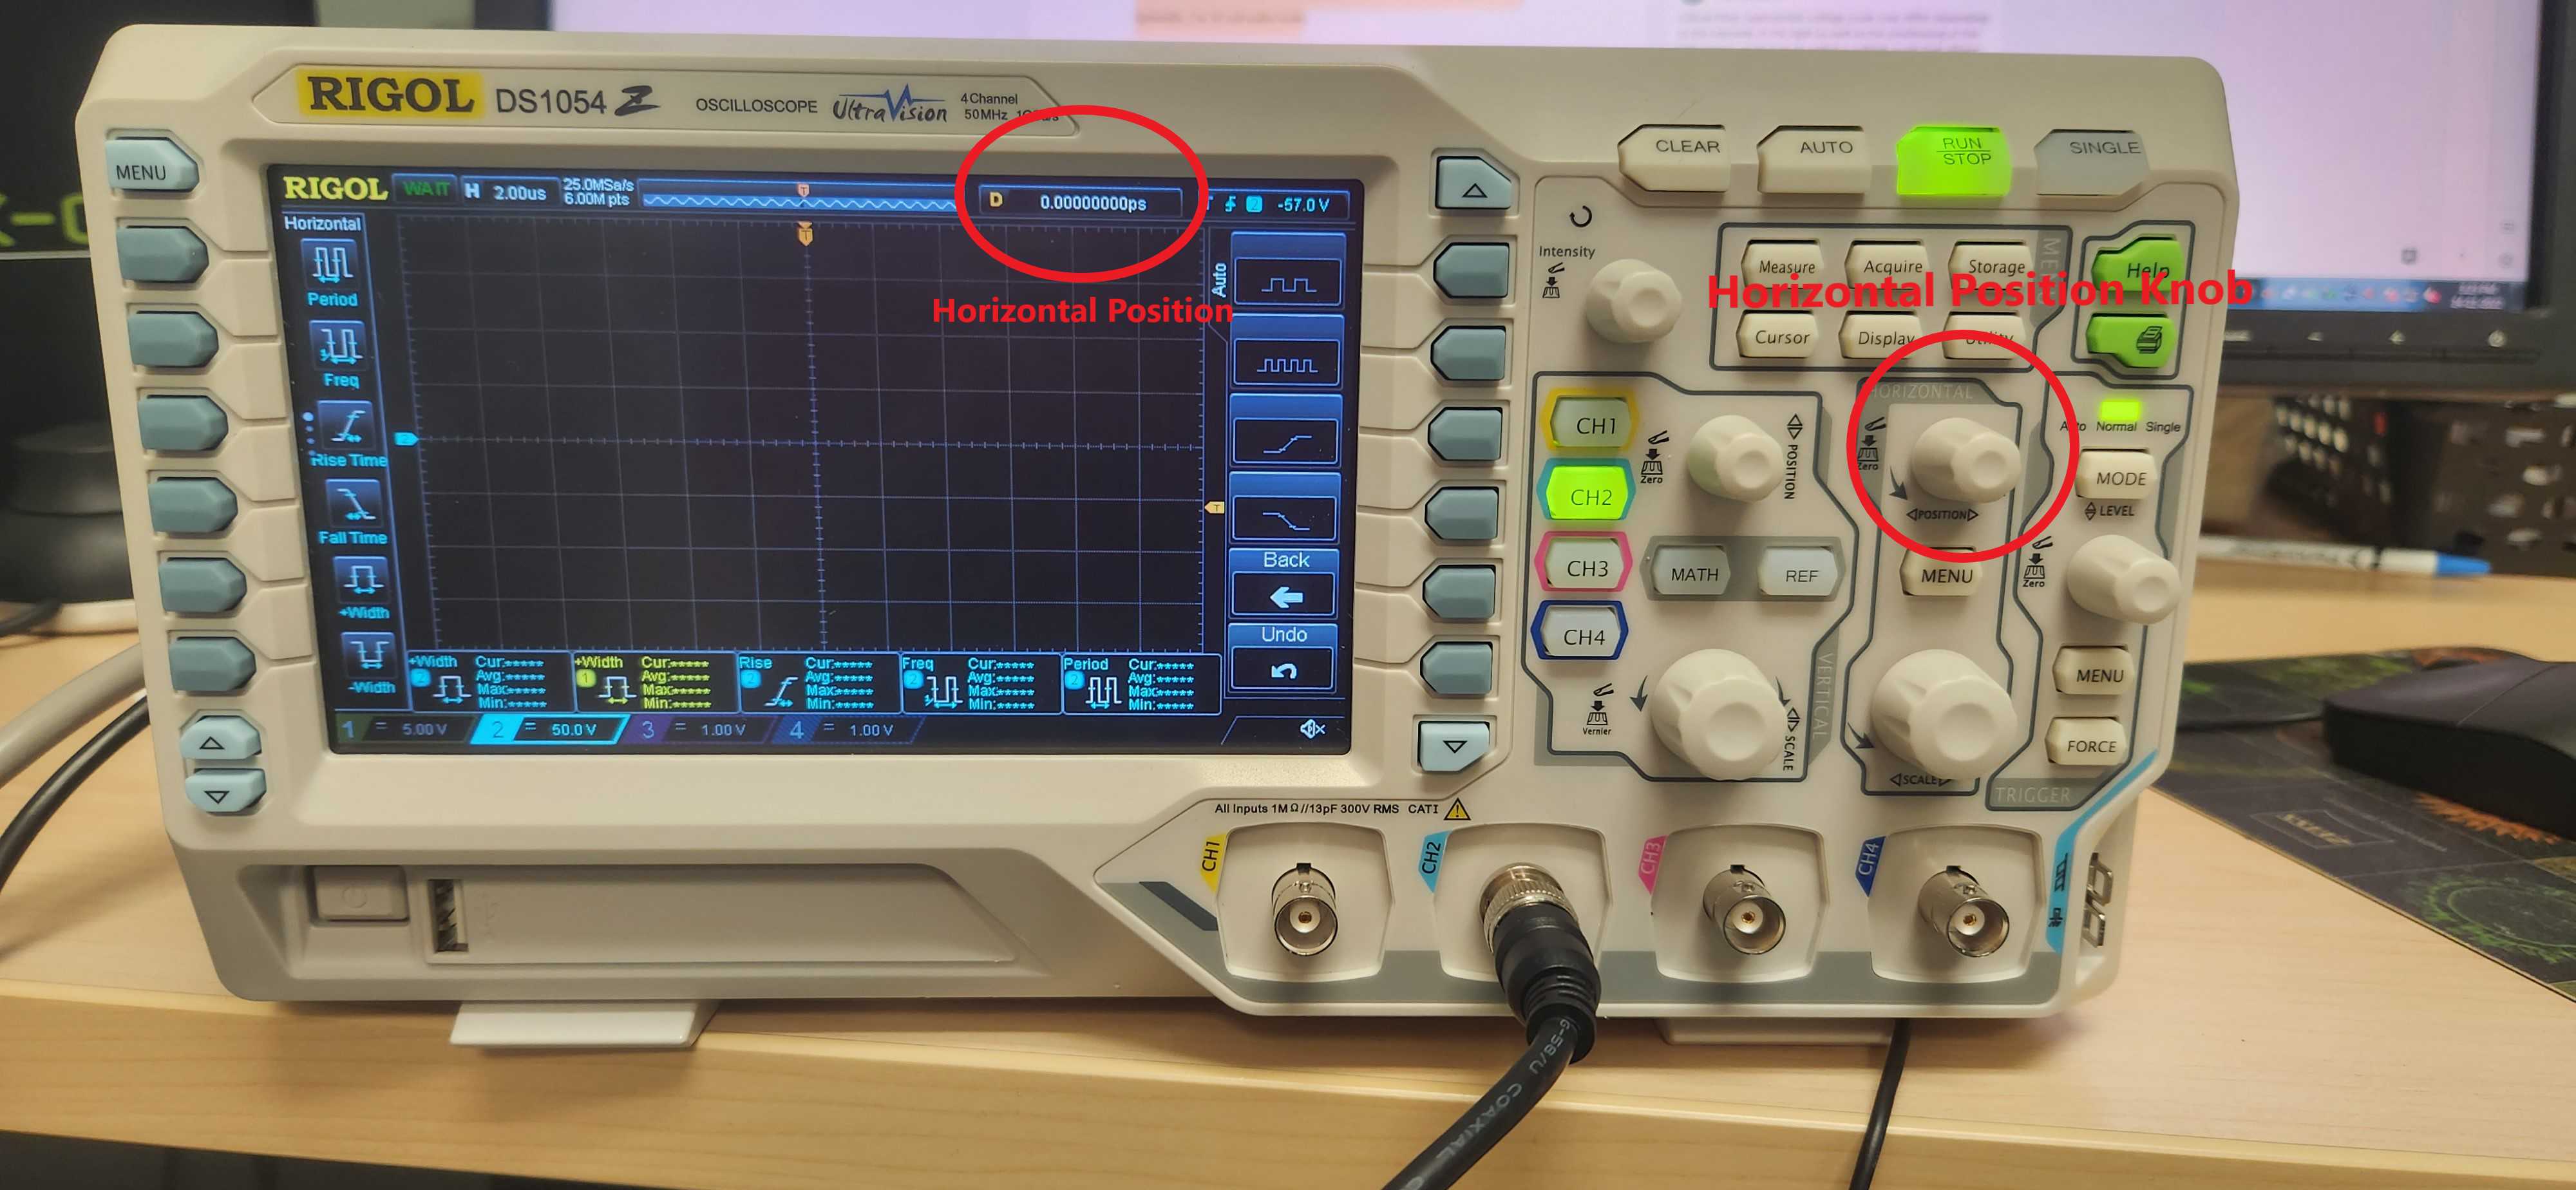
Finally, adjust the horizontal time scale such that the ramp on or ramp off is fully captured at its highest resolution (lowest time scale) and save the graph as described above. The horizontal position may also be changed at the top of the software display to center the wave.
Ensure that the horizontal position on the software matches the one on the oscilloscope hardware so that the wave is recorded properly.
To read the total illumination time for a snapshot from the raw data, convert the sequence numbers into seconds using the increment number given in the CSV file. This number represents the time scale for collection of each voltage reading. In the example below, the increment is 5.00 E-03 or 5 ms per time point. So column B can be multiplied by 5.00 E-03 to calculate the actual time of data collection. Graph the calculated seconds column vs. the VOLT column and, while looking at when the voltage is maximal, measure the width of the wave in seconds.
 indicates the time (in seconds) between sequence values under column A. Column B indicates the voltage values as measured by the oscilloscope. Note that the magnitude of the voltage values may vary depending on measurement settings such as the probe setting used (1x, 10x, etc.) and the vertical positioning.")
