High-throughput analysis of products from deconstructed nylon-6 by UHPLC-MS/MS (dMRM)
Gregg T. Beckham, Kelsey J. Ramirez, Morgan A. Ingraham, Elizabeth L. Bell
mass spectrometry
nylonase
nylon-6 deconstruction
enzymatic deconstruction
UHPLC-MS/MS of nylon-6 products
High-throughput analysis
Disclaimer
This protocol is for research purposes only.
Abstract
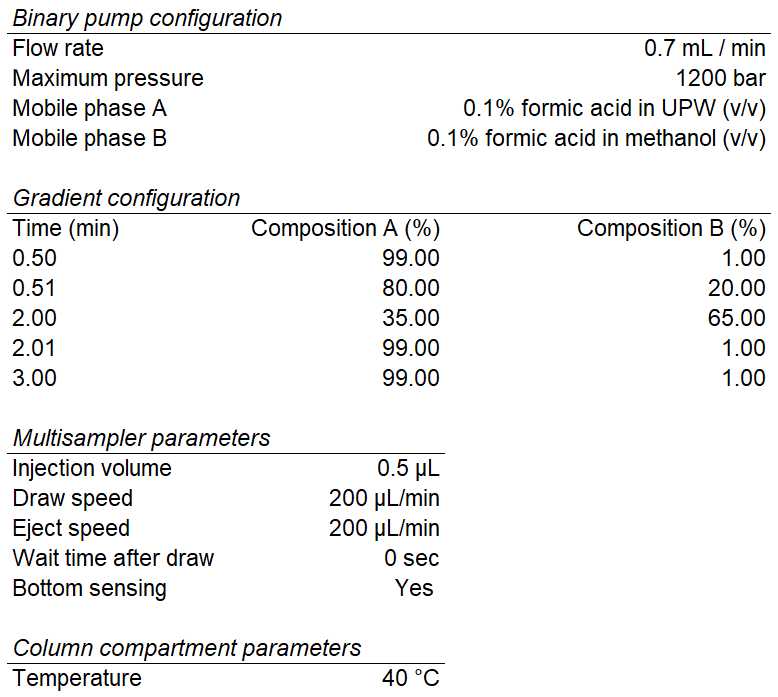
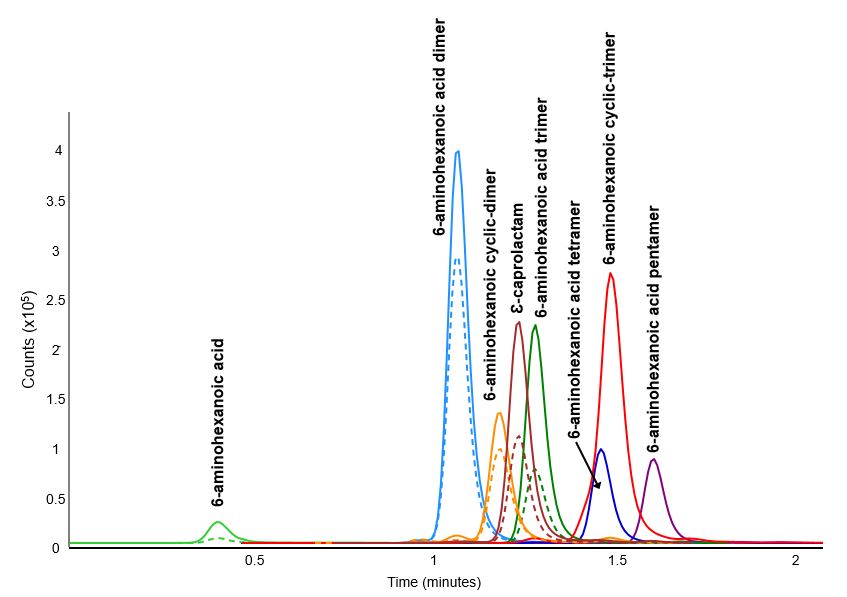
A 3 minute, high-throughput analysis method was developed for the quantitation of products produced by deconstruction of nylon-6 utilizing ultra-high pressure liquid chromatography tandem mass spectrometry (UHPLC-MS/MS) detection allowing for quantitation of all analytes in 20 samples per hour. This method employs reverse phase chromatography and dynamic multiple reaction monitoring (dMRM) in positive ion mode using electrospray ionization (ESI).
Before start
All solvents and chemicals used are listed in the ‘Materials’ section. These are excluded from in-line references to maintain clarity and keep the steps concise.
Steps
Preparation of Standards
By weight, create individual 2000 µg/mL stock solutions of all analytes listed below using ultrapure water (18.2MΩ⋅cm)(UPW) water as a diluent, except for 6-aminohexanoic acid cyclic-dimer in which methanol is used:* ɛ-Caprolactam
- 6-Aminohexanoic acid
- 6-Aminohexanoic acid dimer (6-(6-aminohexanamido)hexanoic acid)
- 6-Aminohexanoic acid trimer (6-(6-(6-aminohexanamido)hexanamido)hexanoic acid)
- 6-Aminohexanoic acid cyclic-dimer (18-diaza-29-diketocyclotetradecane)
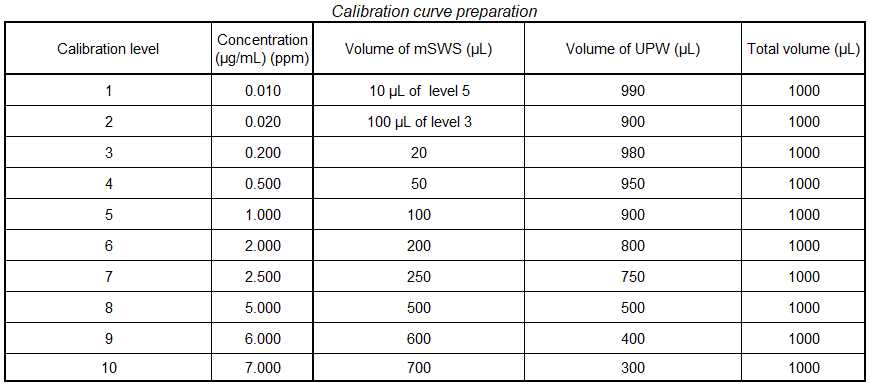
Combine the stock solutions to make a 400 µg/mL mixed standard working solution (mSWS) in UPW.
- This is accomplished by mixing equal volumes of the stock solutions of all 5 analytes
- Prior to creating the calibration curve, perform an additional dilution of the mixed standard working solution (mSWS). The final concentration will be 10 µg/mL. This can be prepared by adding 0.5 mL of the mSWS to 19.5 mL of UPW.
Sample Preparation
Ensure sample matrix is compatible with instrumentation. The calibration range for this method is between 0.01 µg/mL and 7 µg/mL. All samples should be 0.2µm filtered prior to injection. Any samples expected to have analyte concentrations that fall outside of this range should be diluted appropriately.
Note: Analyte suppression was observed in high salt containing samples. As a result, a 5x dilution was performed using methanol to precipitate the salts. The samples were then 0.2µm filtered and analyzed.
UHPLC- MS/MS Analysis
Analyze samples using an Agilent 6470A triple quadrupole mass spectrometer equipped with dual Agilent jet stream electrospray ionization (AJS ESI) utilizing the source method parameters illustrated below.
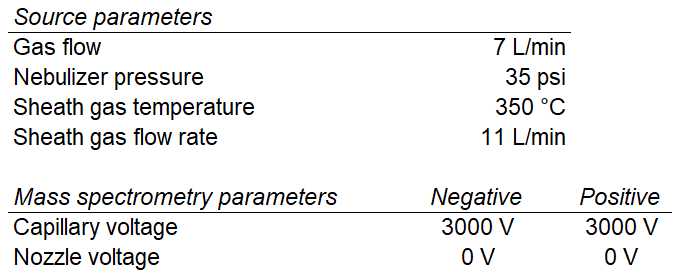
Below a table is provided with the optimized dynamic multiple reaction monitoring reactions (dMRM) as well as corresponding fragmentor voltages (V) and collision energies (CE) for the quantifying and qualifying transitions.
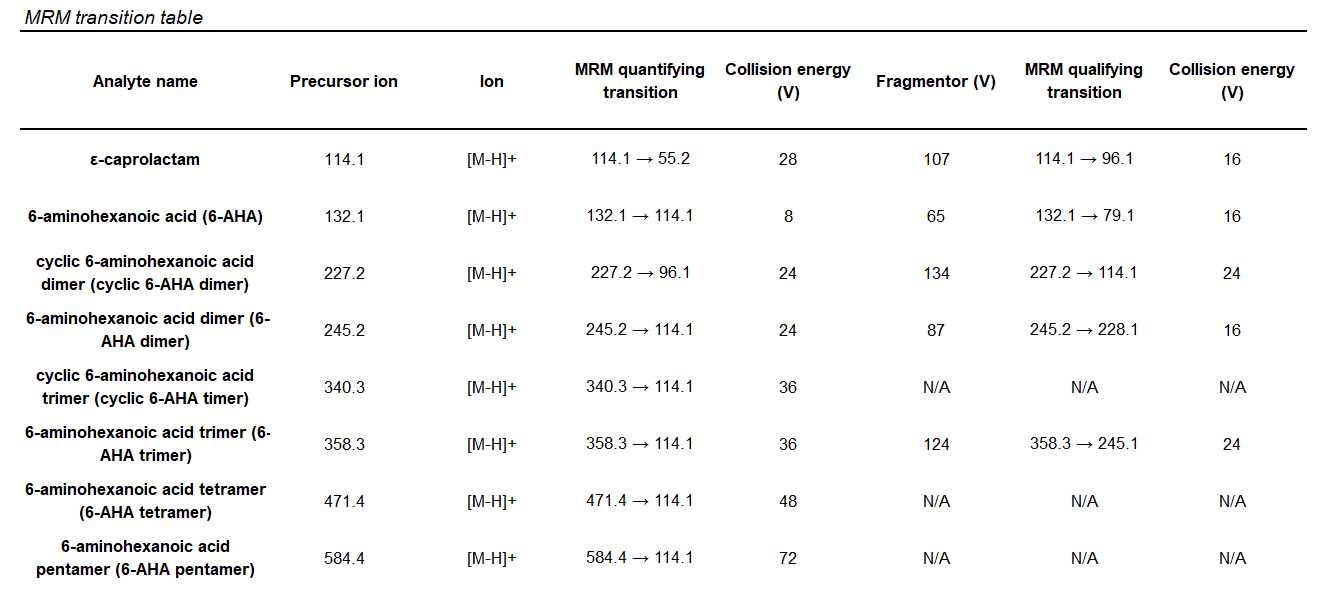
Note: Standards could not be sourced for 6-aminohexanoic acid cylic-trimer, 6-aminohexanoic acid tetramer, and 6-aminohexanoic acid pentamer. These were optimized from a sample that verified their presence by high resolution mass spectrometry ESI (HRMS-ESI).
Data Analysis and Quality Control
Data analysis completed using Agilent Quantitative Analysis for QQQ version 10.1
Quality Control
Several criteria are used to ensure instrument stability and reproducibility throughout the analysis.
- Calibration curves must have a correlation coefficient (r2) of greater than or equal to 0.995 using a quadratic or linear fit.
- 6-Aminohexanoic acid cyclic-trimer is quantified using the calibration curve of 6-aminohexanoic acid cyclic-dimer
- 6-Aminohexanoic acid tetramer and 6-aminohexanoic acid pentamer are quantitated using the calibration curve of 6-aminohexanoic acid trimer.
- A calibration verification standard (CVS) is a standard from the calibration curve that is analyzed every 20 or fewer samples to check for instrument drift. For this analysis method, acceptable CVS recovery range is within +/- 15% of the expected amount.

