Filaggrin genotyping using Taqman SNP genotyping assays
Angie Fawkes, Katarzyna Hafezi, Lee Murphy
Abstract
The FLG gene encodes the filaggrin protein which is essential for epidermal barrier formation and hydration. Mutations in the filaggrin gene are associated with a broad range of skin and allergic diseases. This protocol is used to genotype four mutations (R501X, 2282del4, R2447X and S3247X) within the FLG gene.
Steps
Prepare primers and probes
Primers are sent in a concentration of 20pmol/μL and volume 500μL. To prepare primers mix 500μL of primers at 20pmol/μL with 100μL of nuclease-free water.
To prepare probes mix an equal volume of probe with nuclease-free water (based on a probe concentration of 6,000 pmol).
Prepare reaction mix
The tables below are for one sample based on 10μL reaction volume (2μL of DNA and 8μL of reaction mix). Multiply up reaction mix by number of samples plus extra for dead-volume. Ensure a sensible amount for accurate pipetting.
(This means that for R501X and S3247X primers will be at 300nM & probes at 100nM; and for 2282del4 and R2447X - Forward and Reverse primers will be at 500nM, Inner Forward Primer 2 at 100nM & probes at 100nM).
For R501X and S3247X prepare a mastermix based on per sample volumes in the table. Prepare a separate mastermix for R501X and for S3247X:
| A | B |
|---|---|
| Reagent | Volume (μL) |
| Primer Forward | 0.03 |
| Primer Reverse | 0.03 |
| Probe 1 | 0.02 |
| Probe 2 | 0.02 |
| Taqman Genotyping Master Mix (2x) | 5 |
| Nuclease-free water | 2.90 |
For 2282del4 and R2447X prepare a mastermix based on per sample volumes in the table.
| A | B |
|---|---|
| Reagent | Volume (μL) |
| Primer Forward | 0.05 |
| Primer Reverse | 0.05 |
| Probe 1 | 0.02 |
| Probe 2 | 0.02 |
| Inner Forward Primer 2 | 0.01 |
| Taqman Genotyping Master Mix (2x) | 5 |
| Nuclease-free water | 2.85 |
Prepare reaction plate
Add 2μL of DNA at a concentration of 10ng/μL, for each sample to be genotyped, to a 384-well plate. Ensure at least 16 wells of the 384 have no DNA added for blank controls (these wells should still have reaction mix added).
PCR amplification
Create an experiment on QuantStudio5 or load an existing experiment template (EDT file) using QuantStudio Design & Analysis Software. Ensure assay file is uploaded into library. See QuantStudio user manual for details.
Load 384-well plate onto heating block ensuring plate is in correct orientation with well A1 positioned top-left.
Cycle with the following settings:
60°Cfor 0h 0m 30s
95°C for 0h 10m 0s
Then 40 cycles of
Denaturation: 95°C for 0h 0m 15s
Annealing/extension: 60°C for 0h 1m 0s
Then 60°Cfor 0h 0m 30s
Data analysis
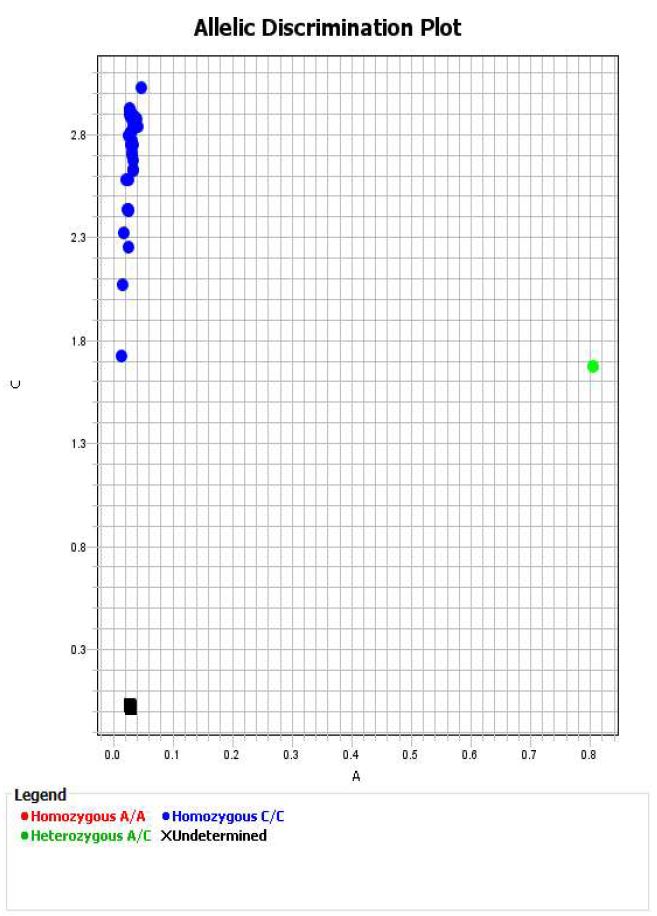
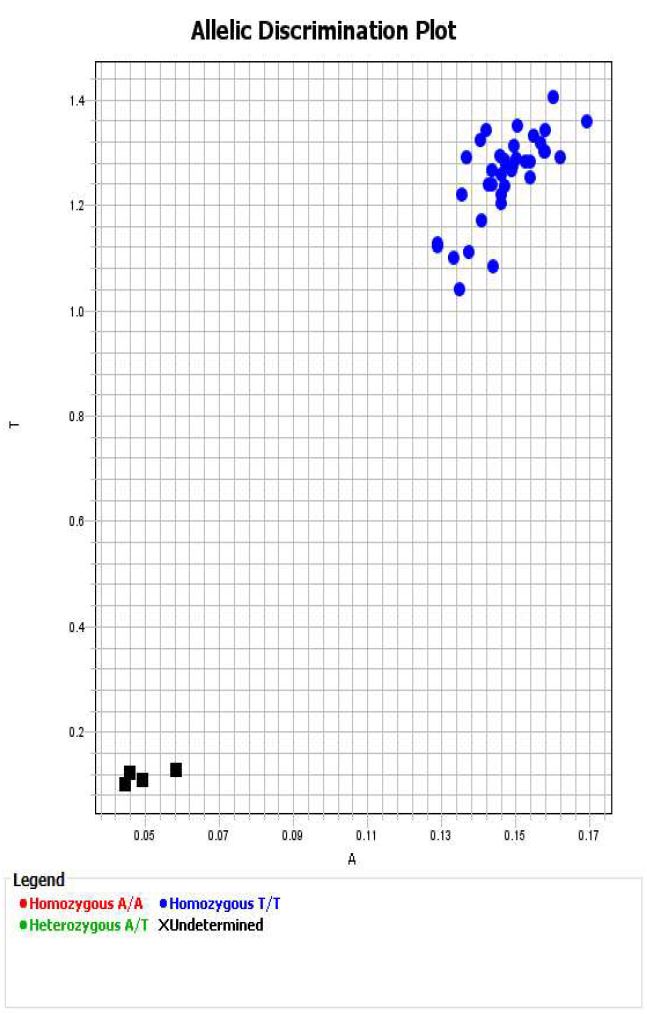
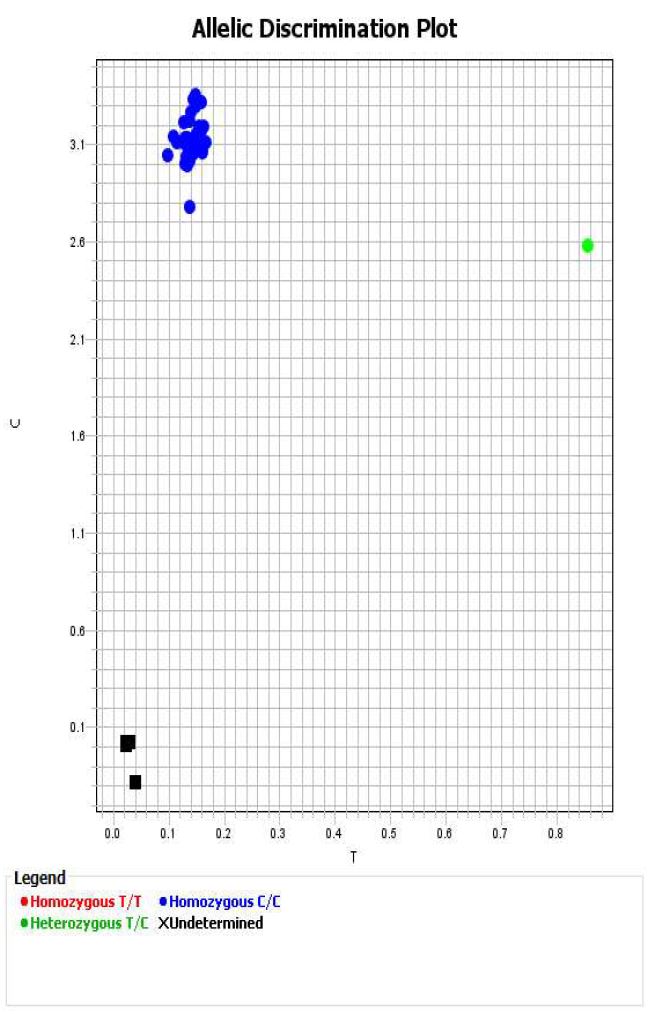
Within QuantStudio Design & Analysis Software review data to ensure clear clusters are visible and that blanks are not called.
For each genotype, export data to excel and save a copy of each allelic discrimination plot as a pdf file.
Data Report
Prepare the data summary report. Include information on scanner used, SOP, analysis software version and assays used. Detail call rates and any false call rates (blanks that gave a genotype). Return summary report with raw data (eds files), exported data (excel files) and allelic cluster plots (pdf).


