Field assessment protocol for non-destructive estimation of single- and multi-species cover crop biomass
Etienne Sutton, Jennifer Blesh
Abstract
This protocol provides step-by-step instructions for estimating cover crop biomass using ground cover photos and height measurements. Compared to traditional destructive sampling techniques, this method is an inexpensive and efficient option for monitoring cover crop biomass with relatively high accuracy. Because the field assessment requires minimal technical expertise and equipment, it is also particularly well suited for citizen science and other applied research contexts aimed at generating large, geographically distributed datasets. For instance, in a two-year study of cover crop performance in the Great Lakes region, the field assessment allowed for collecting cover crop growth data from 257 fields across six states. To validate the accuracy of the field assessment and derive relationships for converting the field assessment output into standard biomass units (e.g., kg ha-1), cover crop biomass was also destructively sampled with a quadrat from 111 of those fields. The R2 values for relationships between the field assessment output and biomass validation samples were 0.84 for cereal rye (N = 55), 0.76 for single-species cover crops more broadly (N = 73), and 0.79 for multi-species mixtures (N = 38). Linear equations were then derived for each of those cover crop subgroups to calculate biomass in kg ha-1. We recommend following a similar validation process when using the field assessment in new regions or contexts. The protocol below is divided into three sections: 1) estimating single-species cover crop biomass; 2) estimating multi-species cover crop biomass; and 3) validation procedures.
Attachments
Steps
Single-species cover crops: Field survey
Walk to a location in the first third of the field with representative cover crop growth, making sure to avoid field edges.
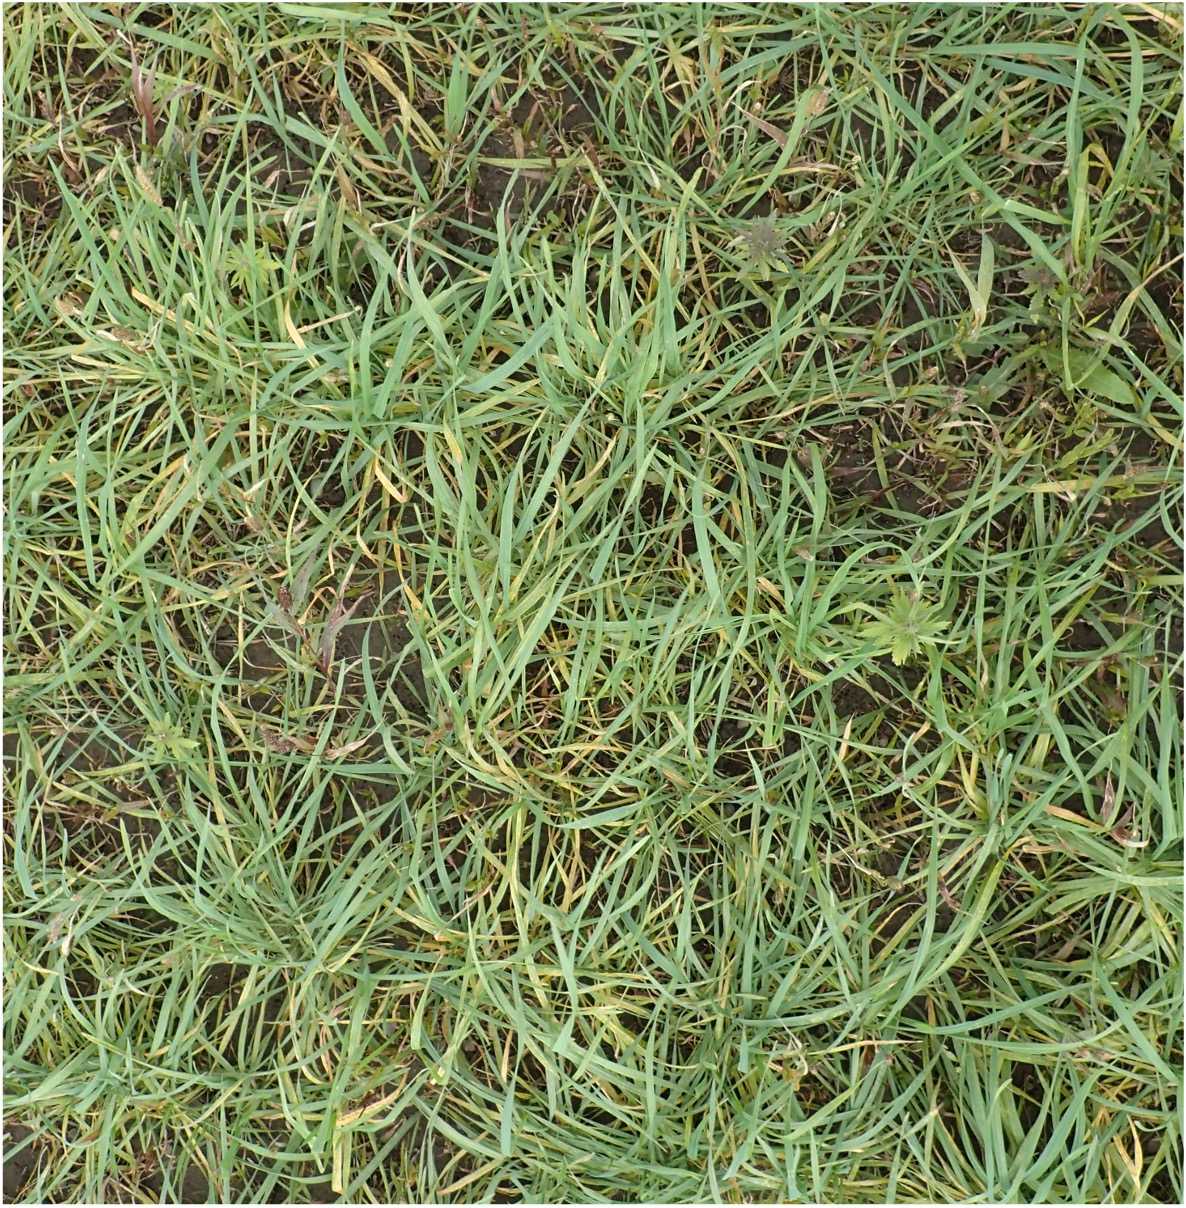
Holding your arm out parallel to the ground at shoulder height, take a photo of the cover crop canopy. The photo should be directly overlooking the cover crop, like an aerial photo (i.e., not at an angle). Make sure to avoid capturing any shadows, shoes, or other objects in the photo.

Record the amount of weed pressure at this location on a scale of 1 to 5.
Using a tape measure or other measuring device, collect and record height measurements for three average cover crop plants (in centimeters).
Move to a second location closer to the center of the field with representative cover crop growth.
Take another photo of the cover crop canopy.
Record the amount of weed pressure at this location on a scale of 1 to 5.
Collect and record height measurements for three average cover crop plants (in centimeters).
Walk to a final location in the last third of the field with representative cover crop growth.
Take another photo of the cover crop canopy.
Record the amount of weed pressure at this location on a scale of 1 to 5.
Collect and record height measurements for three average cover crop plants (in centimeters).
Single-species cover crops: Data processing
Calculate average %Cover as the mean of the values that appear in the “Cover” column.
Calculate average height as the mean of all nine height measurements.
Calculate average weed pressure as the mean of the three weed pressure rankings.
Multiply average %Cover by average height.
Multiply the resulting number from the previous step by the corresponding weed correction factor listed in the table below:
| A | B |
|---|---|
| Average weed pressure ranking | Correction factor |
| 1 | 1 |
| 1 < 2 | 0.9 |
| 2 | 0.8 |
| 2 < 3 | 0.7 |
| 3 | 0.6 |
| 3 < 4 | 0.5 |
| 4 | 0.4 |
| 4 < 5 | 0.3 |
| 5 | 0.2 |
If the cover crop is cereal rye, plug the number calculated in the previous step into the following equation to determine cover crop biomass in kg ha-1:
Multi-species cover crops: Field survey
Walk to a location in the first third of the field with representative cover crop growth, making sure to avoid field edges.
Holding your arm out parallel to the ground at shoulder height, take a photo of the cover crop canopy. The photo should be directly overlooking the cover crops, like an aerial photo (i.e., not at an angle). Make sure to avoid capturing any shadows, shoes, or other objects in the photo.
Record the amount of weed pressure at this location on a scale of 1 to 5 .
Visually estimate and record the relative proportion of each species in the mixture (or the four most dominant species if there are more than four) at this location (e.g., SpA = 0.75, SpB = 0.25).
For each of the species in the previous step, record the heights of three average individuals using a tape measure or other measuring device (in centimeters).
Move to a second location closer to the center of the field with representative cover crop growth.
Take another photo of the cover crop canopy.
Record the amount of weed pressure at this location on a scale of 1 to 5.
Visually estimate and record the relative proportion of each species in the mixture (or the four most dominant species if there are more than four) at this location.
For each of the species in the previous step, record the heights of three average individuals (in centimeters).
Walk to a final location in the last third of the field with representative cover crop growth.
Take another photo of the cover crop canopy.
Record the amount of weed pressure at this location on a scale of 1 to 5.
Visually estimate and record the relative proportion of each species in the mixture (or the four most dominant species if there are more than four) at this location.
For each of the species in the previous step, record the heights of three average individuals (in centimeters).
Multi-species cover crops: Data processing
Calculate average %Cover as the mean of the values that appear in the “Cover” column.
Calculate average height for each species (hgt) as the mean of all nine height measurements for that species.
Calculate average proportion for each species (prop) as the mean of the three proportion estimates for that species.
Plug the values from the previous three steps into the following expression:
%Cover x [(SpA hgt x prop) + (SpB hgt x prop) + (SpC hgt x prop) + (SpD hgt x prop)]
Calculate average weed pressure as the mean of the three weed pressure rankings.
Multiply the resulting number from step 39 by the corresponding weed correction factor listed in the table below:
| A | B |
|---|---|
| Average weed pressure ranking | Correction factor |
| 1 | 1 |
| 1 < 2 | 0.9 |
| 2 | 0.8 |
| 2 < 3 | 0.7 |
| 3 | 0.6 |
| 3 < 4 | 0.5 |
| 4 | 0.4 |
| 4 < 5 | 0.3 |
| 5 | 0.2 |
Plug the number calculated in the previous step into the following equation to determine cover crop biomass in kg ha-1:
Validation procedures: Biomass sampling
Toss the quadrat on the ground.
Clip all aboveground biomass of plants rooted within or directly under the quadrat and place into a paper bag labeled with the field site, species names, and replicate (e.g., rep "a"). Weeds can be grouped into one bag, but all other species should be placed into separate bags.
Move to a second location closer to the center of the field with representative cover crop growth.
Toss the quadrat on the ground.
Collect all aboveground biomass within or underneath the quadrat as in step 45, using new paper bags labeled with the field site, species names, and replicate (e.g., rep "b").
Walk to a final location in the last third of the field with representative cover crop growth.
Toss the quadrat on the ground.
Collect all aboveground biomass within or underneath the quadrat as in step 45, using new paper bags labeled with the field site, species names, and replicate (e.g., rep "c").
Dry all samples at 60°C for a minimum of 48h 0m 0s.
Once dried, use a scale to weigh each sample (in grams), making sure to subtract out the bag weight; record weights to two decimal places.
Validation procedures: Data processing
For each species in each field, calculate the average mass as the mean of the three sample replicates.
Calculate biomass in kg ha-1 with the following operation:
For fields with multiple species, calculate total cover crop biomass by summing the biomass of all species (excluding weeds).
Using the field assessment output (as calculated in “Single-species cover crops” step 18 or “Multi-species cover crops” step 41 above) as the independent variable and total cover crop biomass as the dependent variable, fit a regression model to the data, with fixed or random effects included as needed (e.g., year, farm).
Use the resulting regression equation to calculate cover crop biomass in kg ha-1 for all other fields for which the field assessment was performed.
Additional steps for assessing data quality:
For multi-species cover crops, the relative proportion of each species from the biomass validation sampling can be compared to the proportions reported in field assessment to assess the accuracy of the visual estimates.
The weed biomass data from validation sampling can also be used to verify the accuracy of weed pressure rankings in the field assessment.
