Cryo-electron tomography of thinned synapses
Anna Siegert, Arsen Petrovic, Thanh Thao Do, Florelle Domart, Rubén Fernández-Busnadiego
Abstract
Here we provide a protocol for cryo-electron tomography (cryo-ET) of thinned synapses within intact rat primary neuron cultures. This workflow relies on cryo-focused-ion-beam (FIB) milling to enable unrestricted access to synapses within neuronal cultures and to achieve samples sufficiently thin (~150 nm) for high resolution cryo-ET imaging. This protocol allows targeting of synapses with and without cryo-fluorescence light microscopy (cryo-FLM) correlation for FIB milling and cryo-ET.
Attachments
Steps
Culturing primary rat hippocampal neurons on EM grids - Preparation of the EM grids
Glow discharge the EM grids (SiO2 film on Au mesh, R 1/2 or R 2/2, Quantifoil) with a plasma cleaner (0h 0m 30s, medium voltage) followed by 0h 30m 0s under UV light.
Place 4 grids in a 35 mm dish. Glass bottom dishes or dishes with 4 inner rings can be used.
Coat the EM grids with 1mg/mL poly-L-lysine 2h 0m 0s at 37°C and 5 % CO2.
Wash 3 times with sterile water and keep the grids in sterile water at 4°C before use.
Culturing primary rat hippocampal neurons on EM grids - Primary hippocampal neuron co-cultures with glia
Prepare a hippocampal cell suspension from E19 rat embryos.
Dilute the hippocampal cell suspension to a concentration of 200-300,000 cells per mL in DMEM10%FCS.
For the glass bottom dish, replace the water from the dish with 500µL of pre-warmed
DMEM10%FCS. For the dishes with the 4 inner rings immediately plate the cells after
removing the water.
Plate 100µL of cell suspension dropwise on each EM grid. Incubate at 37°C and 5 %
C22.
After 2h 0m 0s, add 500µL of pre-warmed DMEM10%FCS per dish.
Incubate 2h 0m 0s at 37°C and 5 % CO2.
The following day, replace the medium with 2mL of pre-warmed Neurobasal plus medium supplemented with 2 % B27 plus and 1 % Glutamax.
Live staining with Synaptotagmin1 antibodies
Dilute α-Syt1-ATTO647N at 1:500 in medium from the culture dish containing EM grids.
Remove all the remaining medium from the culture dish and replace by the diluted antibody in culture medium.
Incubate for 30-45 min at 37°C and 5 % CO2 to allow the uptake of α-Syt1-ATTO647N into pre-synapses.
Wash twice with Neurobasal plus medium supplemented with 2 % (v/v) B27 plus and 1 % (v/v) Glutamax, pre-incubated at 37°C and 5 % CO2.
Plunge freezing
Remove all the medium and replace it by 5 % (v/v) glycerol in Tyrode solution prewarmed at 37°C and incubate for 2-5 min.
Immediately after glycerol incubation, plunge freeze grids in a mixture of liquid ethanepropane (37 % ethane, 63 % propane) cooled at -195°C.
Cryo-FLM for identification of synapse rich regions
Acquire an overview of the grid in both bright field and fluorescence channels.
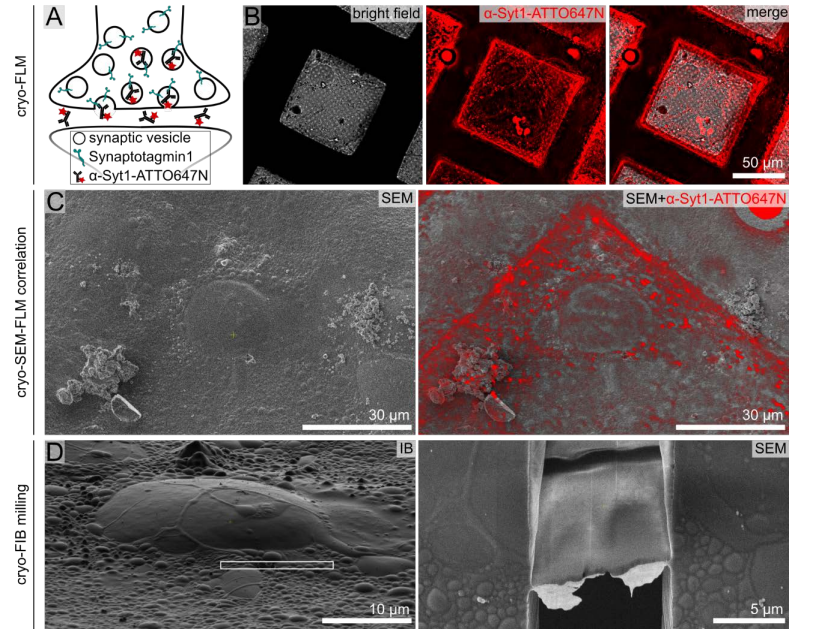
Identify squares with cell bodies using bright field and fluorescence data (Fig. 1B).
Acquire z-stacks of the squares containing cell bodies deemed suitable for FIB milling (cell bodies should not be localized on the grid bar).
Overlay z-stacks (or maximum intensity projections (MIPs) of the z-stacks) with the scanning electron microscopy (SEM) images prior to FIB milling and position the lamella milling pattern according to α-Syt1-ATTO647N positive puncta around the cell body (Fig. 1C, D).

FIB milling
Identify neuronal cell bodies in SEM and ion-beam (IB) induced images. Neurons at DIV15 appear as bulges of 15-30 µm diameter with processes surrounding the soma (Fig. 2A).

Place the lamella milling patterns in front or to the side of the cell body (Fig. 2A), in the vicinity of the synaptic rich region. This avoids having the lamella going directly through the cell body, thus increasing the chance of capturing synapses (Fig. 2B, C, D).
Mill at an angle of 9-12 ° and a lamella width of 12-20 µm.
Tomogram acquisition
The presynaptic terminus should contain densely packed synaptic vesicles with an average radius between 30-40 nm. Often, one should be able to observe the "active zone", the region containing tethered synaptic vesicles in close proximity to the plasma membrane. Rarely, membrane fusion events can also be observed, whereby the synaptic vesicle membrane is connected to the plasma membrane. Very often, a synaptic vesicle cluster is associated with microtubules. Additionally, a clearly distinguishable mitochondrion is often seen. Depending on the lamella thickness, actin filaments are also evident.
A synaptic cleft of approximately 20-30 nm containing dense material should also be apparent.
Contrary to the presynaptic terminus, the postsynaptic region is relatively featureless. The postsynaptic density (PSD), often a characteristic feature in conventional EM studies, is less apparent. The postsynaptic region often appears dense (the grey scale value is darker). Large macromolecular complexes like ribosomes or actin filaments are often present.

