Calculating the Cause of Death Association Indicator and the Contributing Cause of Death Association Indicator in Mortality Analysis
Agnieszka Fihel, Anna Janicka
COVID-19
multiple causes of death
causes of death
mortality
death certificate
comorbidity
Cause of Death Association Indicator
Abstract
The protocol describes the input data and the method used to calculate the Cause of Death Association Indicators and the Contributing Cause of Death Association Indicators in the analysis of mortality. These indicators measure the strength and statistical significance of associations between causes of death jointly reported on death certificates. The protocol applies to the study of COVID-19-related deaths in Central Europe.
Attachments
Steps
Input data
The input data consists of death counts aggregated by country, year, sex, age group (30-59 and 60+), the underlying cause of death u , and cause c reported in any section of the death certificate other than the underlying cause of death. In practice, causes u and c refer to groups of causes of death, aggregated according to the grouping presented in Attachment 1.
Example of an aggregate: deaths of women in Poland in 2021, at the age of 60 and over, due to COVID-19 (ICD-10 codes: from U07.1 to U10.9) as the underlying cause of death and well-defined infectious and parasitic diseases (ICD-10 codes: A00-B99 excl. A40-A41, A48-A49, B34, B97-B99) mentioned in a section other than the underlying cause of death.
Cause of Death Association Indicator
The CDA indicator was originally proposed in:
Désesquelles A, Salvatore MA, Frova L, Pace M, Pappagallo M, Meslé F, et al. Revisiting the mortality of France and Italy with the multiple-cause-of-death approach. Demographic Research. 2010;23:771–806.
The formula is as follows:
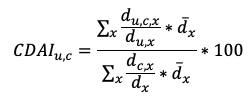
where d stands for the number of deaths, subscript u refers to a given underlying cause of death, subscript c refers to a given comorbidity or complication, and subscript x stands for age, and

stands for the average number of deaths at age x in all countries and years of the analysis. This average is used to compare CDAIs between countries where the distribution of deaths by age is different.
In this study, cause u in CDAIs was COVID-19.
Data used to calculate CDAIs for Poland can be made available upon request.
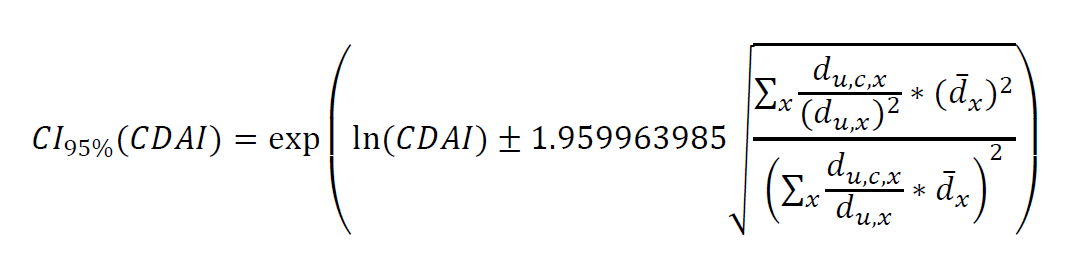
95% confidence intervals for CDAIs were calculated under the assumption that the observed number of deaths follows a Poisson distribution, with the variance approximated by the number of deaths.
A CDAI significantly higher than 100 indicates that complication or comorbidity c is more common than expected in deaths due to UCoD u .
Contributing Cause of Death Association Indicator (CCDAI)
The CCDA indicator was originally proposed in: Fihel et. al. 2024, submitted to PlosOne.
The formula is as follows:

where d stands for the number of deaths, subscript u refers to a given underlying cause of death, subscript c refers to a given comorbidity (in this study: COVID-19), subscript x stands for age and

is the average number of deaths at age x with comorbidity c (COVID-19). As in the case of CDAIs, the average count of deaths (with comorbidity c ) is used to standardise the indicators.
Data used to calculate CCDAIs for Poland can be made available upon request.
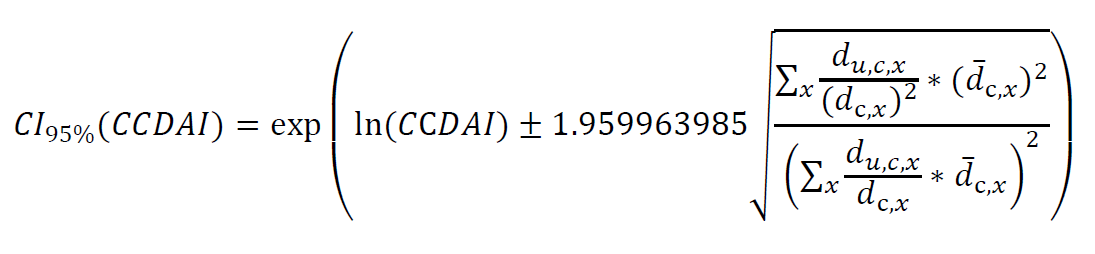
95% confidence intervals for CCDAIs were calculated under the assumption that the observed number of deaths follows a Poisson distribution, with the variance approximated by the number of deaths.
A CCDAI significantly higher than 100 indicates that underlying cause u is more common than expected in deaths with comorbidity c.
