Approximating silica uptake in diatoms using PDMPO and flow cytometry
Phoebe Argyle, Jana Hinners, Nathan G. Walworth, Naomi M. Levine, Martina A. Doblin, Sinead Collins
Abstract
A protocol to quantify relative change in uptake of silica by diatoms using the proxy stain PDMPO.
This protocol is based on methods developed in:
Mcnair, H. M., Brzezinski, M. A., and Krause, J. W. (2015). Quantifying diatom silicification with the fluorescent dye, PDMPO. Limnol. Oceanogr. Methods 13, 587–599. doi: 10.1002/lom3.10049
Mcnair, H. M., Brzezinski, M. A., and Krause, J. W. (2015). Quantifying diatom silicification with the fluorescent dye, PDMPO. Limnol. Oceanogr. Methods 13, 587–599. doi: 10.1002/lom3.10049
Leblanc, K., and Hutchins, D. A. (2005). New applications of a biogenic silica deposition fluorophore in the study of oceanic diatoms. Limnol. Oceanogr. Methods 3, 462–476. doi: 10.4319/lom.2005.3.462
Baker, K. G., Robinson, C. M., Radford, D. T., Mcinnes, A. S., Evenhuis, C., and Doblin, M. A. (2016). Thermal performance curves of functional traits aid understanding of thermally induced changes in diatom-mediated biogeochemical fluxes. Front. Mar. Sci. 3:44. doi: 10.3389/fmars.2016.00044
This protocol is contained in:
Argyle, P. A., Hinners, J., Walworth, N. G., Collins, S., Levine, N. M., & Doblin, M. A. (2021). A high-throughput assay for quantifying phenotypic traits of microalgae. Frontiers in microbiology , 12 , 706235.
Steps
Stock solution of PDMPO
Create a stock solution of PDMPO (2-(4-pyridyl)-5-((4-(2-dimethylaminoethylaminocarbamoyl)methoxy)phenyl)oxazole), also sold as LysoSensorTM Yellow/Blue DND-160, of 12.5micromolar (µM) by diluting the 1millimolar (mM) purchased solution in Milli-Q water.
Sample culture and fix for cell counts
Take a 200µL aliquot of each experimental culture/well (if growing in well-plates) and transfer into a 96 well round-bottomed plate to count via flow cytometry (see step 6).
Equipment
| Value | Label |
|---|---|
| 96 Well TC-Treated Microplates | NAME |
| Microplate | TYPE |
| Corning® | BRAND |
| CLS3799-1EA | SKU |
Initiate the assay
Transfer 2 500µL aliquots of culture into a 48-well tissue culture plate. One to act as a control, the other to be treated with PDMPO.
Add 5µL of the PDMPO stock made in step 1 to the treatment wells. This results in a final concentration of 0.125micromolar (µM)
Seal the plates with a sealing membrane and agitate gently to ensure even mixing of the stain.
Equipment
| Value | Label |
|---|---|
| Breathe-Easy® sealing membrane | NAME |
| Plate seal | TYPE |
| Breathe-Easy® | BRAND |
| Z380059-1PAK | SKU |
Initiatial cell counts and background fluorescence
Using a flow cytometer, count the concentration of the culture at T0 from the fixed aliquot using the protocol outlined below.
End the assay
24 hours after the intiation of the assay, remove plates from the incubator and aliquot 200µL of each culture (stained and unstained) into a round-bottomed 96 well plate for flow cytometry. Use a scalpel blade to slit the plate seal over each well.
Equipment
| Value | Label |
|---|---|
| 96 Well TC-Treated Microplates | NAME |
| Microplate | TYPE |
| Corning® | BRAND |
| CLS3799-1EA | SKU |
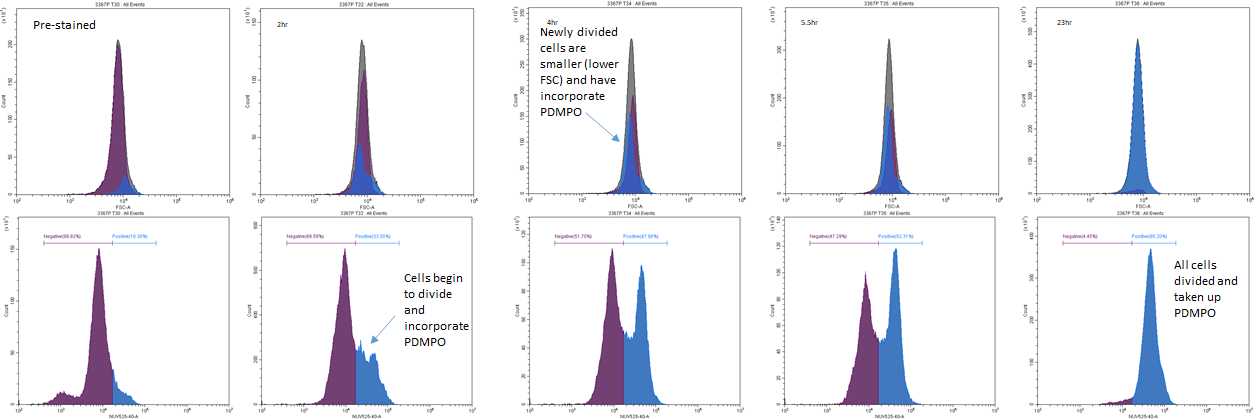
Measure the PDMPO fluorescence of the stained and unstained cells using the flow cytometer, measuring at least 200 cells. PDMPO fluorescence is quantified using the near UV channel (275 nm excitation/490-530 nm emission).
Also record the cell concentration.
Calculations
For the control samples:
Measure the median PDMPO fluorescence of at least 200 cells for each sample using the same method as in step 8.
Calculate the growth rate of the unstained cells over 24 hours using the equation:
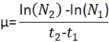
where N is the number of cells per mL at time 2 (24 hours) and time 1 (initiation) and t2 and t1 are 1 and 0 (time in days).
For the stained samples:
Measure the median PDMPO fluorescence of at least 200 cells for each sample using the same method as in step 8.
Calculate the difference in median fluorescence between the stained and unstained cells after 24 hours.
To calculate the metric, use the following equation: