Analysis of glycosphingolipids from animal tissues
David A Priestman, Reuben Bush, Danielle te Vruchte, Kerri-Lee Wallom, María E Fernández-Suárez, Frances M Platt, Marya Sabir
Abstract
Interest in the role of cellular glycosphingolipids (GSLs) in health and disease led to us developing a sensitive method to analyse the full complement of GSL structures present in mammalian cells, fluids and tissues. The original qualitative method we developed was published in 2004 and measured the oligosaccharides selectively released from glycosphingolipids using a ceramide glycanase enzyme derived from the medicinal leech. We have now updated and refined this protocol with the focus on achieving sensitive and reproducible quantitation of GSLs in animal tissues. The method uses the fluorescent compound anthranilic acid (2-AA) to label oligosaccharides prior to analysis using normal-phase high-performance liquid chromatography. The labelling procedure is rapid, selective, and easy to perform. With the inclusion of a 2AA-labelled chitotriose calibration standard, it is possible to obtain accurate and reproducible molar quantities of individual GSL species.
Before start
Check that you have the required reagents, solvents, chemicals, equipment and PPE.
Steps
GSL preparation from animal tissues
Homogenise tissue in ddH2O yielding tissue concentration of 25mg tissue (wet weight) per 1mL ddH2O.
Measure protein concentration using the Bicinchoninic acid assay (BCA) method in triplicate at 2 fold dilution (repeat if triplicate values are not in agreement).
Using determined protein concentrations, prepare sample as 200µg protein in 200µL ddH2O in a 1.5 ml screw-cap tube.
Add 0.8mL of chloroform/methanol (1:2, v/v) to give (C/M/W 4:8:3 final).
Vortex.
Leave at 4°C.
Vortex.
Centrifuge at 16,000 x g for 0h 10m 0s at 4Room temperature.
Transfer supernatant (about 1mL) to new tube and separate into two phases: by adding 0.2mL PBS and then 0.2mL chloroform.
Vortex.
Centrifuge at 16,000 x g for 0h 10m 0s at room temperature.
Remove very carefully the lower phase to a new tube and retain the upper phase.
Dry down the lower phase under a stream of (oxygen-free) nitrogen in heating block (42°C).
When dry, re-suspend the lower phase in 20µL chloroform/methanol (1:3).
Add upper phase to lower phase and vortex.
Pre-equilibrate C18 columns (telos, Kinesis, UK) with 4 x 1mL methanol and 3 x 1mL deionised water.
Load lower/upper phase mix onto column, let drip through gravity flow.
Rinse sample tube with 1mL water, apply to column to wash.
Wash column with 3 x 1mL water.
Elute GSLs into a new tube with:
2mL chloroform/methanol (98:2). Push through first 0.5mL. You can use syringe with adapter that fits into top of column.
2mL chloroform/methanol (1:3).
1mL methanol.
Vortex and leave 0h 10m 0sat 4°C or carry on to enzymatic digestion.
GSL digestion with EGC’ase I
Vortex (5mL, C18) and dry down samples under a stream of nitrogen in heating block (42°C).
When about 150µL sample remaining, transfer to 1.5mL screw-cap tube.
Rinse sample tube with 200µL C:M 2:1, vortex and combine with the rest of the sample in the screw-cap tube.
Rinse sample tube with 200µL chloroform, vortex and combine with the rest of the sample in the screw-cap tube.
Dry down, under a slow stream of nitrogen in heating block (42°C).
Re-suspend in 50µL C:M 2:1, vortex, dry down under a very slow stream of nitrogen.
Add 90µL enzyme/buffer to each sample and vortex:
rEGCase : 5µL enzyme (stored in freezer) plus 85µL buffer per sample.
Incubate at 37°C for 16h 0m 0s.
2AA labelling of glycans released from GSLs
Add 310µL labelling mix to the 90µL sample (digest) in 1.5mL screw-cap tube.
Incubate in oven at 80°C for 1h 0m 0s, vortexing at 0h 30m 0s.
Allow to cool to 80Room temperature.
Add 1mL acetonitrile:water (97:3).
Transfer from screw-cap tube to 15mL tubes.
Rinse screw-cap tube with 2 x 1mL acetonitrile:water (97:3) and add to 15mLtube.
Pre-equilibrate 50 mg Discovery® DPA-6S SPE Tube (supplied by Sigma-Aldrich) with:
1mL acetonitrile
2 x 1mL water
2 x 1mL acetonitrile
Apply samples (3.4mL) to equilibrated DPA-6S columns, let drip through gravity flow.
Wash columns with acetonitrile:water (95:5) → add 1mL into the 15mL tubes to wash and add to columns, and then add 3 x 1mL acetonitrile:water (95:5) directly onto the columns.
Elute with 600µL water into new tubes.
Add 60µL:140µL (sample:acetonitrile) to HPLC vials and vortex.
For HPLC, inject 5µL-50µL.
DPA-6S eluate is stable stored at -20°C.
HPLC protocol
Purified 2AA-labeled oligosaccharides are separated and quantified by normal-phase high-performance liquid chromatography (NP-HPLC) as previously described (Neville et al. , 2004, see the reference below).
The HPLC system consists of a Waters Alliance 2695 separations module and an in-line Waters 2475 multi λ-fluorescence detector set at Ex λ360 nm and Em λ425 nm.
The solid phase used is a 4.6 × 250 mm TSK gel-Amide 80 column maintained at 30°C (Anachem, Luton, UK).
The mobile phases are acetonitrile (solvent A), de-ionised water (solvent B) and 100millimolar (mM) ammonium acetate, 3.85 (solvent C).
Starting conditions are 71.6% solvent A. 8.4% solvent B and 20% solvent C at 0.8 mL/min constant flow-rate for 6 mins. 0h 6m 0s
The gradient is developed from 6 min to 35 min by increasing solvent B from 8.4% to 27.2% with concomitant decrease in solvent A from 71.6% to 52.8 %. 0h 29m 0s
From 35 to 37 min solvent B is increased to 57% and solvent A reduced to 23%, then maintained for 2 min up until 39 min. 0h 4m 0s
Between 39 and 41 min the solvent ratios are returned to the starting conditions and then maintained for 1 min. 0h 3m 0s
At 42 mins the flow-rate is increased to 1.2 mL/min and maintained for 12 min up to 54 min. 0h 12m 0s
Between 54 and 60 min the flow-rate is gradually returned to 0.8 mL/min. 0h 6m 0s
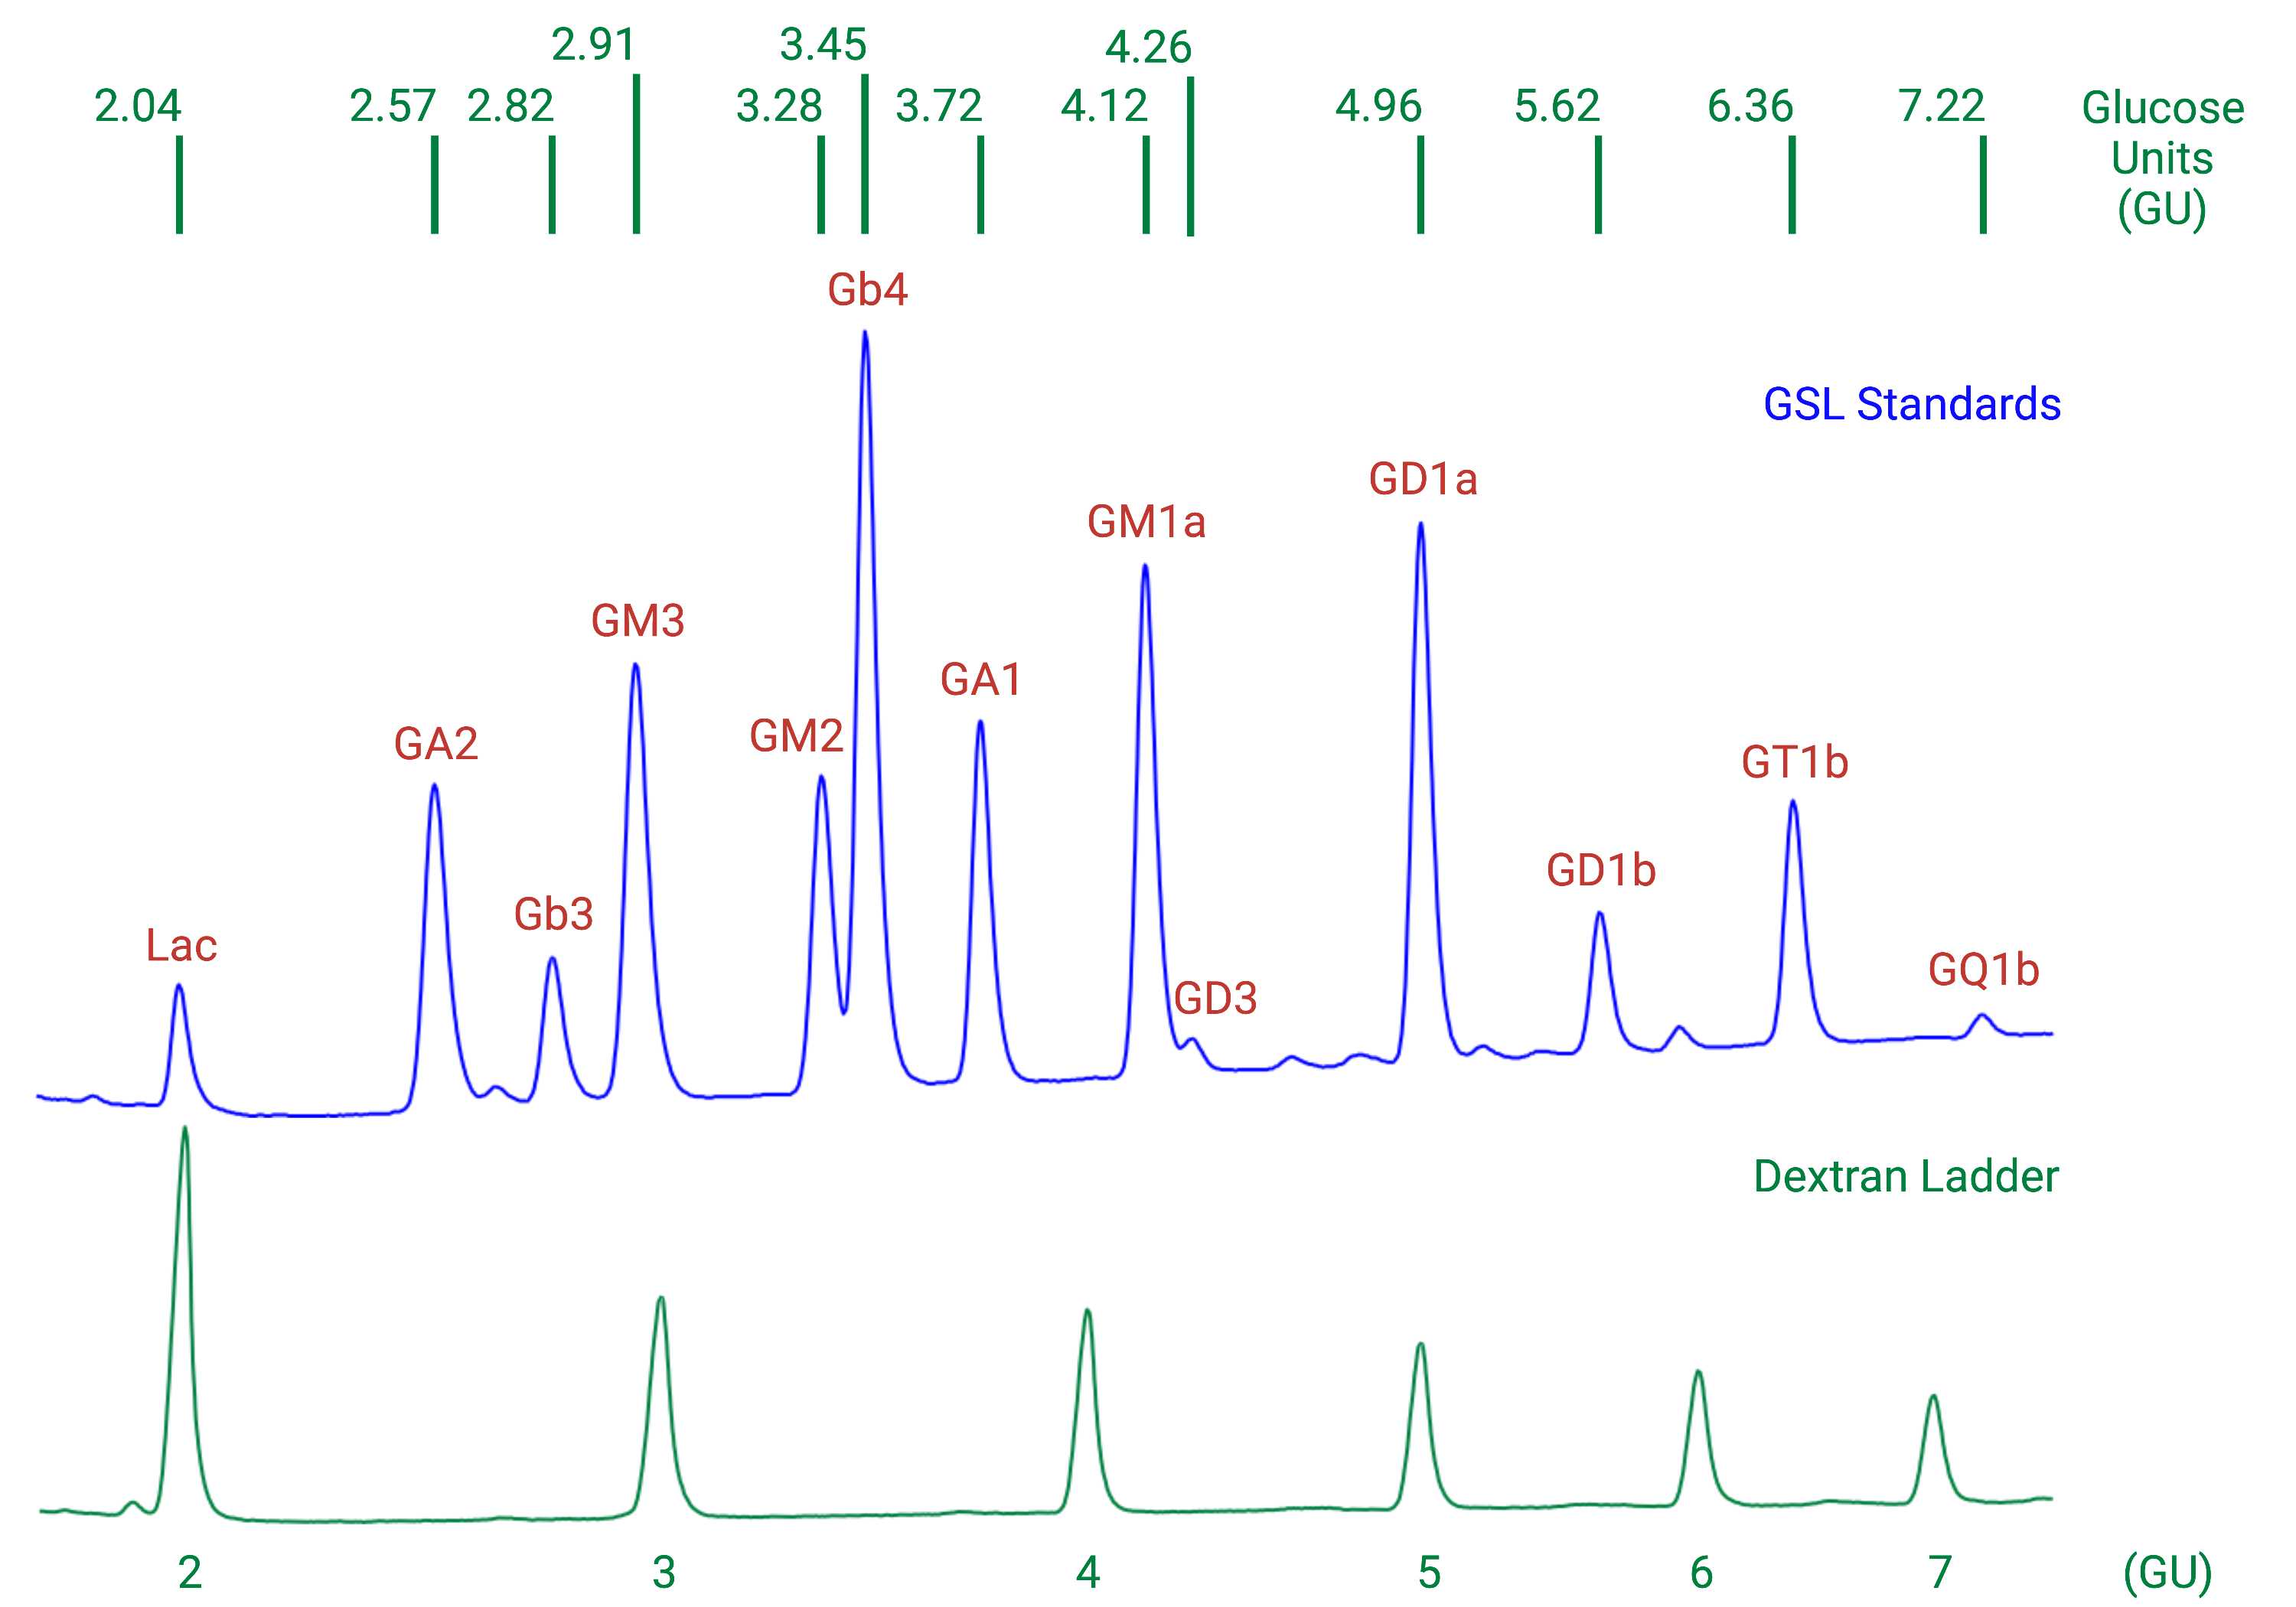
Individual GSL species are identified by their glucose unit values (GUs), calculated with the HPLC Empower software using a homopolymer dextran ladder (Fig. 1).
To help identify GSL peaks in the samples, compare the GUs of the peaks in the samples with those in a GSL standard mix.
Prepare a mixture of commercially available authentic GSLs in a screw-cap tube:
50µL Matreya Neutral GSL mix Cat No 1505 (Glc-Cer, Lac-Cer, Gb3, Gb4) 1.0 mg/ml
100µLMatreya Ganglioside mix Cat No 1510 (Lac-Cer, GM3, GD3) 0.5 mg/ml
100µL Matreya Ganglioside mix Cat No 1511 (GA1, GM1a, GD1a, GD1b,GT1b) 0.5 mg/ml
30µLMatreya GM2 Ganglioside Cat No 1502 (GM2) 0.5 mg/ml
30µLSigma Asialo-GM2 Cat No G9398 (GA2) 1.0 mg/ml
Dry down the mixture under nitrogen and then digest, label and clean up as done for the samples in steps 25-41.
Aliquot and store at -20°C.
In order to calculate molar quantities from integrated peaks in the chromatogram, inject a calibration standard containing 2.5 pmol 2AA-labelled chitotriose (Ludger) with each sample set (not shown).
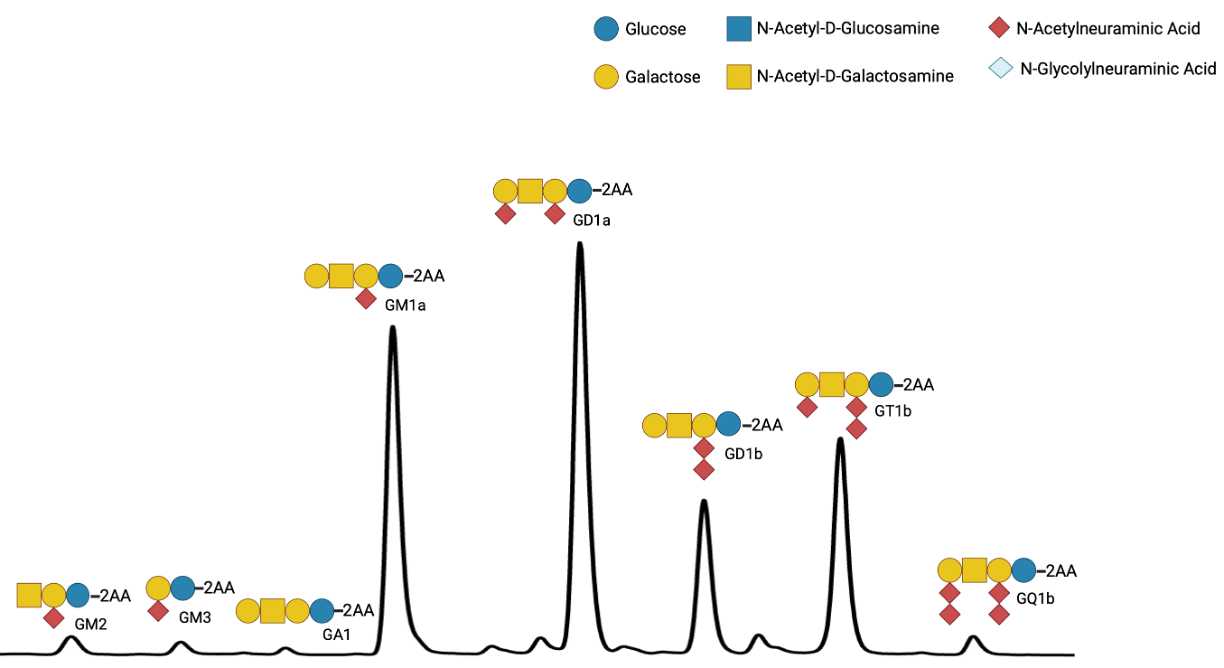
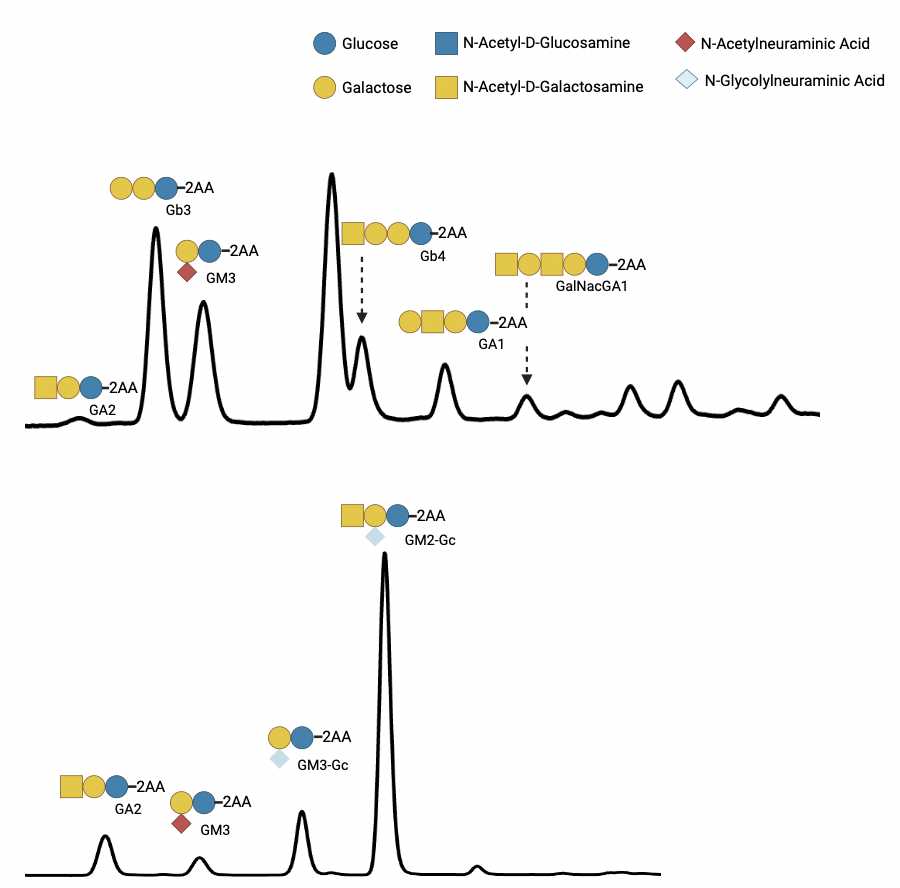
Figures 1- 4: HPLC profile and sugar structures for GSLs in animal tissues together with the GSL biosynthetic pathway

![Figure 2 GSL biosynthesis. Biosynthetic enzymes genes are indicated in the blue grid. Ganglioside names are abbreviated according to Svennerholm [1]. [1] L. Svennerholm, Designation and schematic structure of gangliosides and allied glycosphingolipids, Prog Brain Res 101 (1994) XI-XIV. Figure 2 GSL biosynthesis. Biosynthetic enzymes genes are indicated in the blue grid. Ganglioside names are abbreviated according to Svennerholm [1]. [1] L. Svennerholm, Designation and schematic structure of gangliosides and allied glycosphingolipids, Prog Brain Res 101 (1994) XI-XIV.](https://static.yanyin.tech/literature_test/protocol_io_true/protocols.io.n2bvj88rbgk5/ps4gbza5p3.jpg)


