Analysis of Islet Function by Glucagon Enzyme-linked Immunosorbent Assay (ELISA)
IIDP-HIPP
Abstract
This Standard Operating Procedure (SOP) is based on the Vanderbilt University Medical Center Human Islet Phenotyping Program (HIPP) Islet Functional Analysis. This SOP provides the HIPP procedure for measuring islet glucagon content and secretion to assess islet function.
This SOP defines the assay method used by the Human Islet Phenotyping Program (HIPP) for the qualitative determination of the Purified Human Pancreatic Islet product, post-shipment, manufactured for use in the National Institute of Diabetes and Digestive and Kidney Diseases (NIDDK)-sponsored research in the Integrated Islet Distribution Program (IIDP).
The goal of this SOP is to define the method for quantitative determination of glucagon released after secretagogue stimulation for proving the potency of the human islet preparation shipped by the IIDP.
Steps
Procedures
Preparation of Samples, Standards, and internal Quality Controls
Thaw archived samples intended for analysis in room temperature water. Once thawed, invert capped samples ten times to thoroughly mix.
Bring the Glucagon Standard to room temperature. Keep remaining kit components between 2-8°C.
Retrieve the islet hormone extracts and keep on ice.
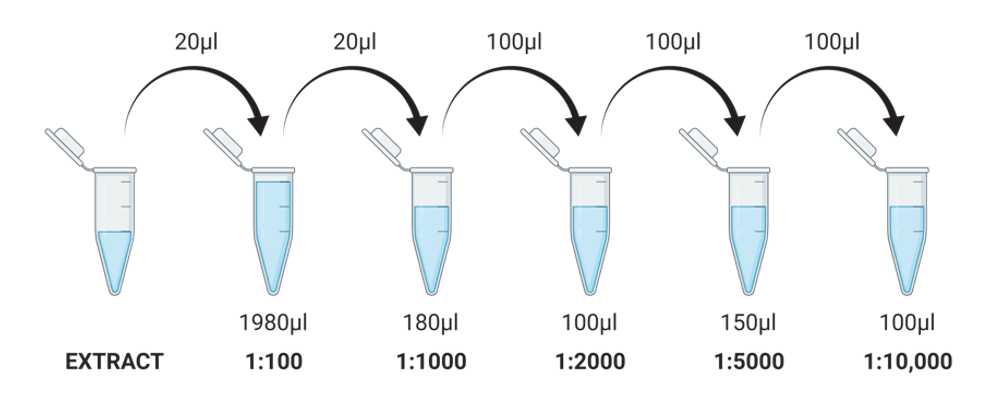
Prepare serial dilutions of hormone extract (1:100, 1:1000, 1:2000, 1:5000 and 1:10000) in 2mL tubes using the Calibrator Diluent RD5-59 from the ELISA Kit. Vortex each tube to mix contents thoroughly before pipetting the subsequent dilutions.
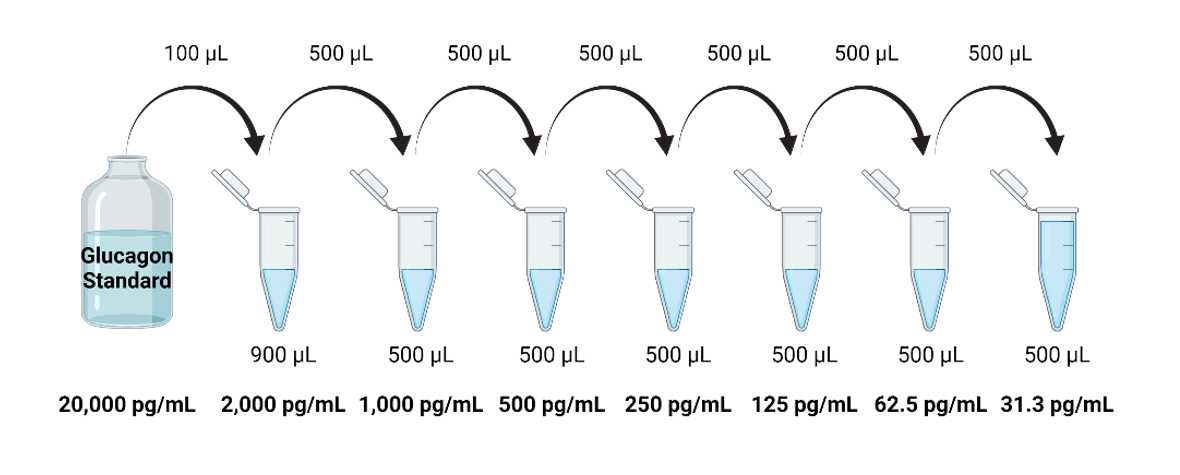
Prepare the glucagon standard dilutions using Calibrator Diluent RD5-59. Perform a 1:10 dilution starting from the 20,000 pg/mL standard vial followed by six 1:2 dilutions. Vortex each tube to mix contents thoroughly before pipetting the subsequent dilutions.
Reconstitute each Quality Control stock in 5mL distilled water, or thaw existing quality control samples.
Prepare the wash buffer dilution by adding 100mL of buffer concentrate to 900mL of DI water.
Prior to beginning the assay, use the plate washer to soak plate wells in 800µL diluted wash buffer for 30 seconds. Wash and aspirate the plate twice with 400µL wash buffer.
Performing Glucagon ELISA assay
Add 150µL of Assay Diluent RD1-110 to each well.
Add 50µL Stop Solution to each well.
Using the microplate reader, determine the optical density and glucagon concentration of each well within 30 minutes of adding stop solution. Set to 450 nm with a wavelength correction at 540 nm.
By using the epMotion 5057 or hand-pipetting, add 50µL of standards and controls (in duplicate), samples, and extract dilutions to the wells.
Cover plate with the supplied adhesive strip and incubate for 3 hours at room temperature.
Using the plate washer, aspirate each well and wash as directed in step1.8. Repeat 3 times.
Add 200µL of ice-cold Glucagon Conjugate to each well.
Cover plate with a new adhesive strip and incubate for 1 hour at 4°C . Do not stack the plates if running more than one kit.
Using the plate washer, repeat the wash/aspiration step 2.4.
Within 15 minutes of use, combine Color Reagents A and B in equal volume, mix solution thoroughly, and add 200µL to each well.
Incubate for 30 minutes at room temperature away from light.
Data Analysis
Values for all standards must be within ±15% of their expected values and replicate values of each standard must have a Coefficient of Variation (CV) ≤20%. If standards vary beyond these limits, the assay must be repeated.
Values for quality control samples, corresponding to lower and upper assay detection ranges, must be within their known ranges. If QCs vary beyond these limits, the assay must be repeated.
Calculate the average of the glucagon concentrations from the 4 extract dilutions to determine glucagon content, expressed as pg/mL.
Normalize secreted glucagon concentrations per islet volume (IEQs), expressed as pg/100 IEQs/min and islet glucagon content, expressed as % content/min.
Use Prism software to create graphs and to calculate stimulation index (SI) and area under curve (AUC) values.
3.5.1 Stimulation index (SI) is a ratio calculated as maximum response to a given stimulus relative to baseline.
3.5.2 Area under curve (AUC) is calculated by integrating islet secretory response to a given stimulus over time.
Data Storage and Reporting
Data Storage and Reporting
To facilitate data management and ensure data security, the VUMC HIPP uses an institutional server-based platform for data storage and analysis.
Upon analysis completion, the VUMC HIPP will upload raw data, including hormone levels, data analysis, and graphical representation of each human islet perifusion, into the IIDP HIPP database. Example of human islet perifusion results performed in HIPP is shown in Figure 1 .
 and glucagon secretion is displayed in the bottom panel (4 human islet preparations).")
Functional data on islet insulin and glucagon secretion will be uploaded within 3 business days to HIPP database built by IIDP programming team and immediately be available to IIDP-affiliated investigators and islet isolation centers.
Deviations and Resolutions
Document any deviations that occurred during this protocol that affect the final results and report with the analysis of the assay.
