Amira Annotation Protocol
Grace Park, Nora Forknall, Larissa Heinrich, Henrique Ludwig, Ruchi Parekh, Alyson Petruncio, Jacquelyn Price, Diana Ramirez, rymert, Stephan Saalfeld, Alia Suleiman, Rebecca Vorimo, Aubrey Weigel
Abstract
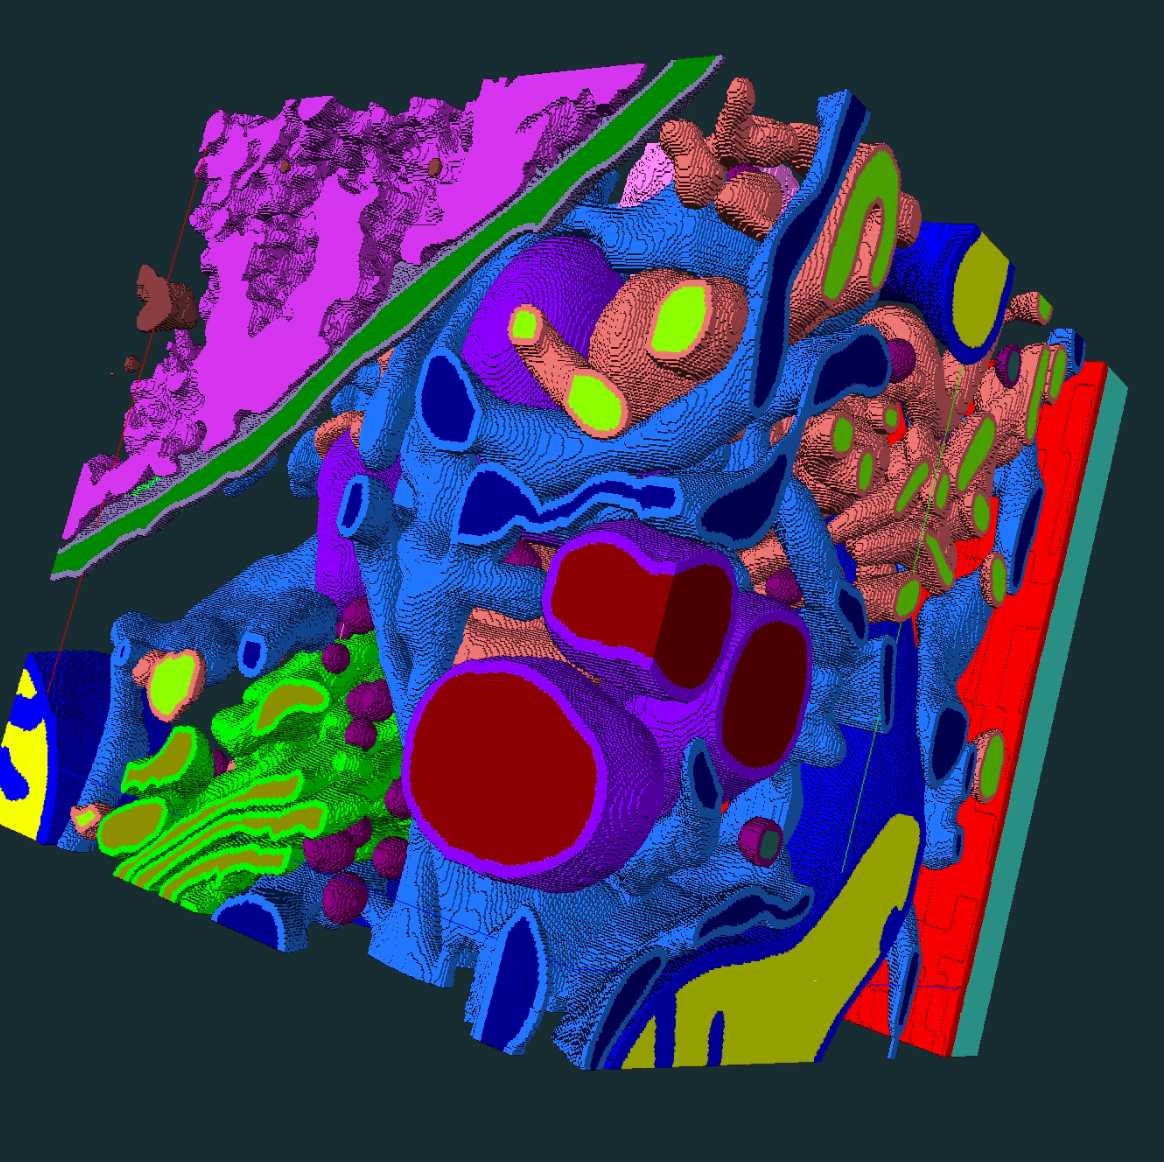
In this protocol we describe the voxel-based classification of organelles and cellular substructures in volume electron microscopy data used to train deep learning networks for automated segmentation. This protocol is centered around using Amira software for ‘painting’ and details how the CellMap Project Team has defined [up to] 37 cellular substructures for automated semantic segmentation tasks. This protocol was used to train the networks described in Heinrich et al, Nature (2021).
Steps
Protocol Introduction
The purpose of this protocol is to document the unique annotation method and style used by CellMap Project Team to annotate organelles using Amira-Avizo (Thermo Fisher Scientific). We defined 37 organelle subclasses to annotate within cell and tissue data and classified them. The definitions used in this protocol are for our machine learning classification, Heinrich et al, Nature (2021). The manually annotated data is used for machine learning efforts to generate automatic organelle segmentation.
We would like to acknowledge and thank the following individuals for their feedback on this protocol: Lorena Benedetti, Eric Kruegar, Claire Managan, Andrew Moore, and Carolyn Ott.
In this protocol, you can expect to find:
- Introduction to Amira
- Cellmap Terminology
- Common Annotation Mistakes
- Annotation Techniques
- Overview Recommended Annotation Steps
- Finishing Up
Amira overview
Introduction to Amira
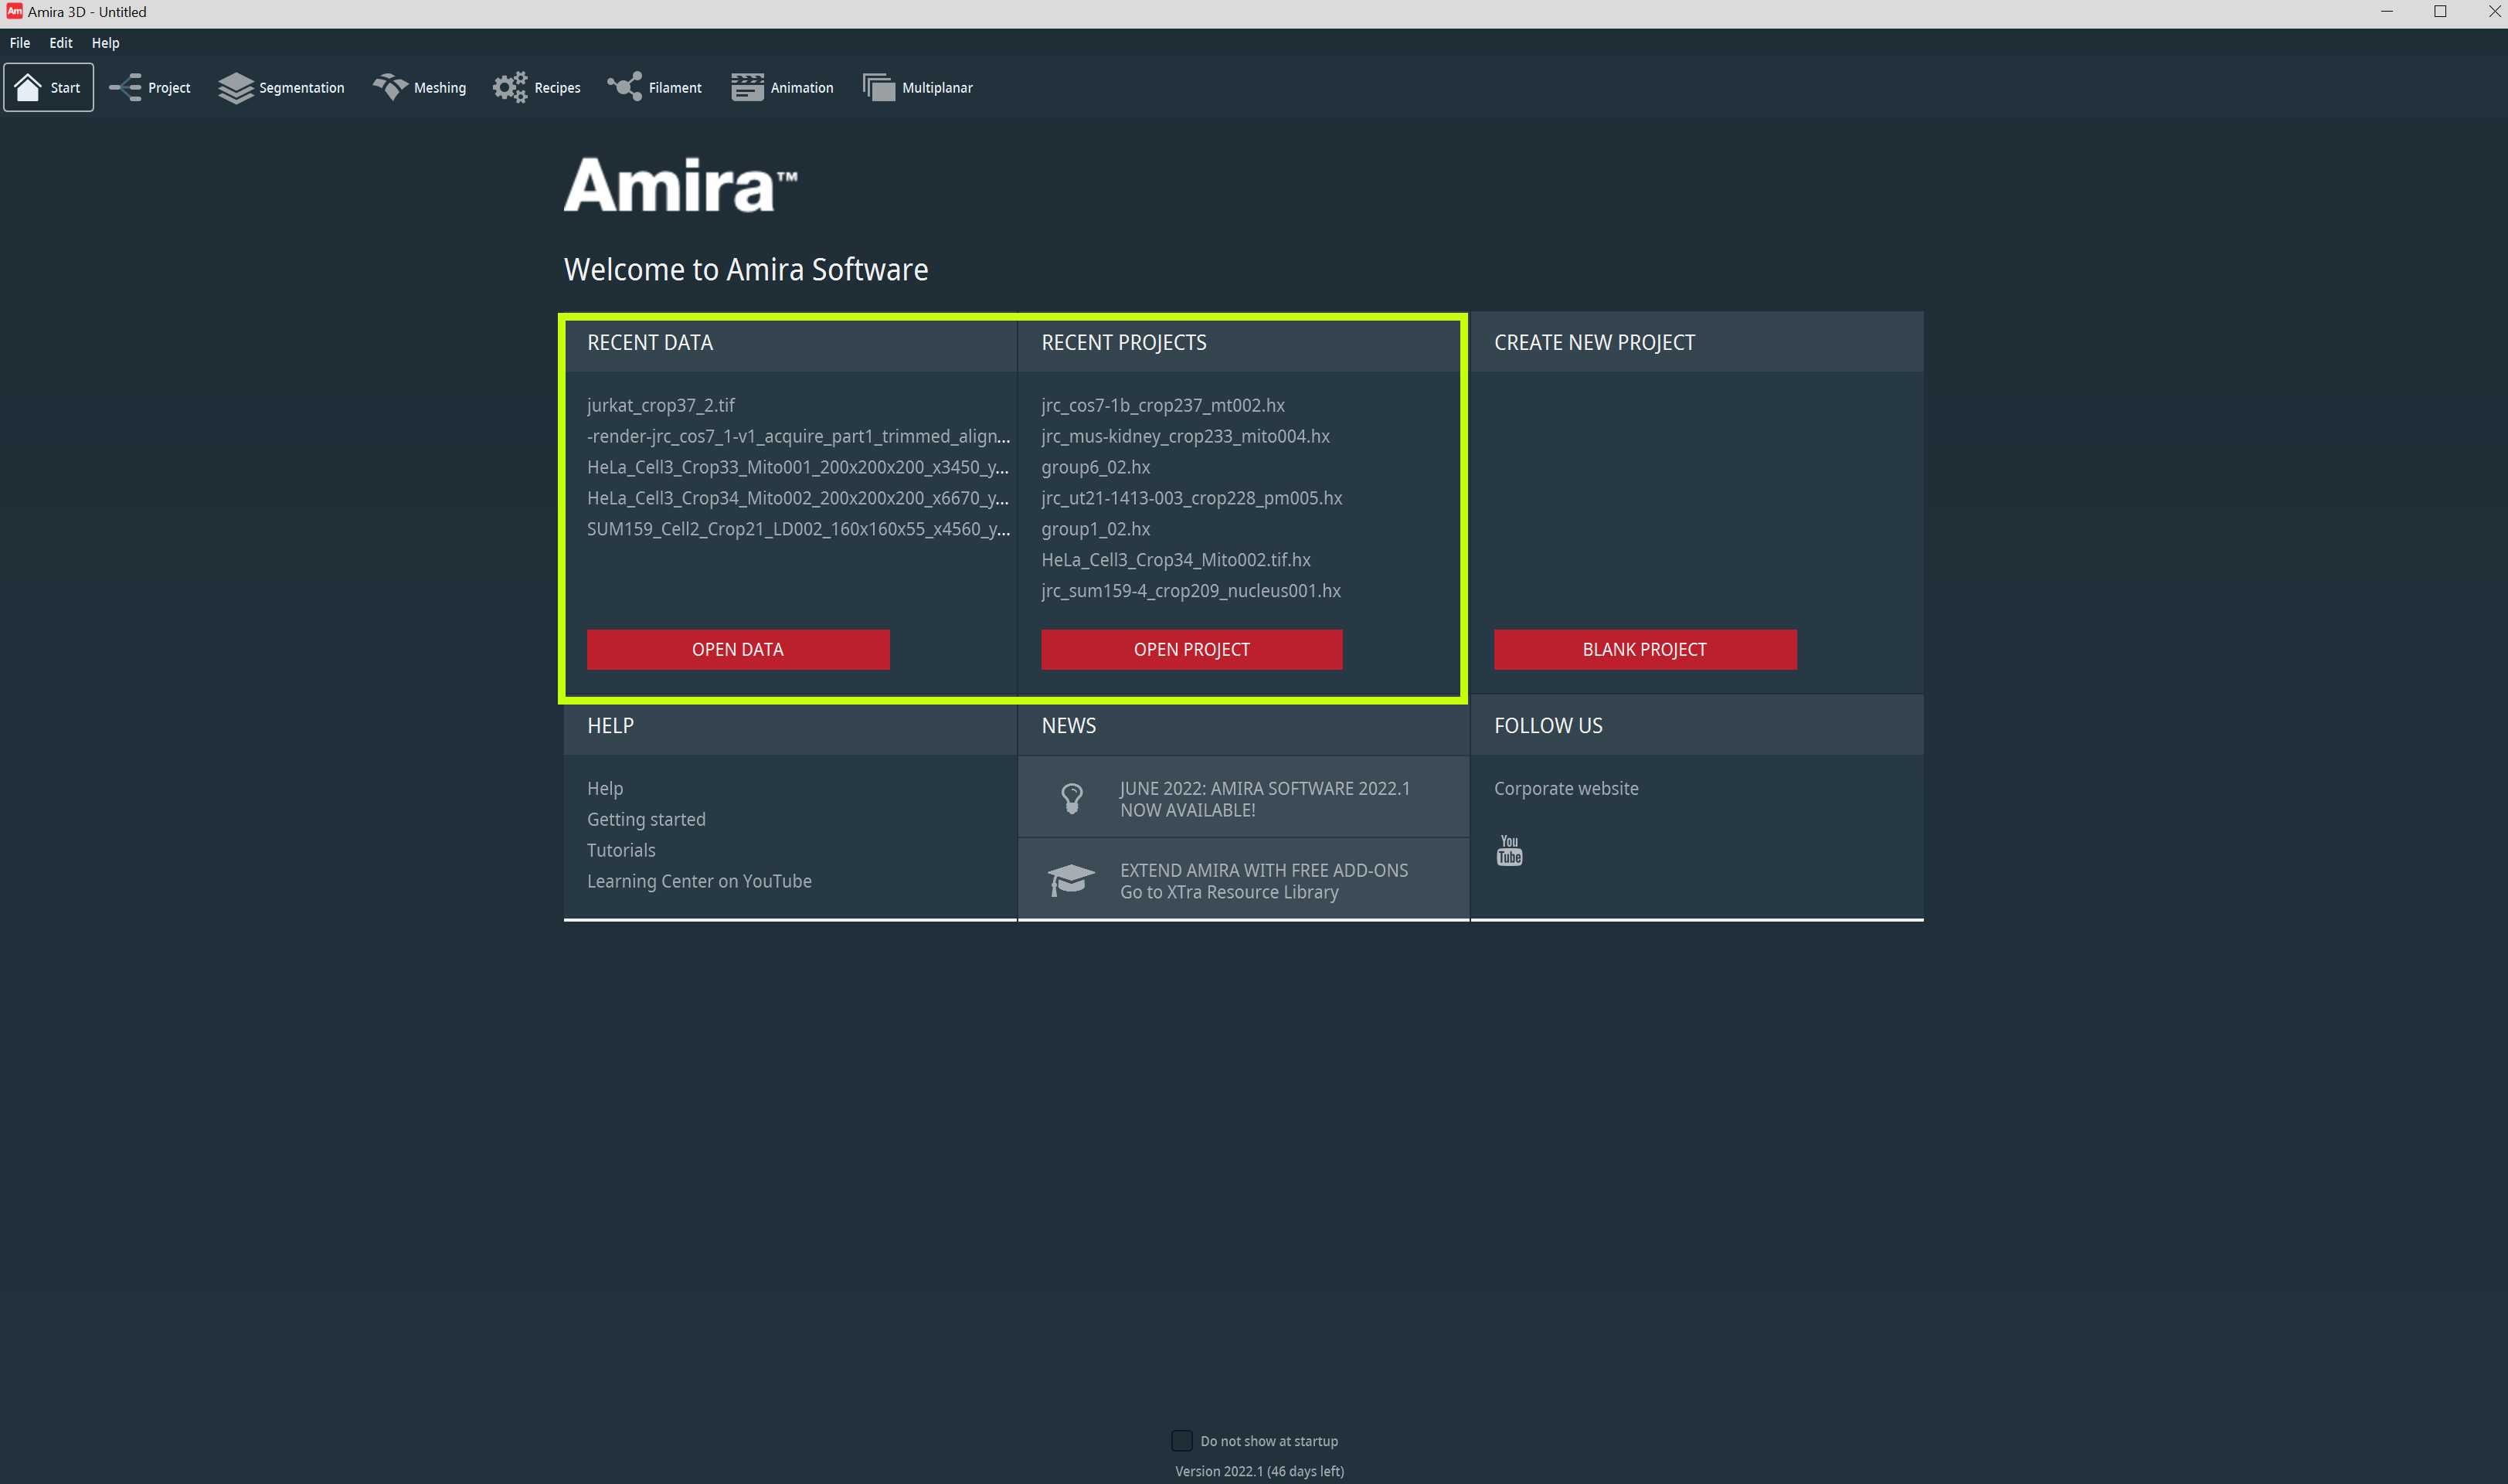
The Workroom toolbar allows you to access different workrooms in Amira. The workroom is a space where a specific set of tools and visualization options are found. It enables the users to utilize dedicated tools in the workrooms depending on their needs. The users can easily swap between workrooms from the toolbar.
You will mainly work in the Project Workroom and the Segmentation Workroom. You can directly open any recent data or project from the start page (Fig 1.1). Please click the image below to zoom in.
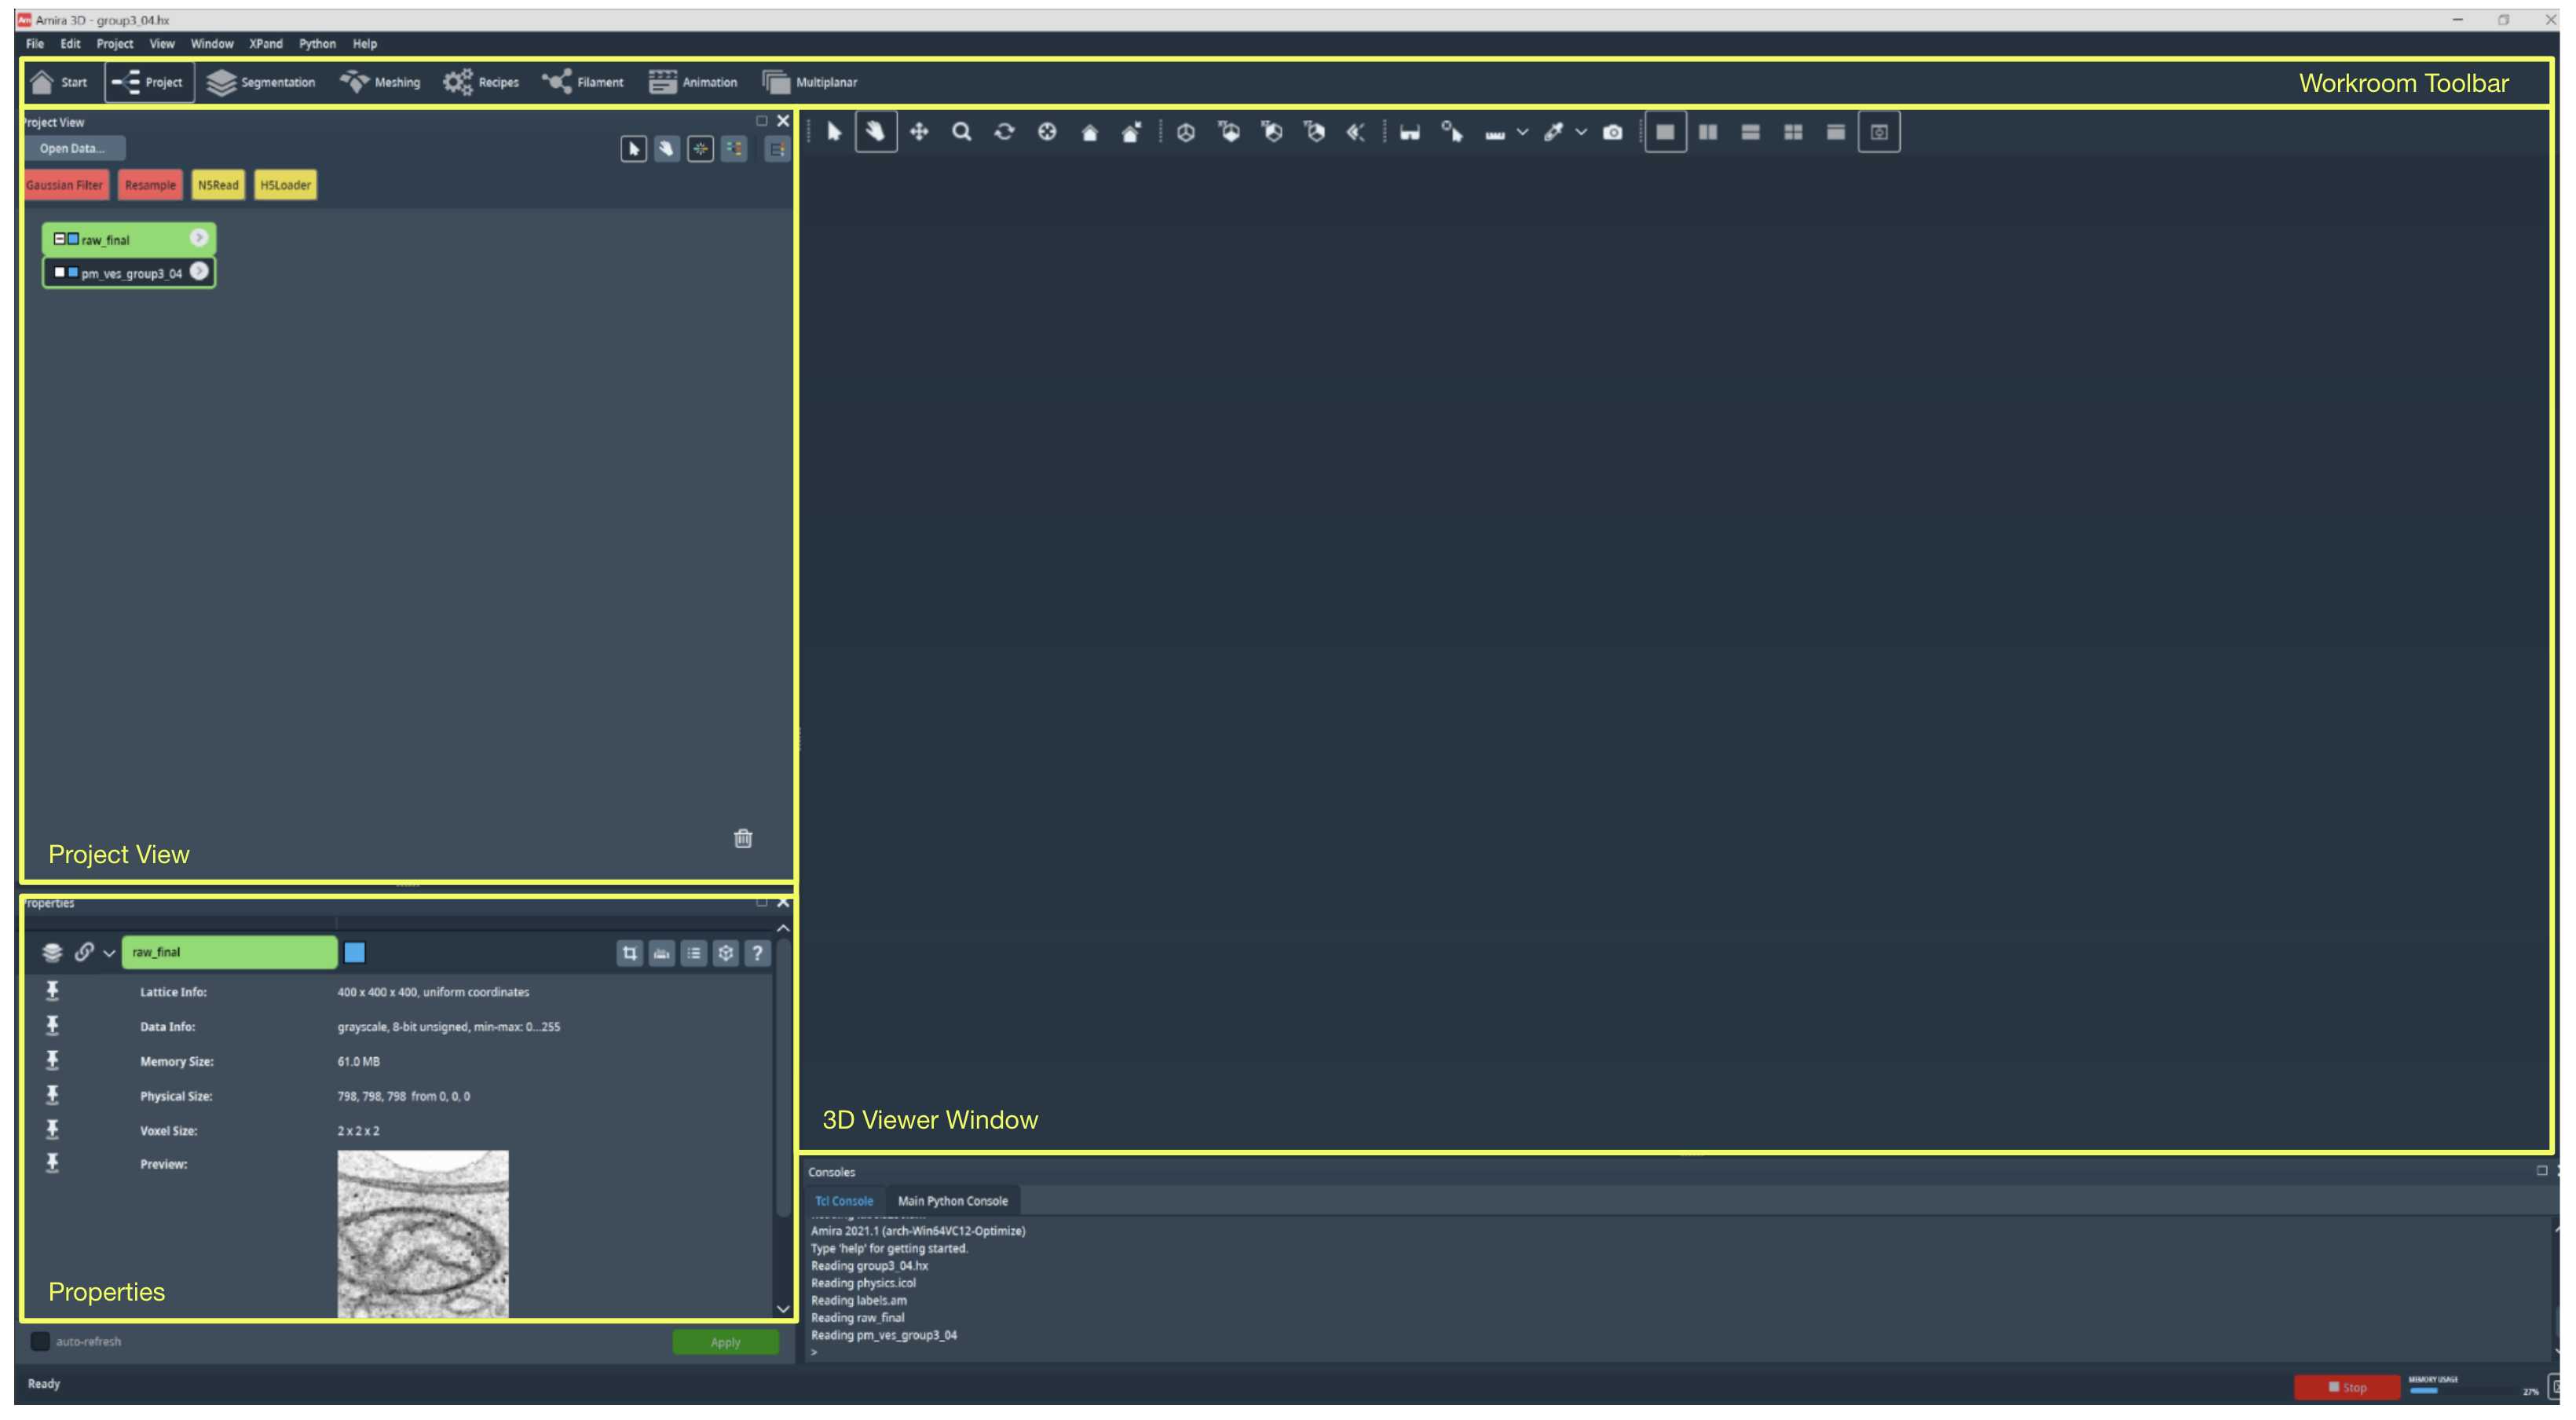
In the Project Workroom, you will find three main sections: Project View, Properties, and the 3D Viewer Window. In the Project View, you can find small icons that indicate each data object. In the example shown in Fig 1.2 , you can find two data objects. One raw data object called "raw_final," and one label field object called "pm_ves_group3_04." The raw data object refers to the raw EM image that has been imported onto Amira, and the label field object refers to the label field corresponding to the image you can annotate. You can right-click on the data object to access more options to further modify and process each data object.
In the Project Workroom, selecting Properties, it is possible to visualize the information about the data you selected from the project view. Here you can find additional data information such as the coordinates and voxel size.
You can visualize the data in various ways in the 3D Viewer Window. For example, you can create an ortho slice object from the label field to look at the image one frame at a time from one orientation to look at the 3D structure of the classes within the label field.
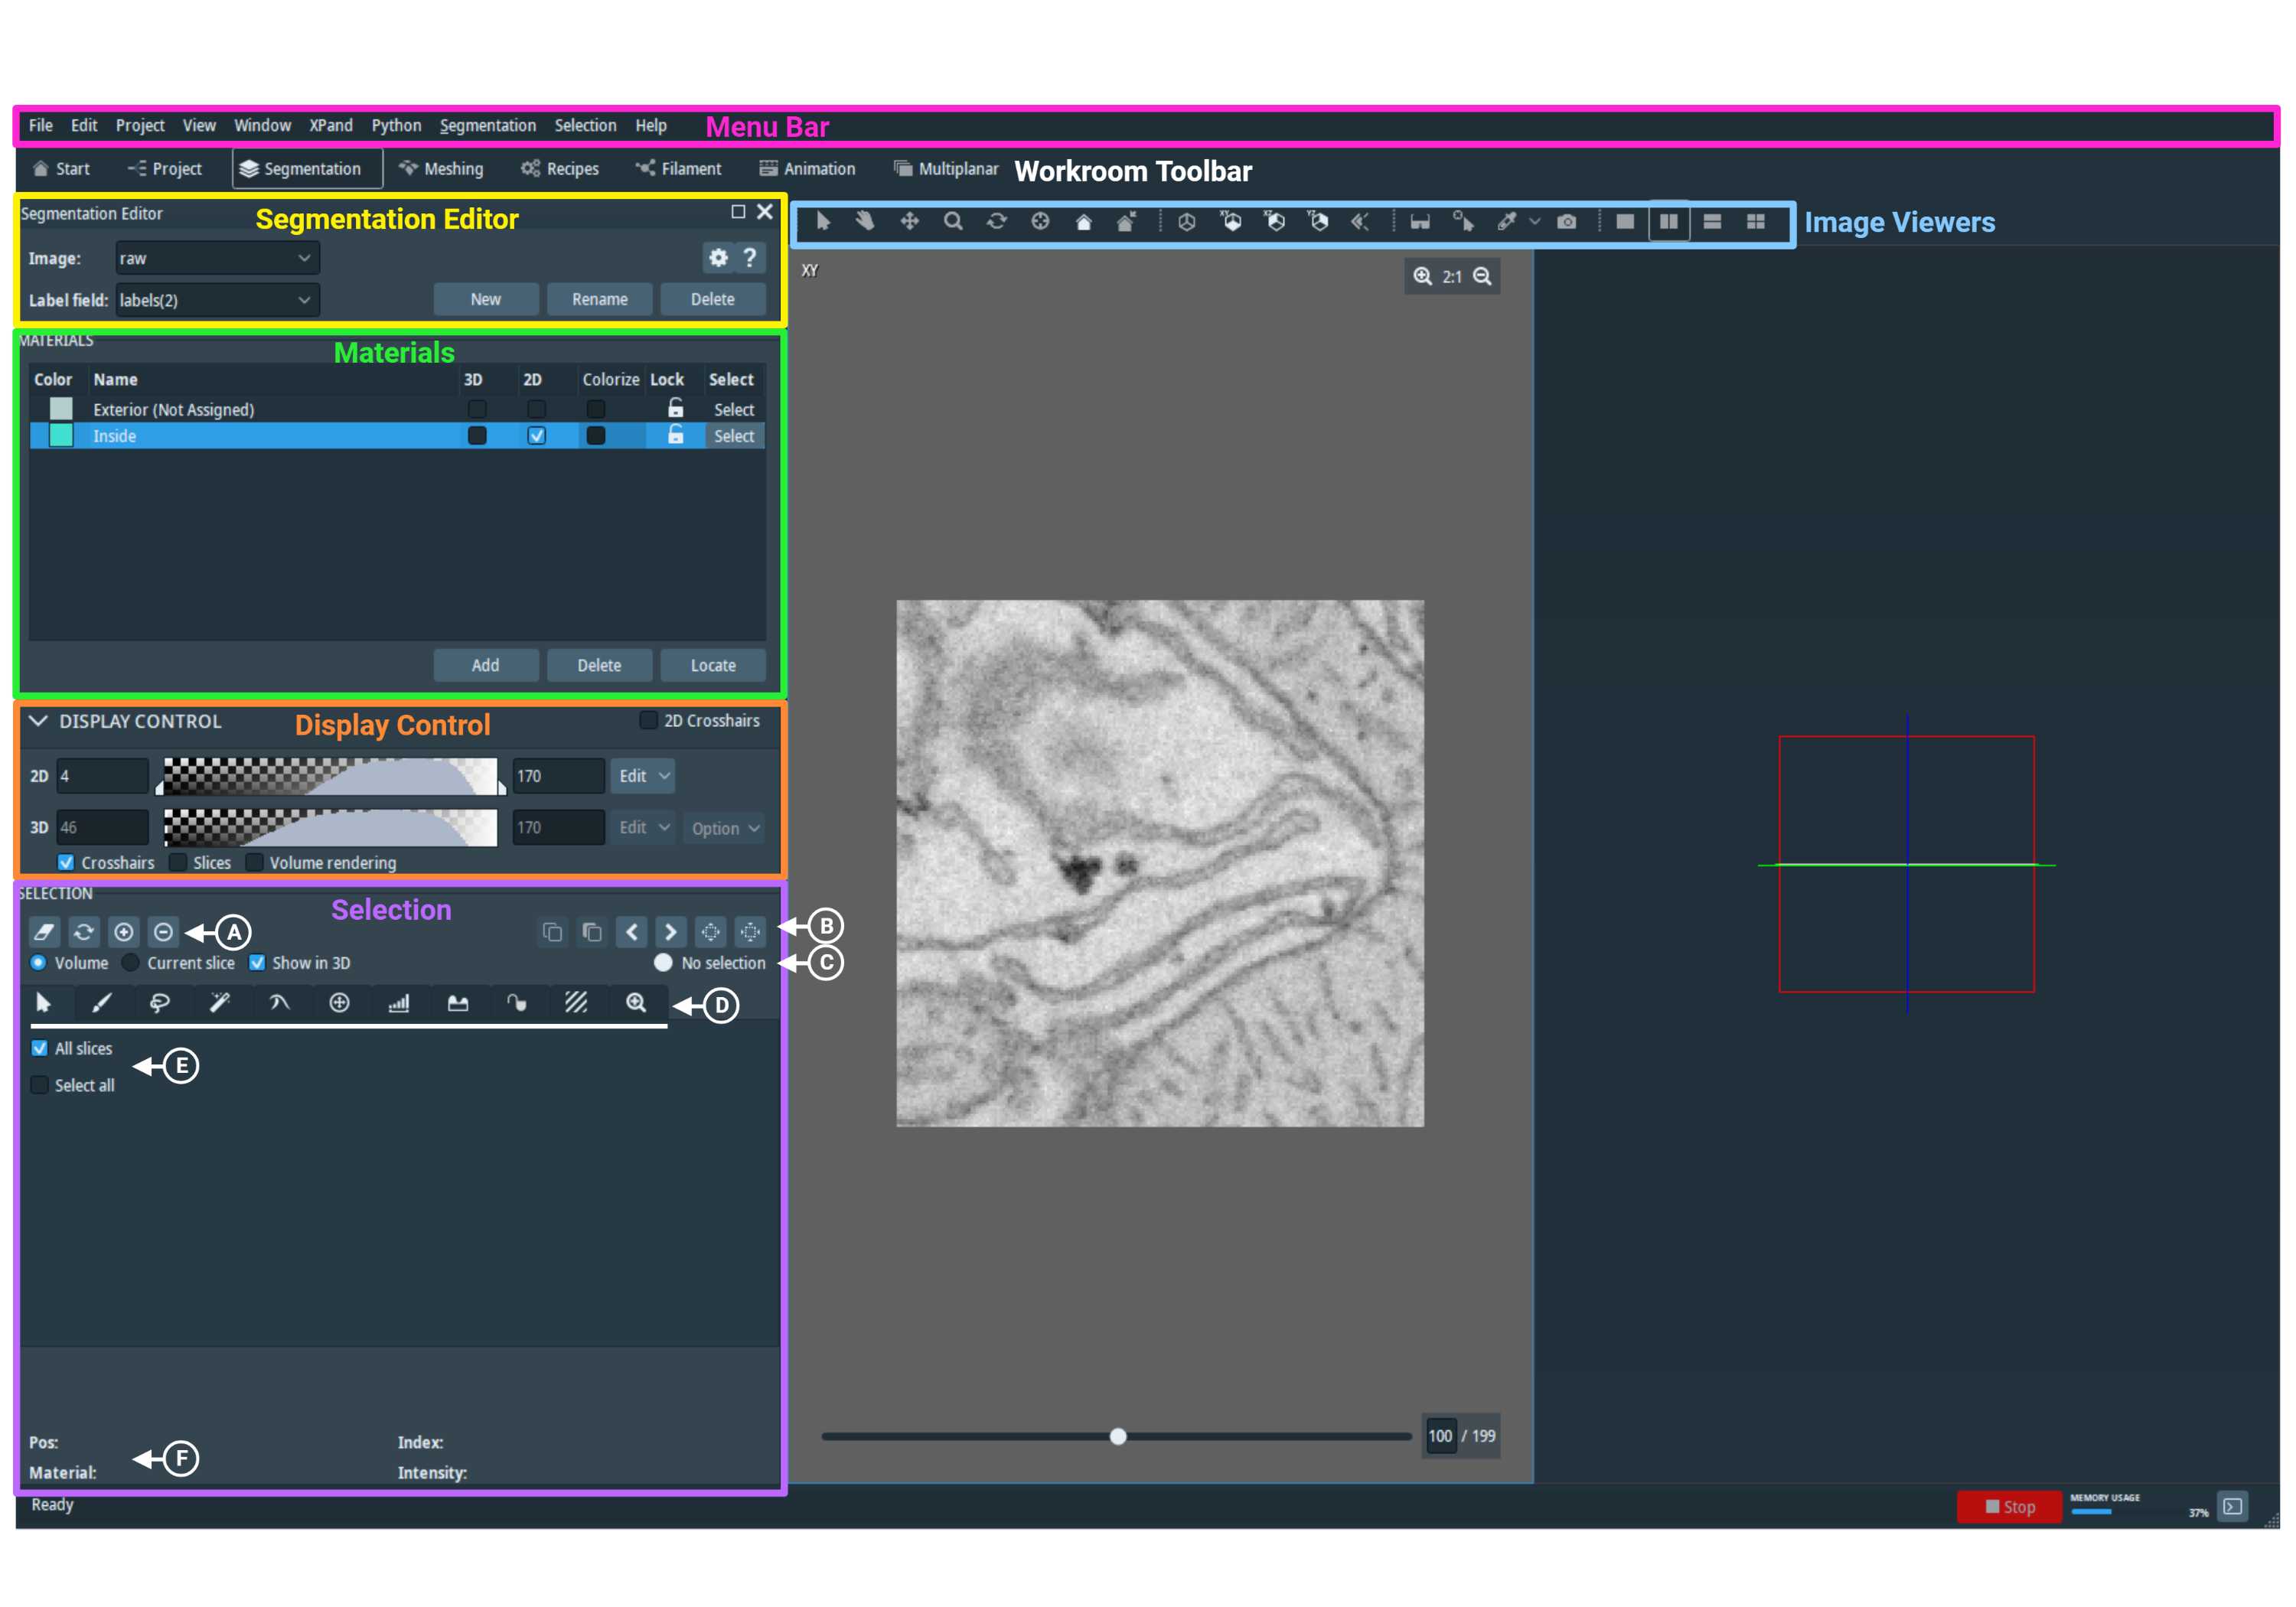
The Segmentation Workroom is what you will use the most. This workroom allows you to visualize the data and make annotations. The workroom is divided into multiple subsections: Segmentation Editor, Materials, Display Control, Selection and the Image Viewers (Fig 1.3).
The Segmentation Editor (outlined in yellow in Fig 1.3 above) allows you to select the image and label data currently loaded onto the Project Workroom. The Materials section (outlined in green) lists all the materials (Section 2.2) you have under the chosen label field from the Segmentation Editor. You can add new materials, delete existing ones, and locate a selected material using three buttons at the bottom of this section.
You can access more tools when you right-click on a material. For example, the Locate button from the drop down menu when you right-click on the material enables you to navigate to the frame with the highest number of pixels assigned to the selected material. You can also modify the annotation style and color from the Draw Style and Edit Color options, respectively.
Finally, one of the essential tools from the Materials section is the Lock option. To pick a material, click on the small padlock located to the right of the material's name. While a material is locked, you won't be able to add or subtract new annotations from that material. Also, it will remain unaffected from image processing features such as Smoothing or Remove Islands.
The drop-down menu of the Display Control section (outlined in orange in Fig 1.3) contains the colormap range controls. You can adjust the contrast of an image by sliding the bars to optimize the data display.
The Image Viewer section (outlined in blue in Fig 1.3) allows you to display the data in different orientations. You can simultaneously have up to four displays: three orthogonal planes, and one 3D viewer. However, you can only make changes to one slice in only one view at a time. The slider bar at the bottom of the viewer allows you to change the frame being displayed by dragging the scroll bar left and right. The number on the right of the slider bar represents which frame you are on out of the total number of frames. You can also zoom in and out with the magnifying glass icon in the top right corner of the viewer.
The Selection section (outlined in purple in Fig 1.3) contains multiple annotation tools that are divided into two categories: Selection Tools and Segmentation Tools.
The Selection Tools comprises of the basic annotation tools. "Annotation" consists of selecting voxels and adding them to the active material highlighted in the Materials section. The Clear, Replace, Add, and Subtract tools (labeled as A in Fig 1.3) tools are used to assign the selected voxels as their names suggest.
The Grow Selection and Shrink Selection tools (labeled as B in Fig 1.3, outlined in yellow in Fig 1.4) can modify the selection size. Since there are multiple frames in the image, you may not always be able to view your selection. However, you can check the selection status from the Selection Highlighting (outlined in purple in Fig 1.3 and labeled as C). It will show one of the three statuses: No Selection, Active Selection, or Hidden Selection.
The set of Segmentation Tools in the Selection is made up of multiple brush tools that can be used in different scenarios for efficient annotation. The three most used Segmentation Tools are the Pick & Move, the Brush, and the Magic Wand. The Pick & Move tool lets you select the region assigned to a particular material when you left click on it. Depending on whether All Slices (outlined in purple in Fig 1.3 and labeled as E) is checked off or not, the selection is applied to the current frame only or all slices. The brush tool selects the voxel with the left click. The brush size can be changed by moving the scroll bar from left to right. You can also directly assign a specific number in the box next to the scroll bar to change your brush size. For membrane annotation, the typical brush size ranges from 5 to 15. The Magic Wand tool is often used with the Masking option. This will only select voxels within the set threshold range. The masking threshold can be adjusted by sliding the scroll bar from left to right.
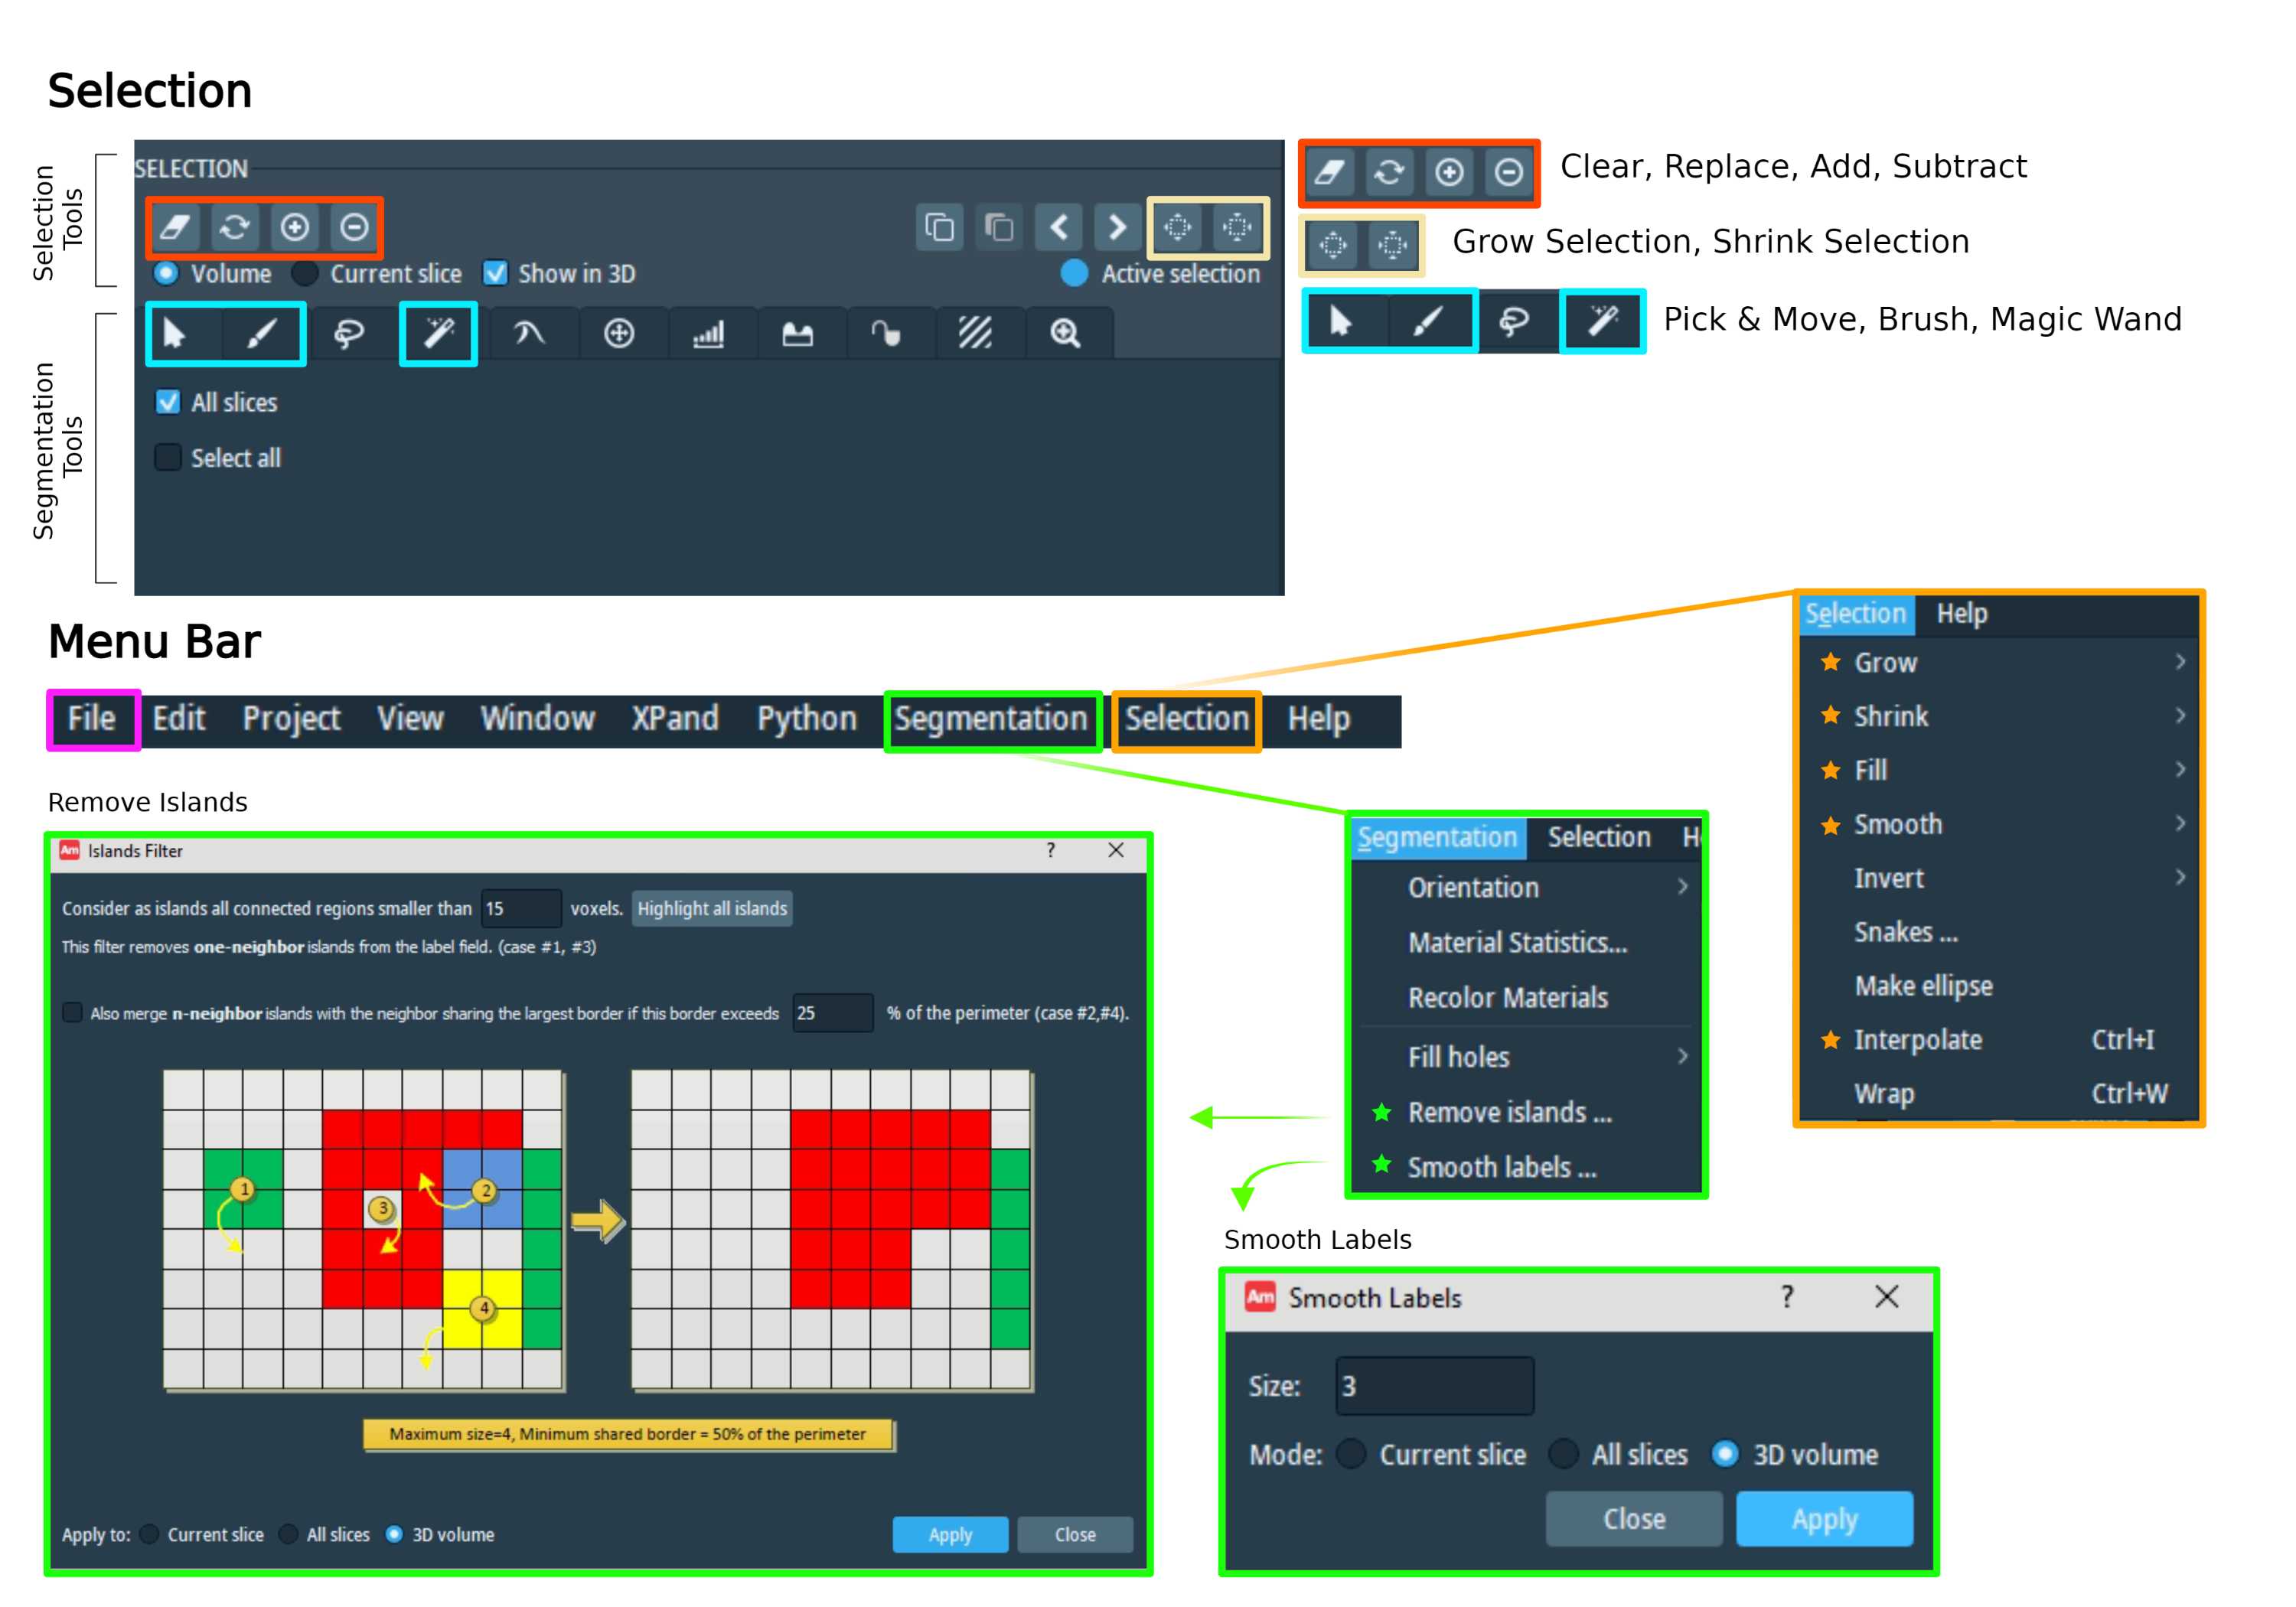
Additional Selection (outlined in orange in Fig 1.4) and Segmentation (outlined in green in Fig 1.4) tools are found in the Menu bar. Tools used in Cellmap annotation are marked with a star icon in the figure.
Since annotation is done on one plane at a time, when you flip your orientation, the annotation made on the previous plane may appear jagged and irregular. The "Smoothing" function helps to even out the membrane edges. There are two ways to smooth your material. The Smooth function from the Selection menu applies a Gaussian filter to the labels, then reselects every pixel with an intensity greater than 0.5. To use this function you must have an active selection.
The "Smooth labels" function from the Segmentation menu (outlined in green, marked with a star in Fig 1.4) is more extreme since the Gaussian filter is modified to smooth the material boundaries. You can choose the kernel size to select the intensity of the smoothing effect. The bigger the kernel size is, the more intense the smoothing effect becomes. The typical smoothing kernel size used by Cellmap ranges from 2 to 5. The changes can be applied to the current frame, all slices, or 3D volume. You do not need an active selection for this tool.
Another function in the Selection menu is "Interpolate" (outlined in orange, marked with a star in Fig 1.4). As the name suggests, this tool automatically interpolates all slices between your selections. However, since it is a slice-by-slice process, you can only apply this function in one plane. Attempting to interpolate with the selection made in more than one orthogonal plane may result in conflicts or failures. To avoid this, add your interpolated selection to the material before attempting to interpolate on another orthogonal plane.
Once membrane is outlined, the inner region can be automatically filled in using the "Fill" tool (outlined in orange in Fig 1.4). The Fill tool automatically fills the current selection and closes any holes.
The "Remove Islands" function in the Segmentation menu (outlined in green, marked with a star in Fig 1.4) is used to remove random unwanted voxels. You can change the minimal voxel size to set the intensity of the smoothing impact. You may preview the islands selected by clicking "Highlight all islands."
You can save your project with the "Export Project As" button from the File function (outlined in pink in Fig 1.4) from the menu bar.
Annotation Basics
Getting Started
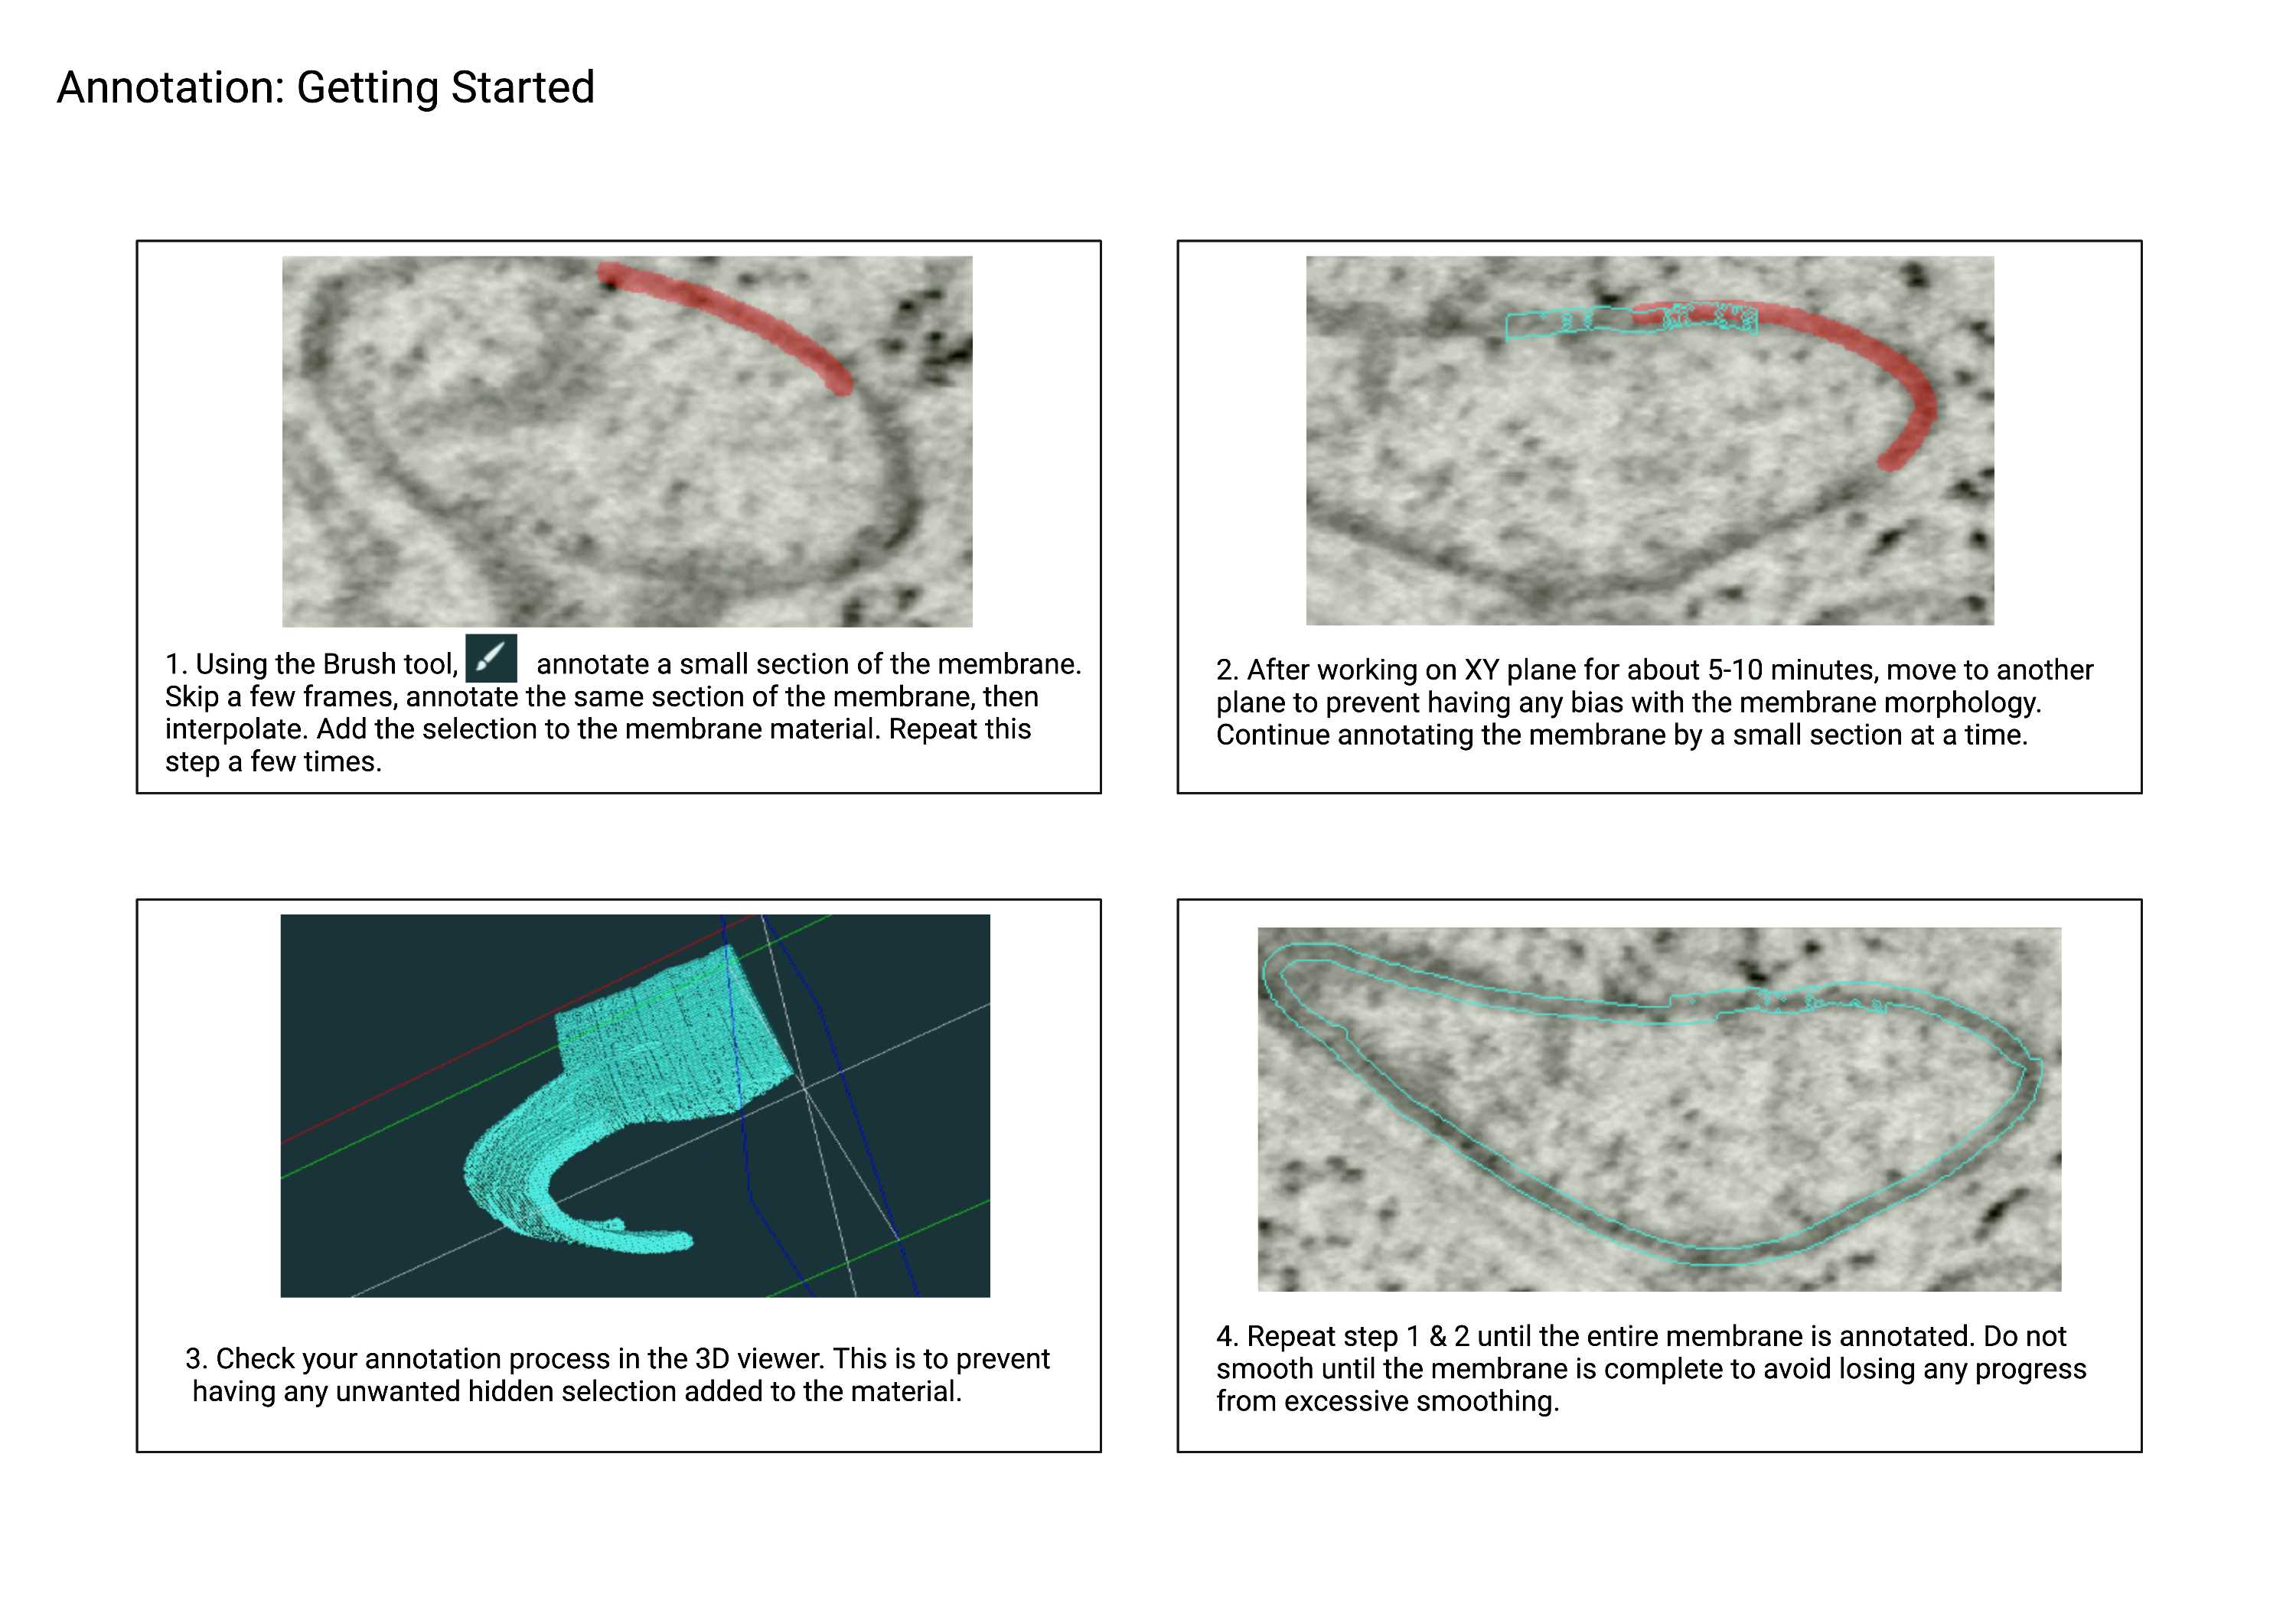
You will utilize multiple annotation tools to efficiently and accurately complete the annotation of small portion of a FIB-SEM volume. To get started, use the Brush tool to annotate a small section at a time (Fig 2.1). If you cannot proceed with the Brush tool, explore other annotation tools to complete the annotation.
Use the Interpolation function (Fig 1.4) to speed up the annotation process, and always double-check your selection before adding it to your material. Utilize all three orthogonal planes to reflect the original morphology of the organelle as much as possible.
Cellmap Terminology
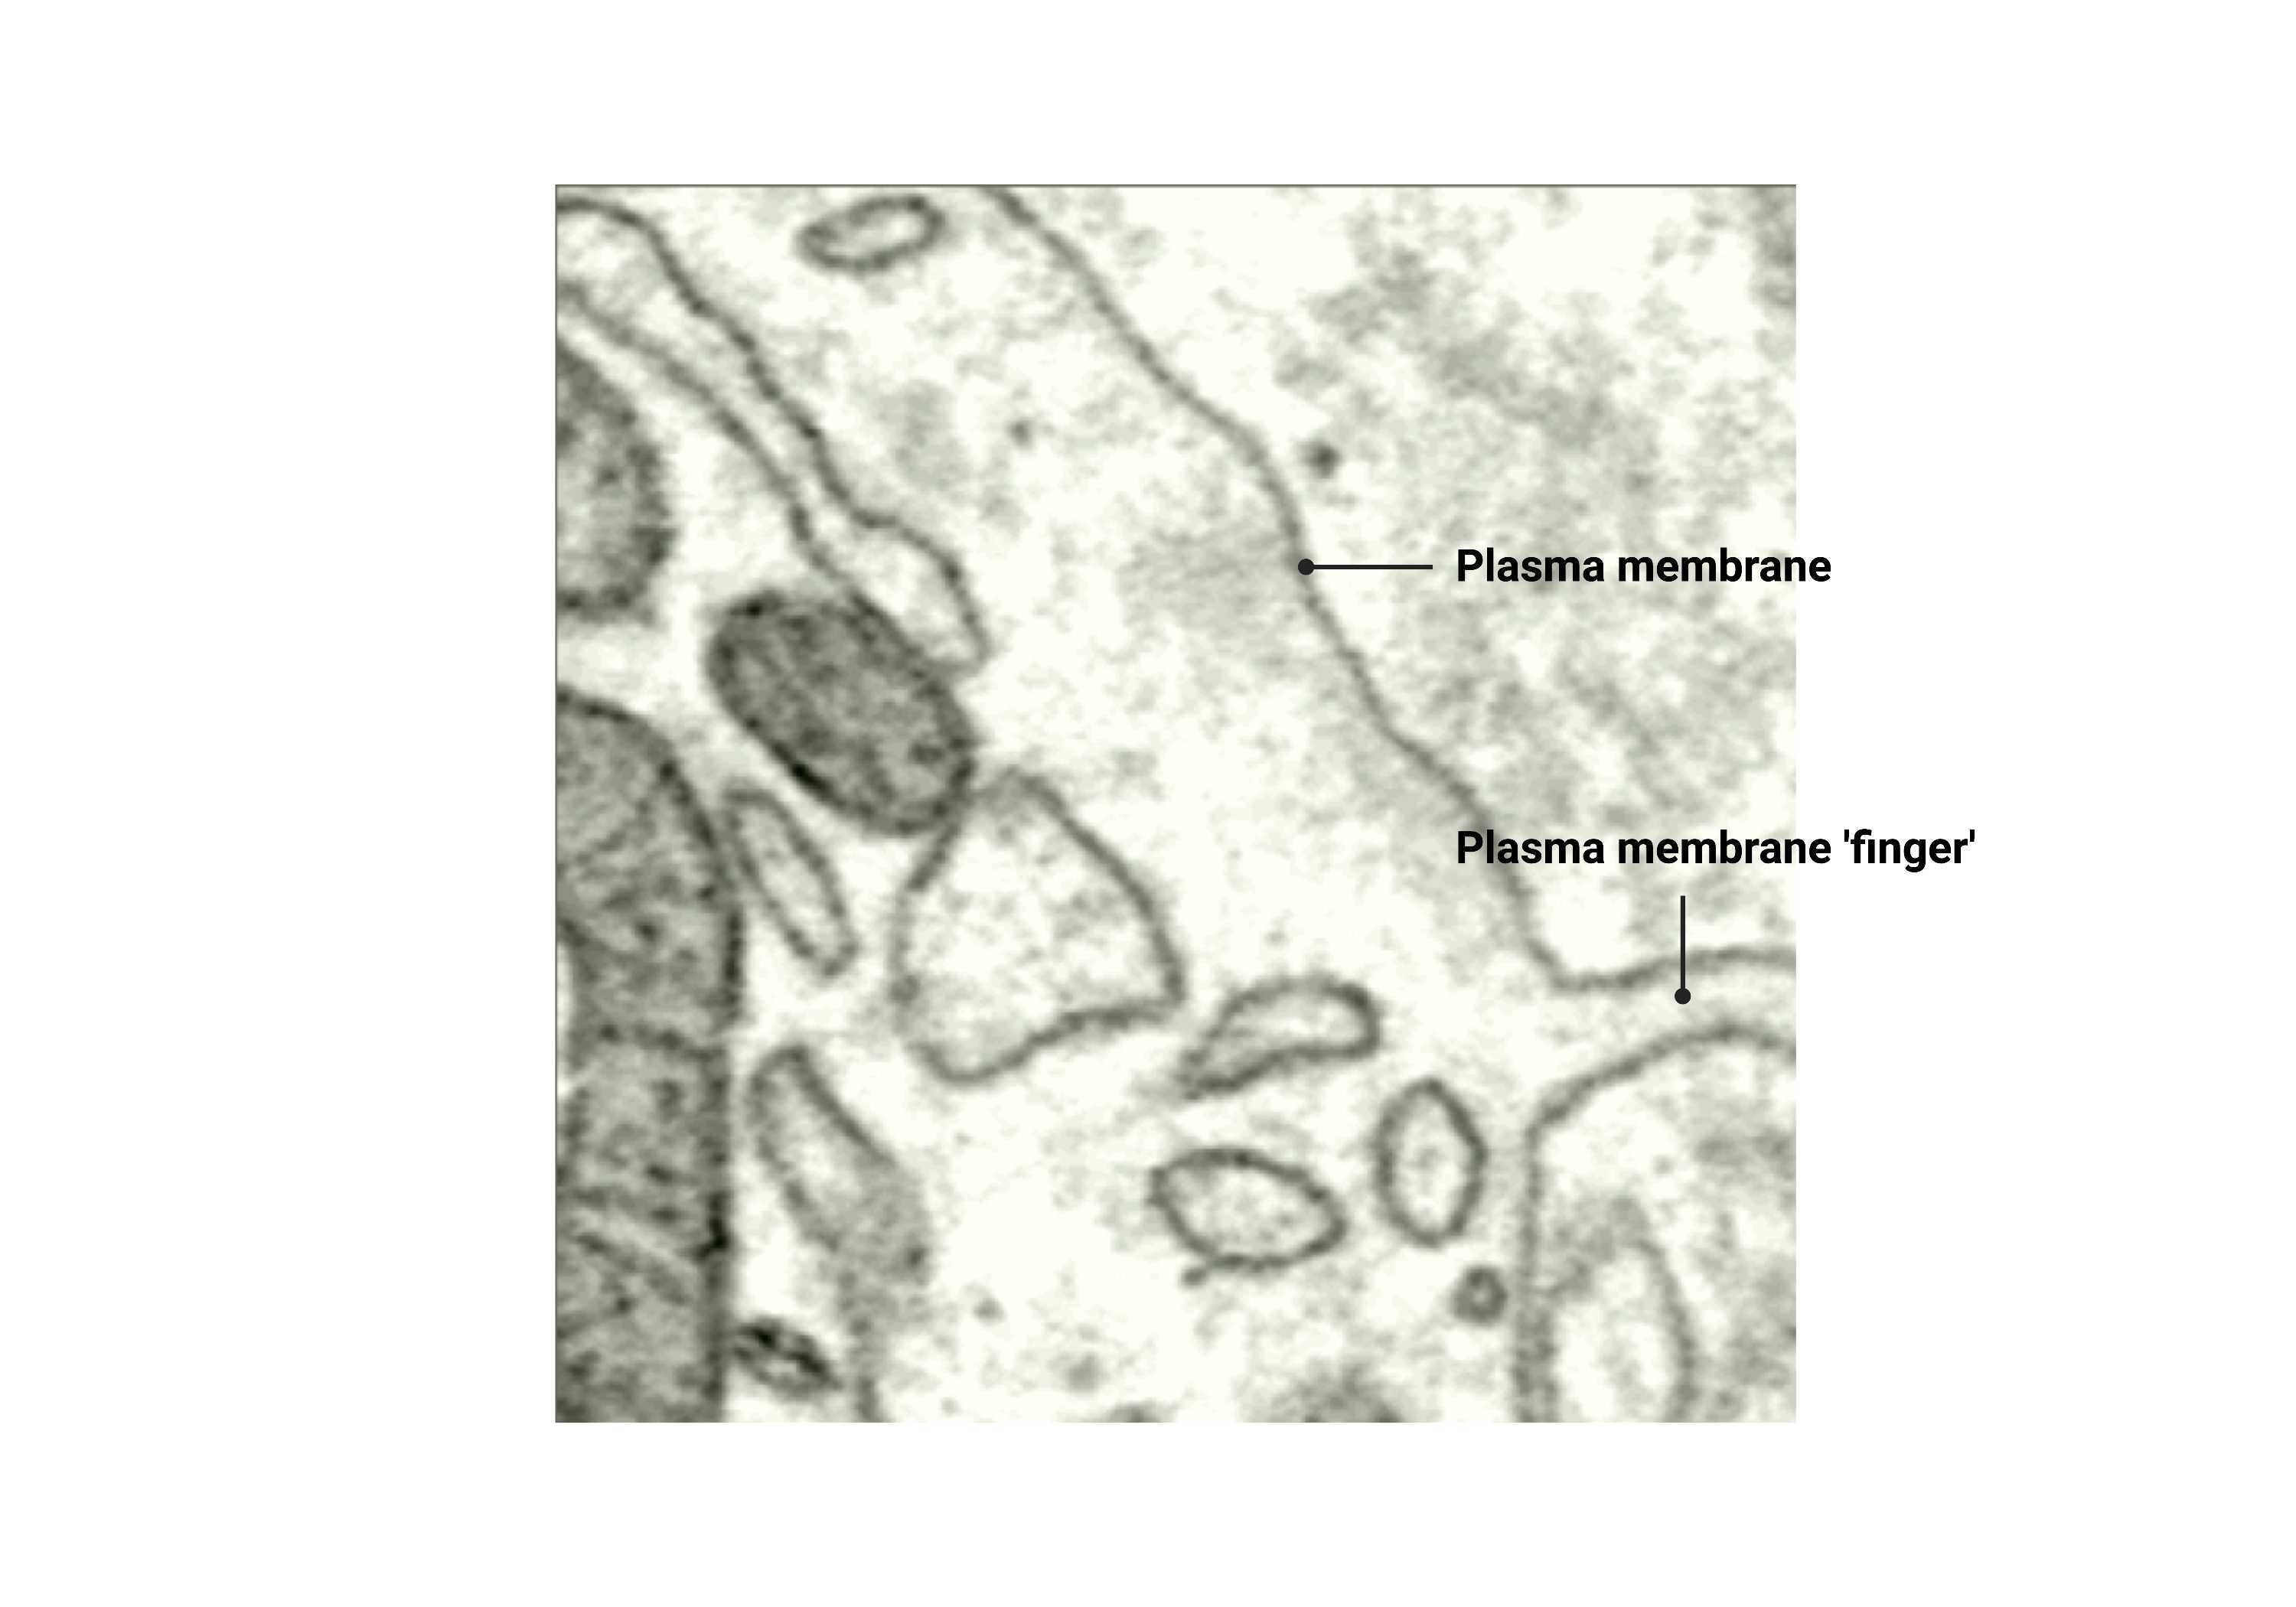
Plasma membrane finger
Membrane folds
- The membrane is folded inwards, creating wrinkle-like folds from the inside.
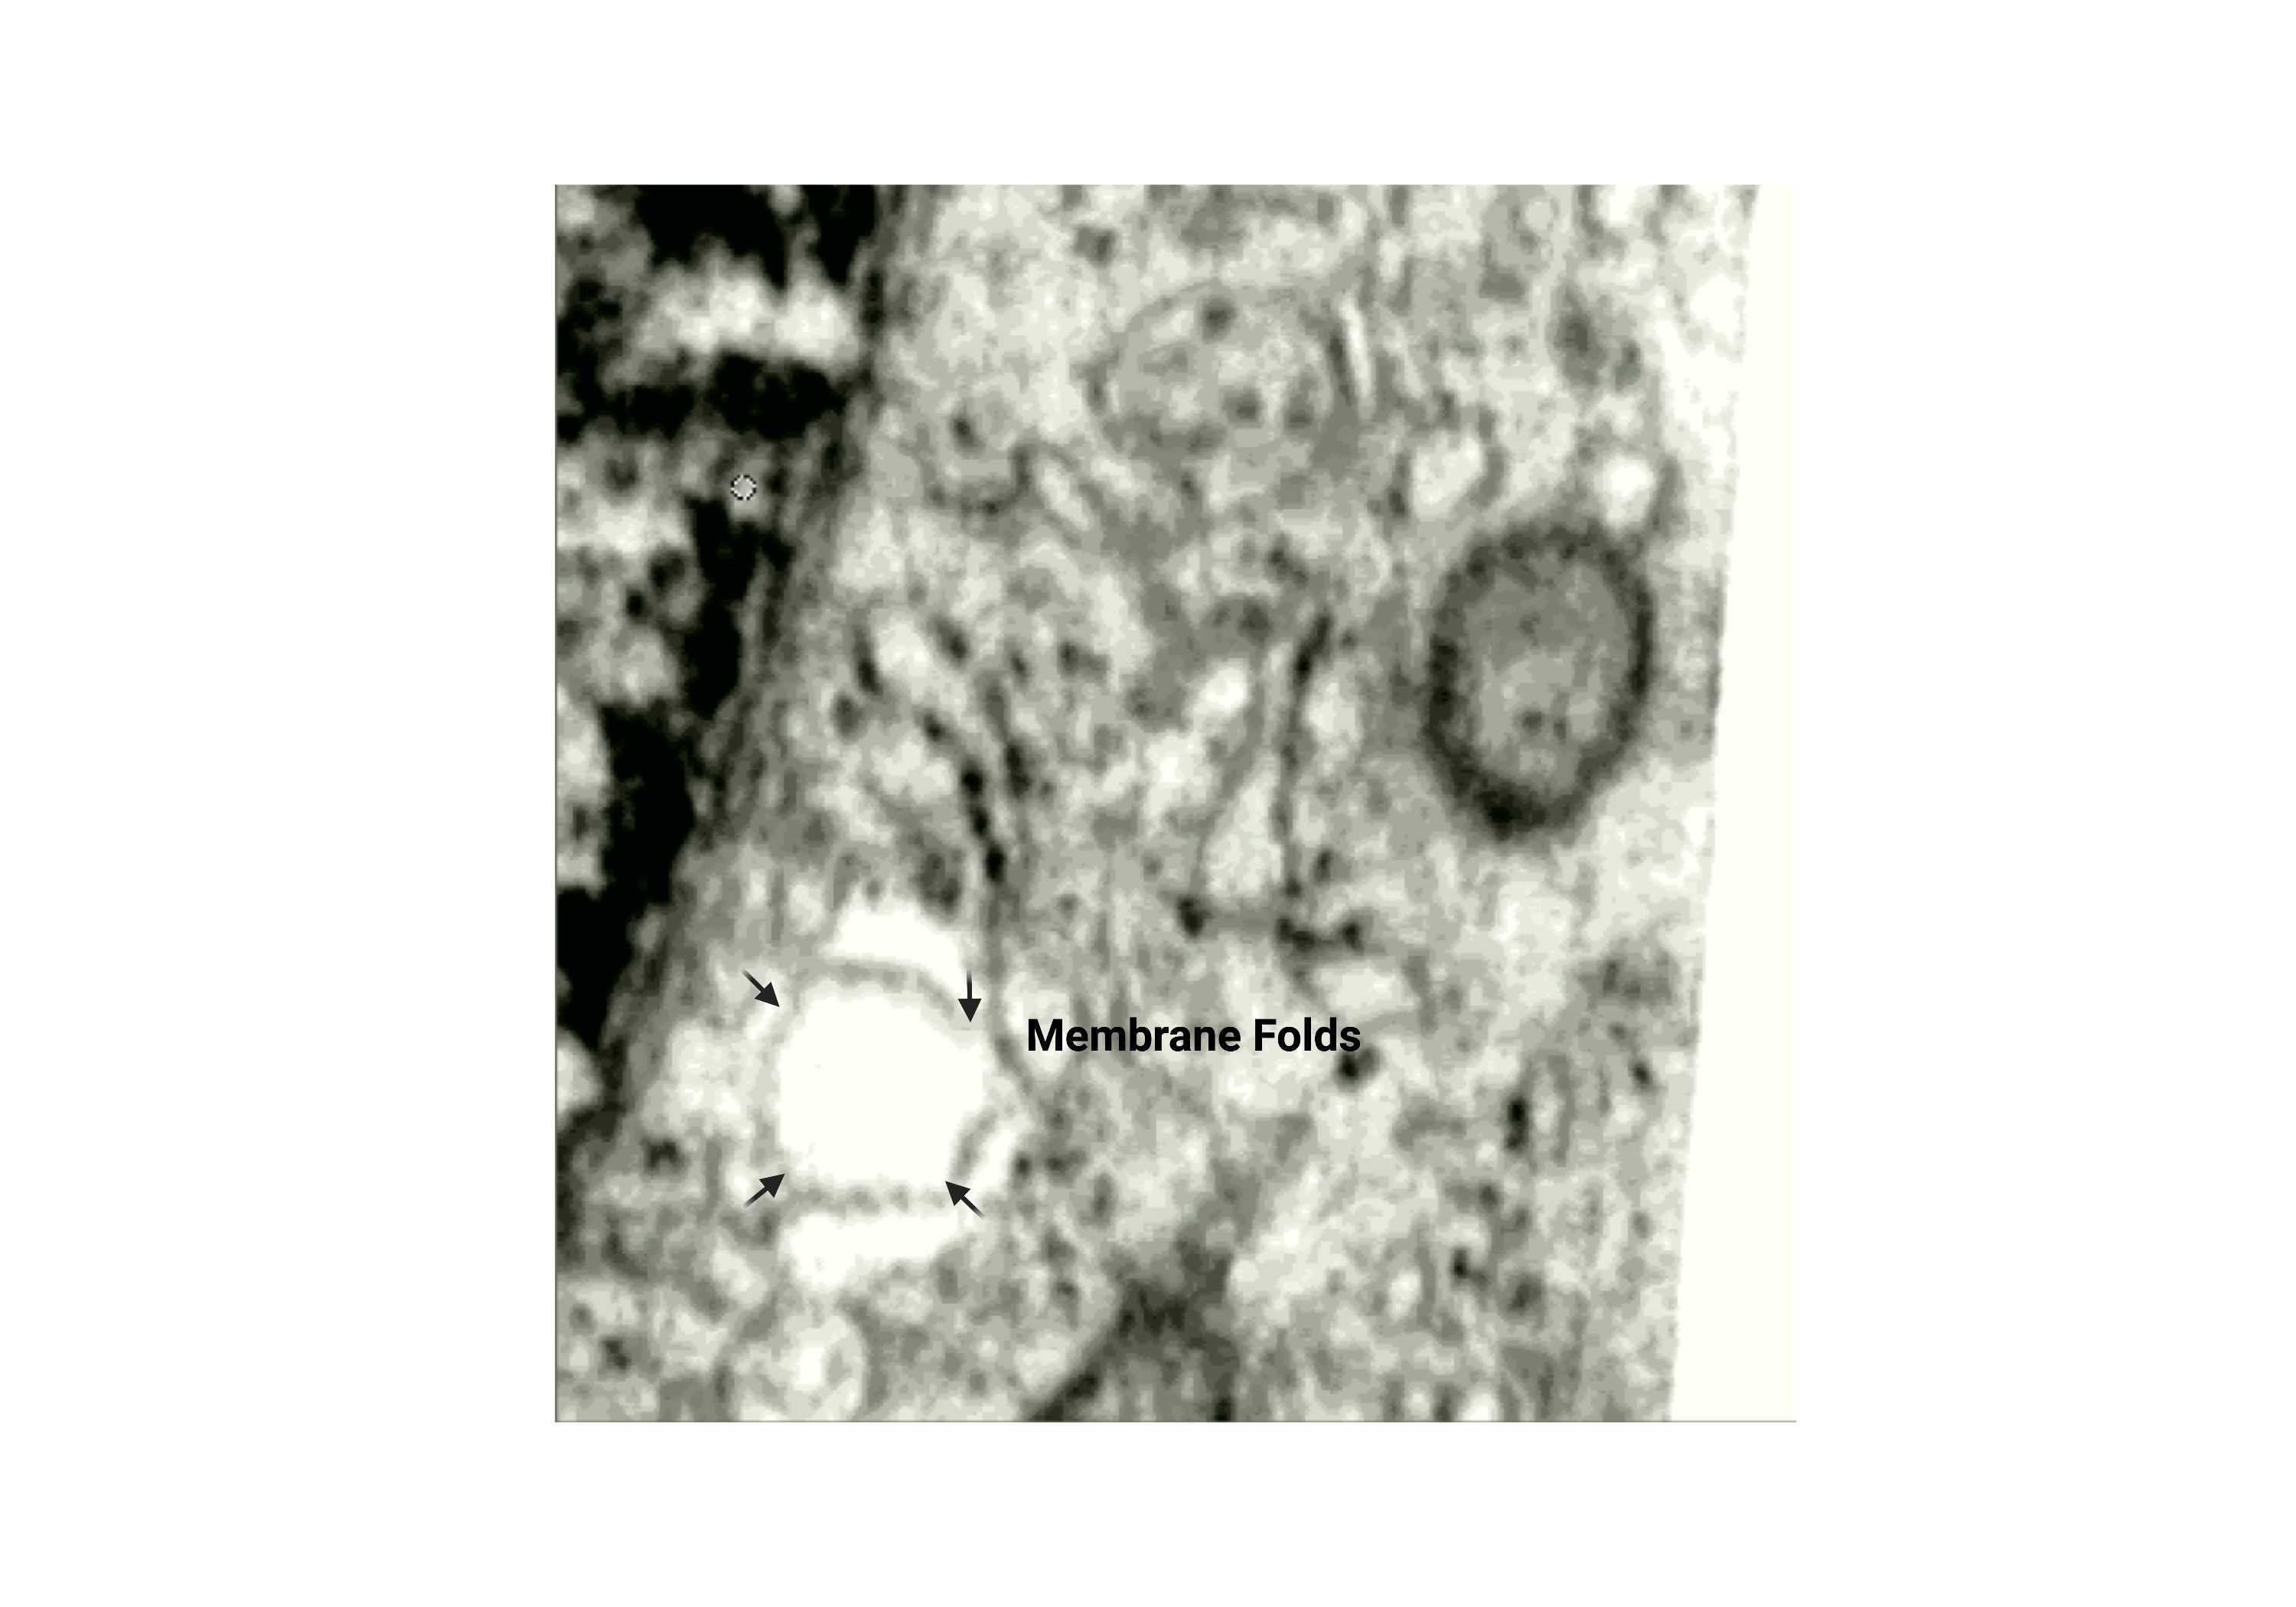
Fig 2.2.2 Membrane Folds
Outer membrane
- Refers to the "object" membrane, excluding the lumen. The object membrane keeps the organelle enclosed, so the lumen is not exposed to the cytosol.
Lumen
- The region that is enclosed by the object membrane. The lumen should never touch cytosol.
Membrane shadow
- Part of the membrane that appears "faint" or "smudged" where you may not always see a clear distinction between the membrane and lumen.
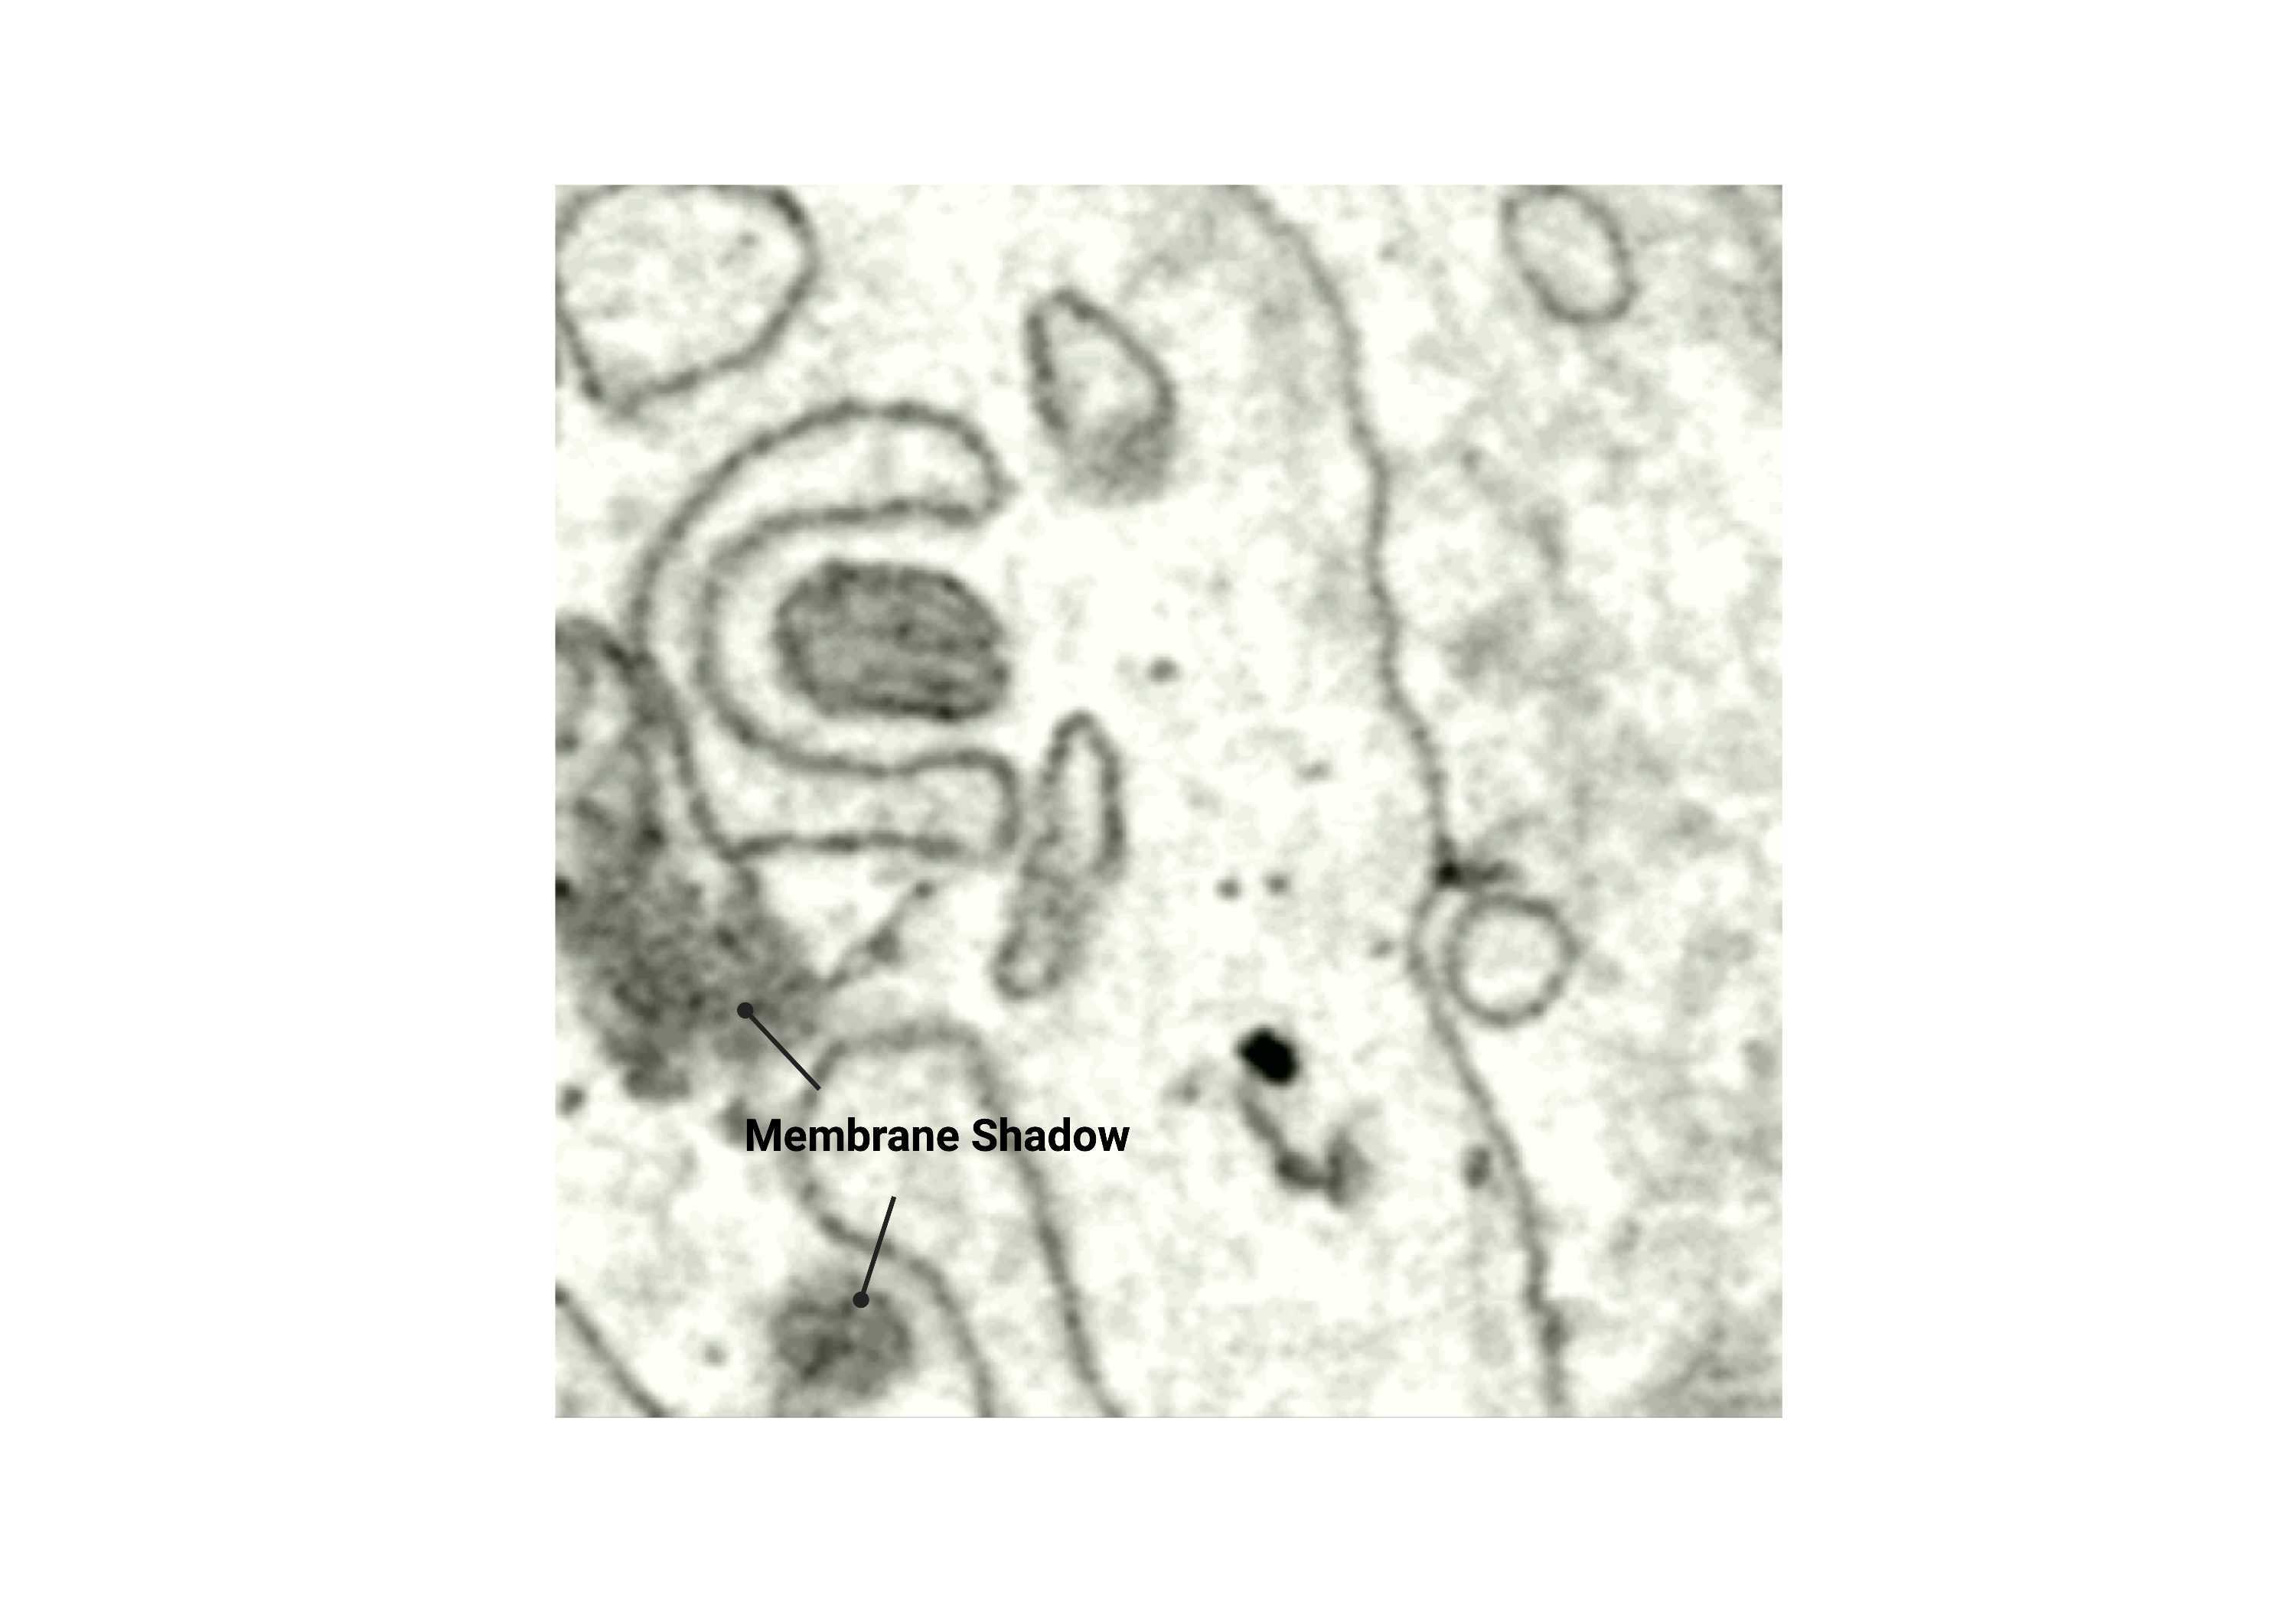
Fig 2.2.3 Membrane Shadow
Jagged edges
- Uneven membrane edges are due to a lack of smoothing or selection based only on one plane.
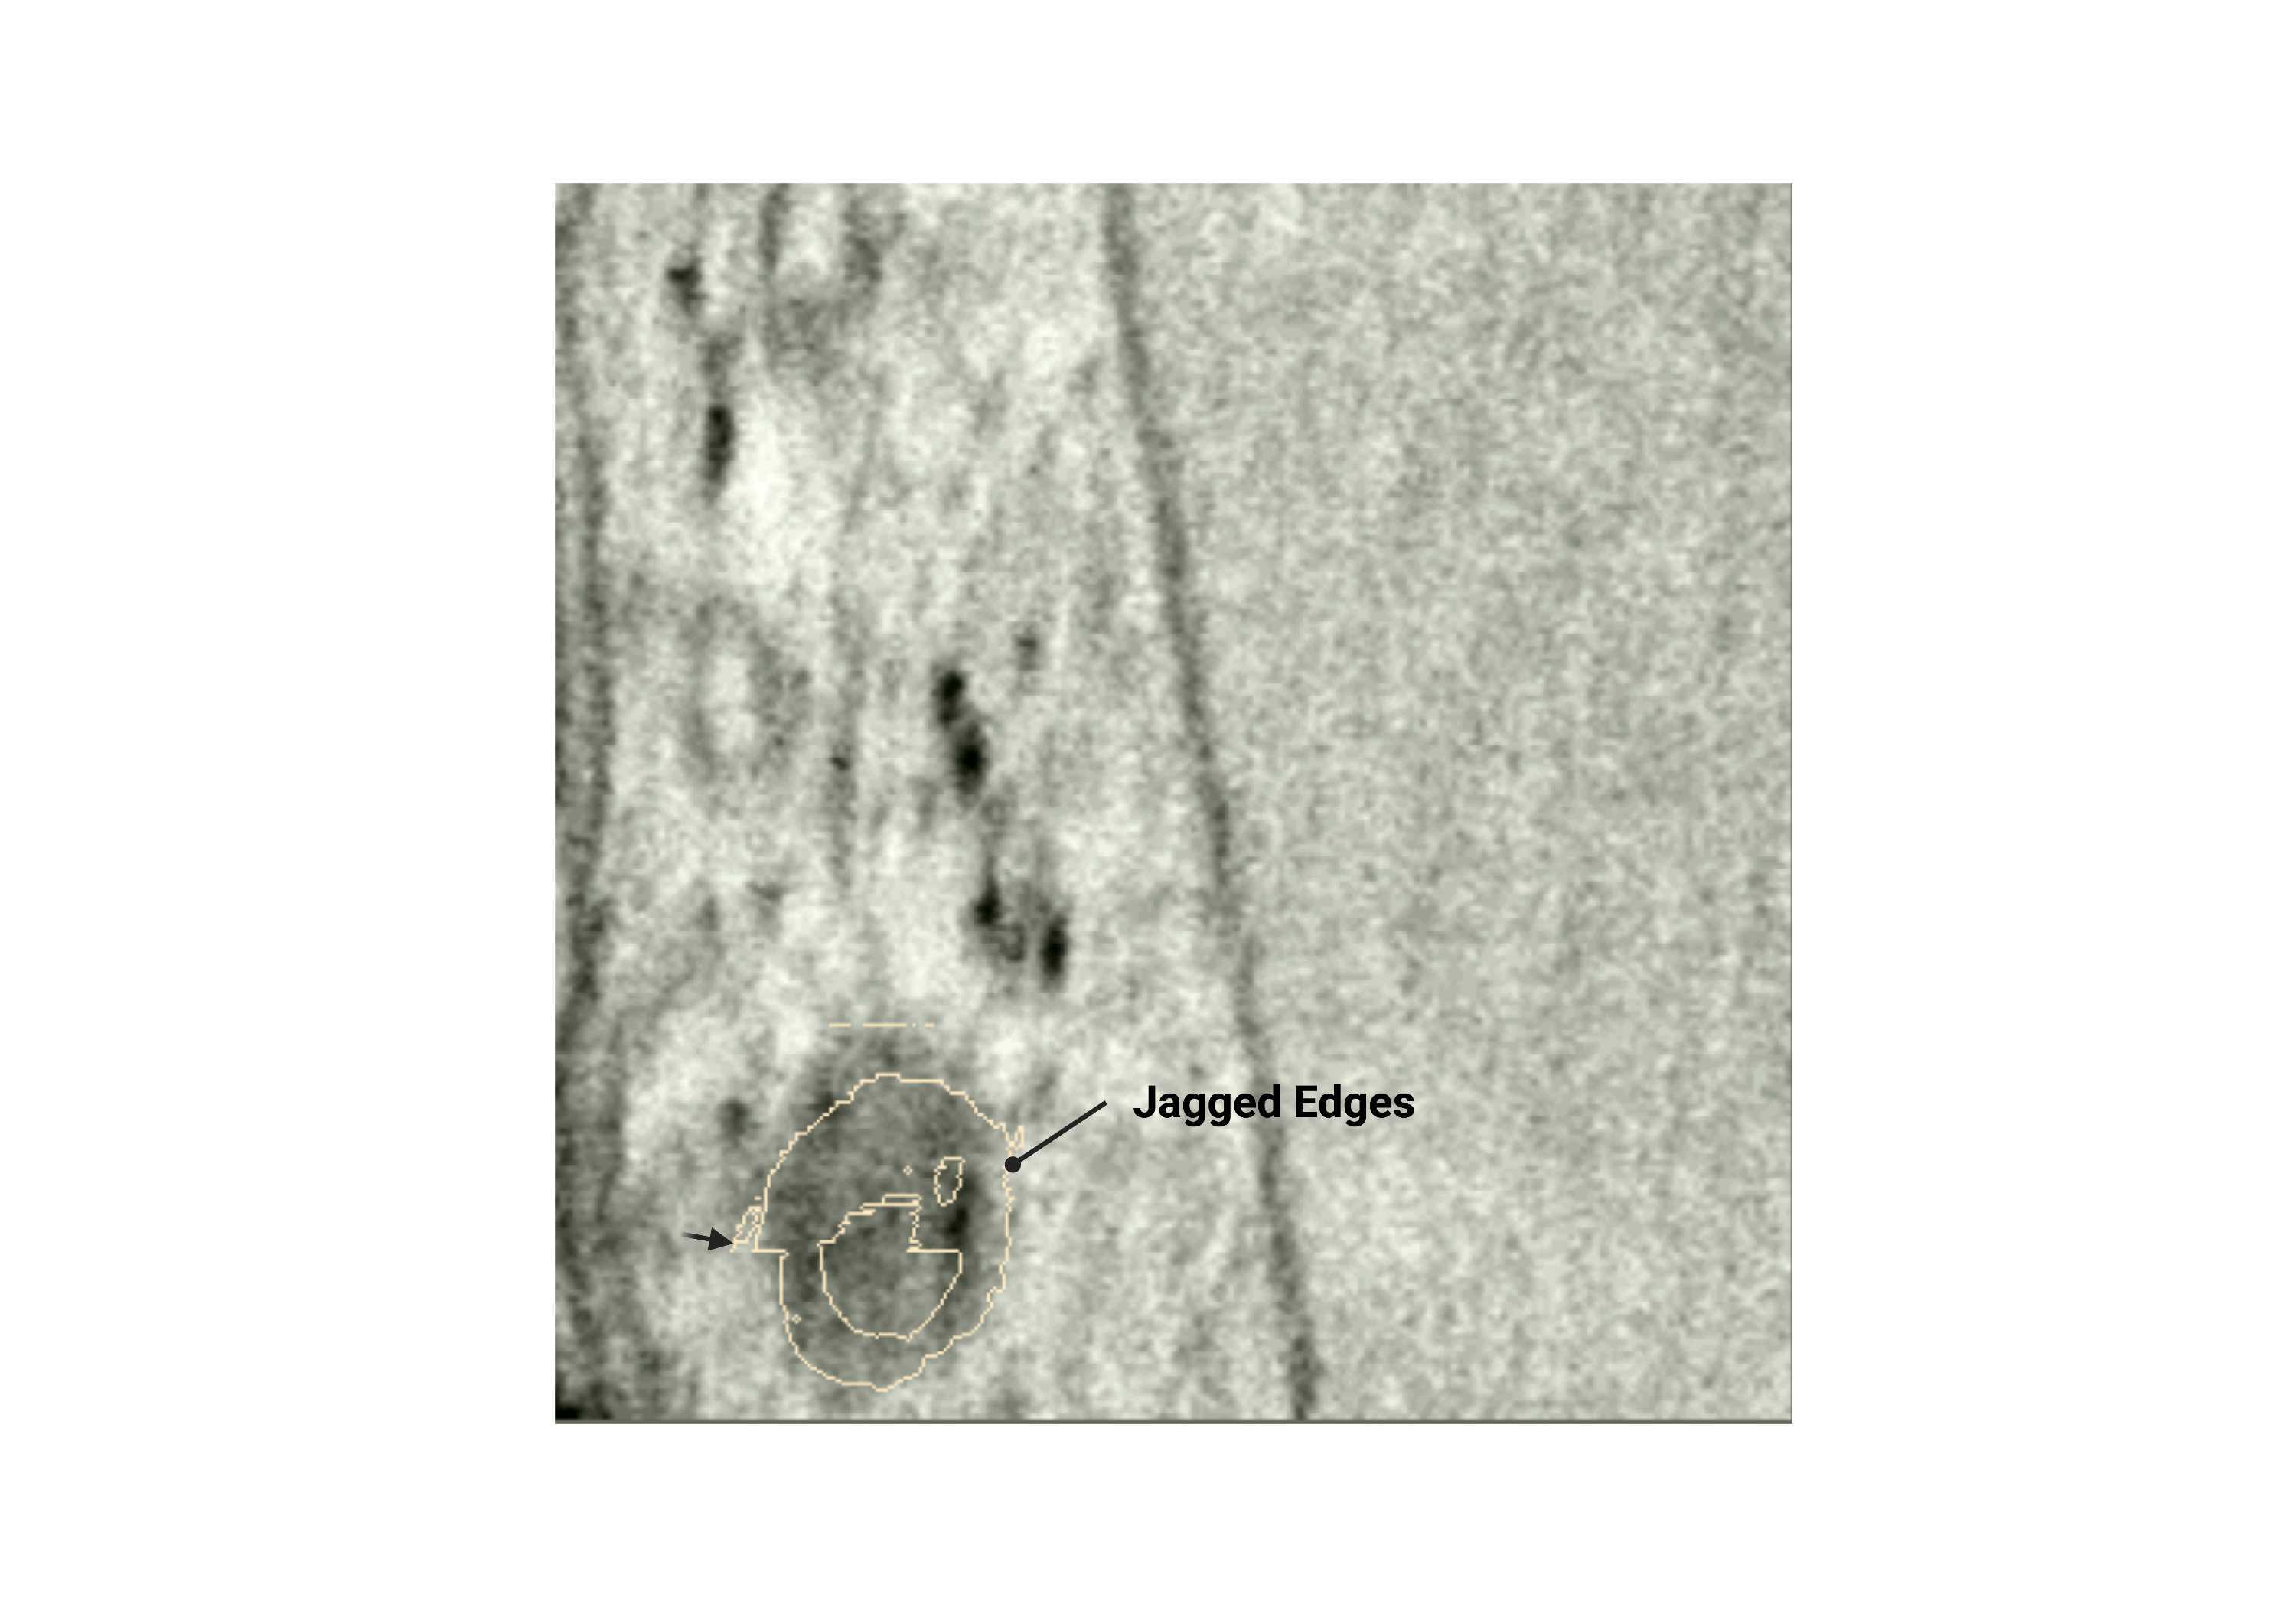
Random pixels (islands)
- Single pixels that are separate from the membrane or lumen. These are usually caused by left-clicking the 2D viewer unintentionally.
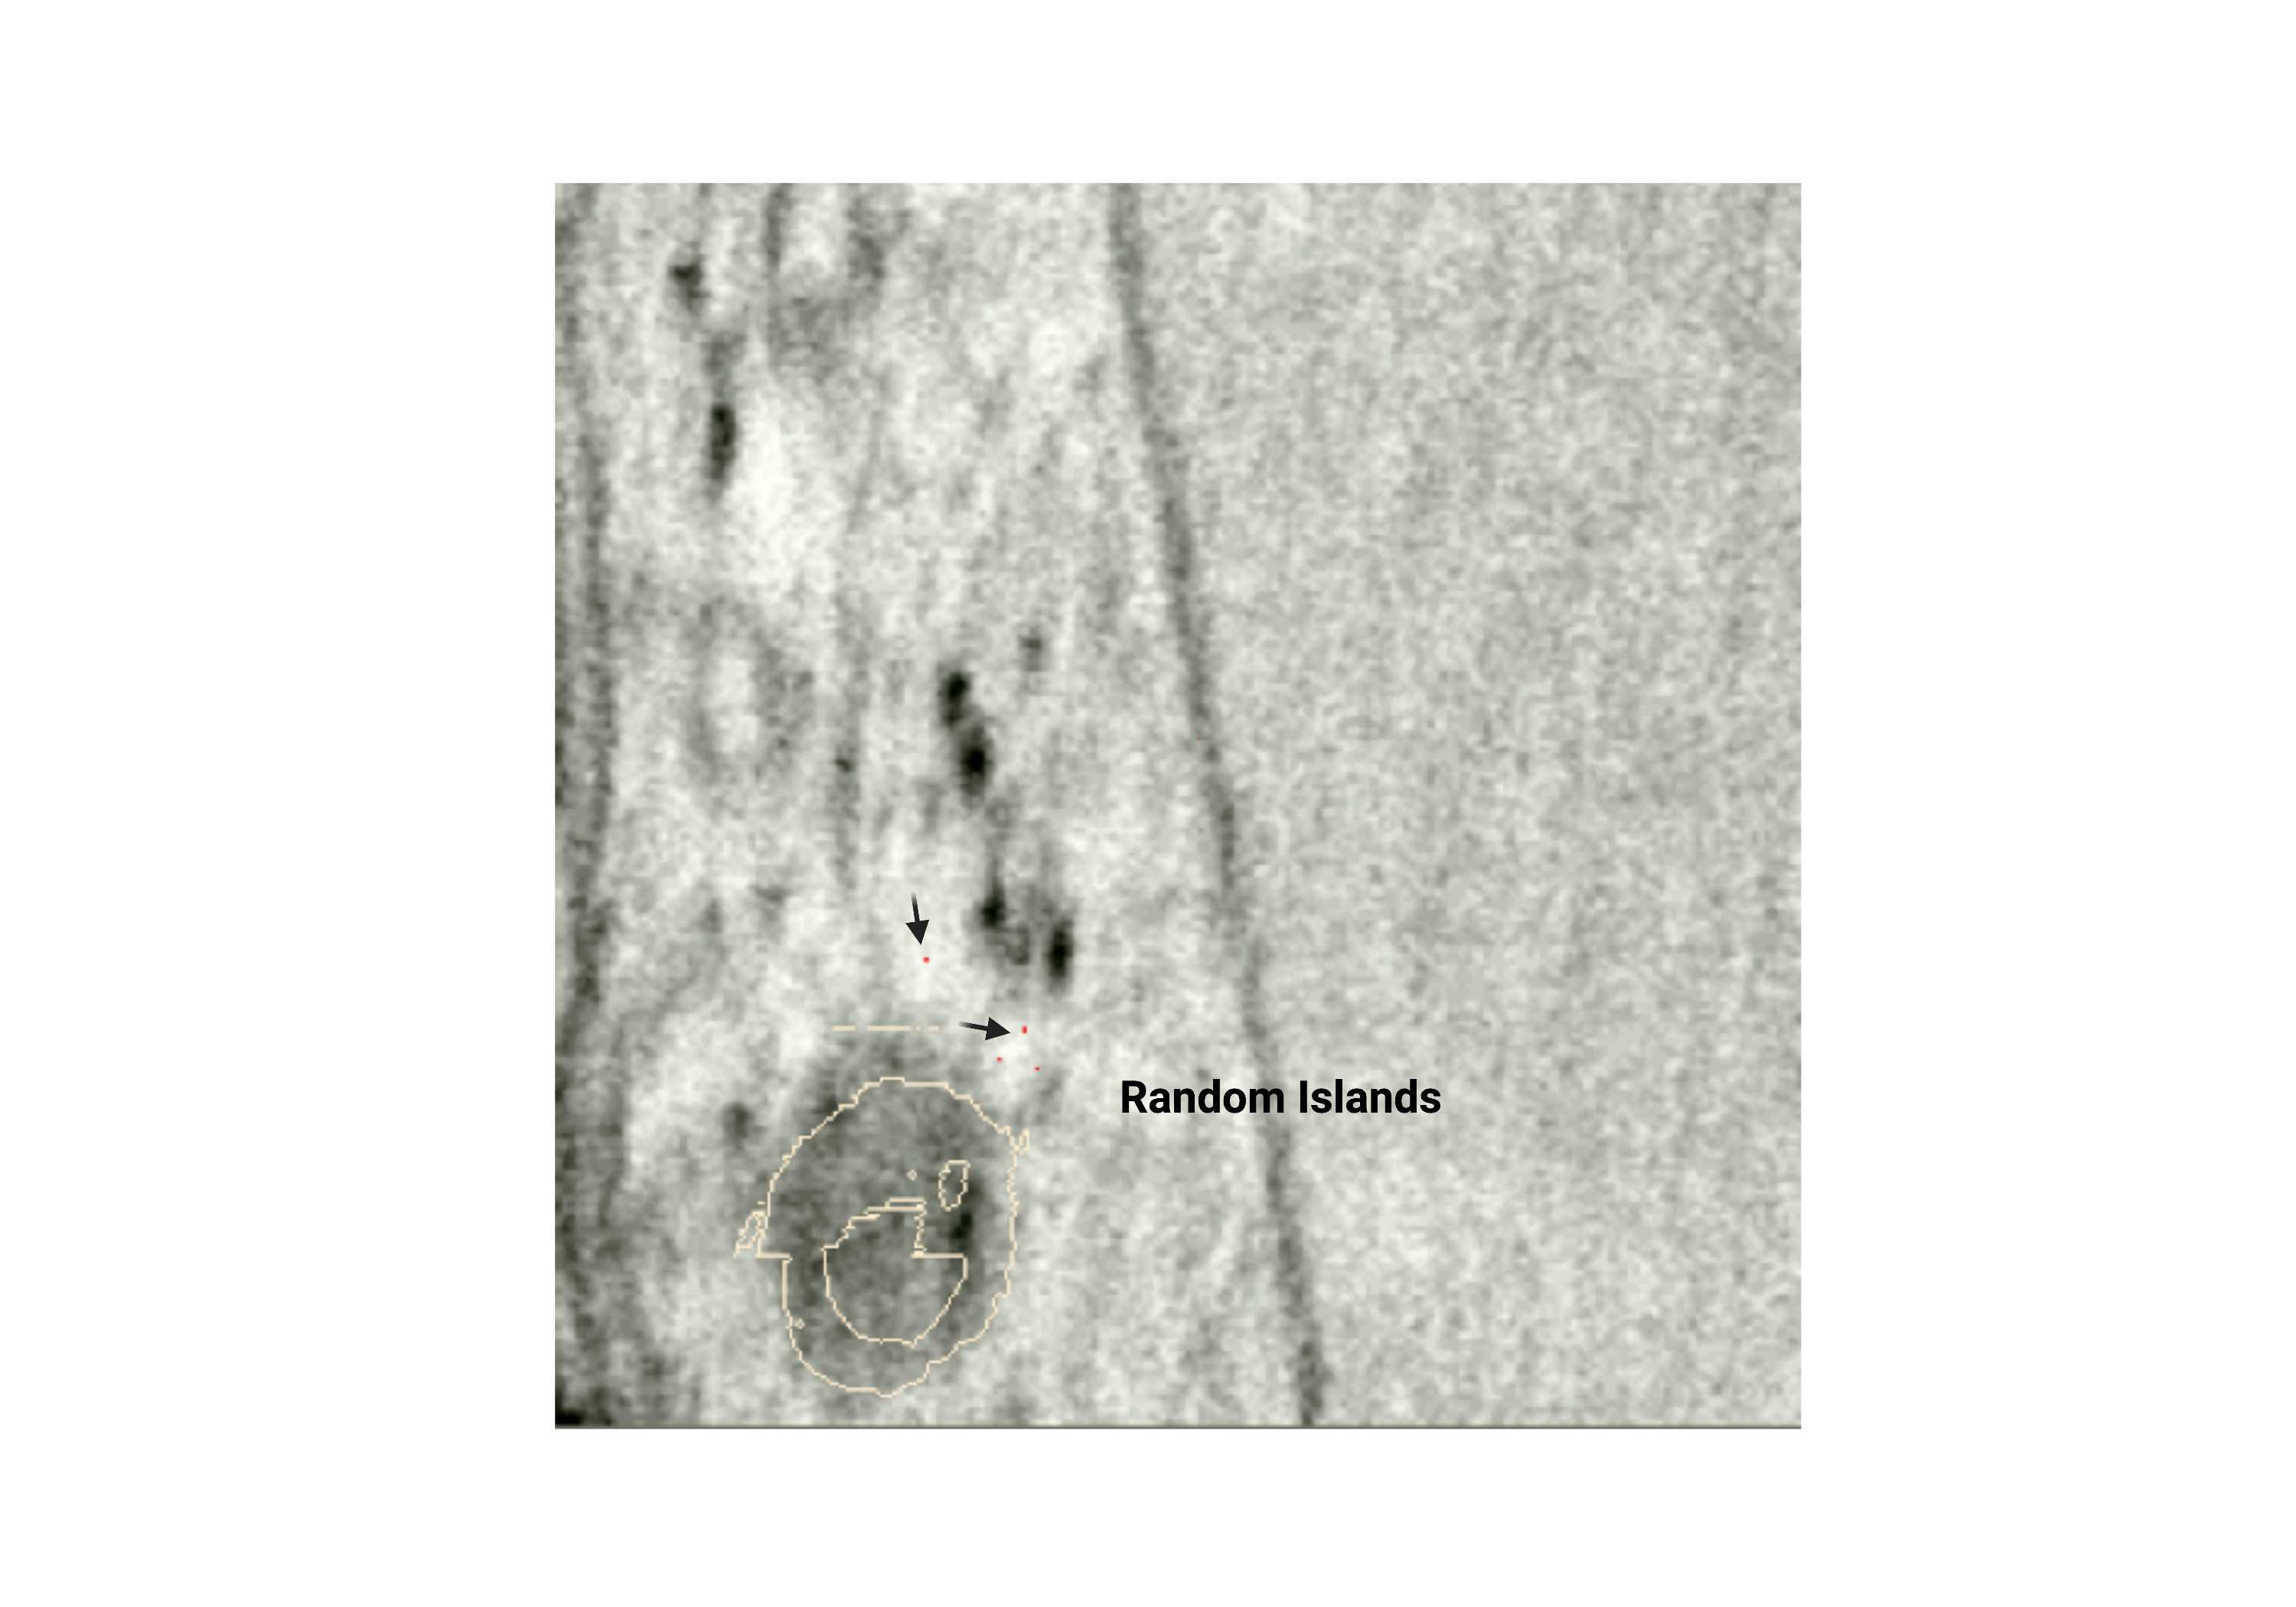
Fig 2.2.5 Random Islands
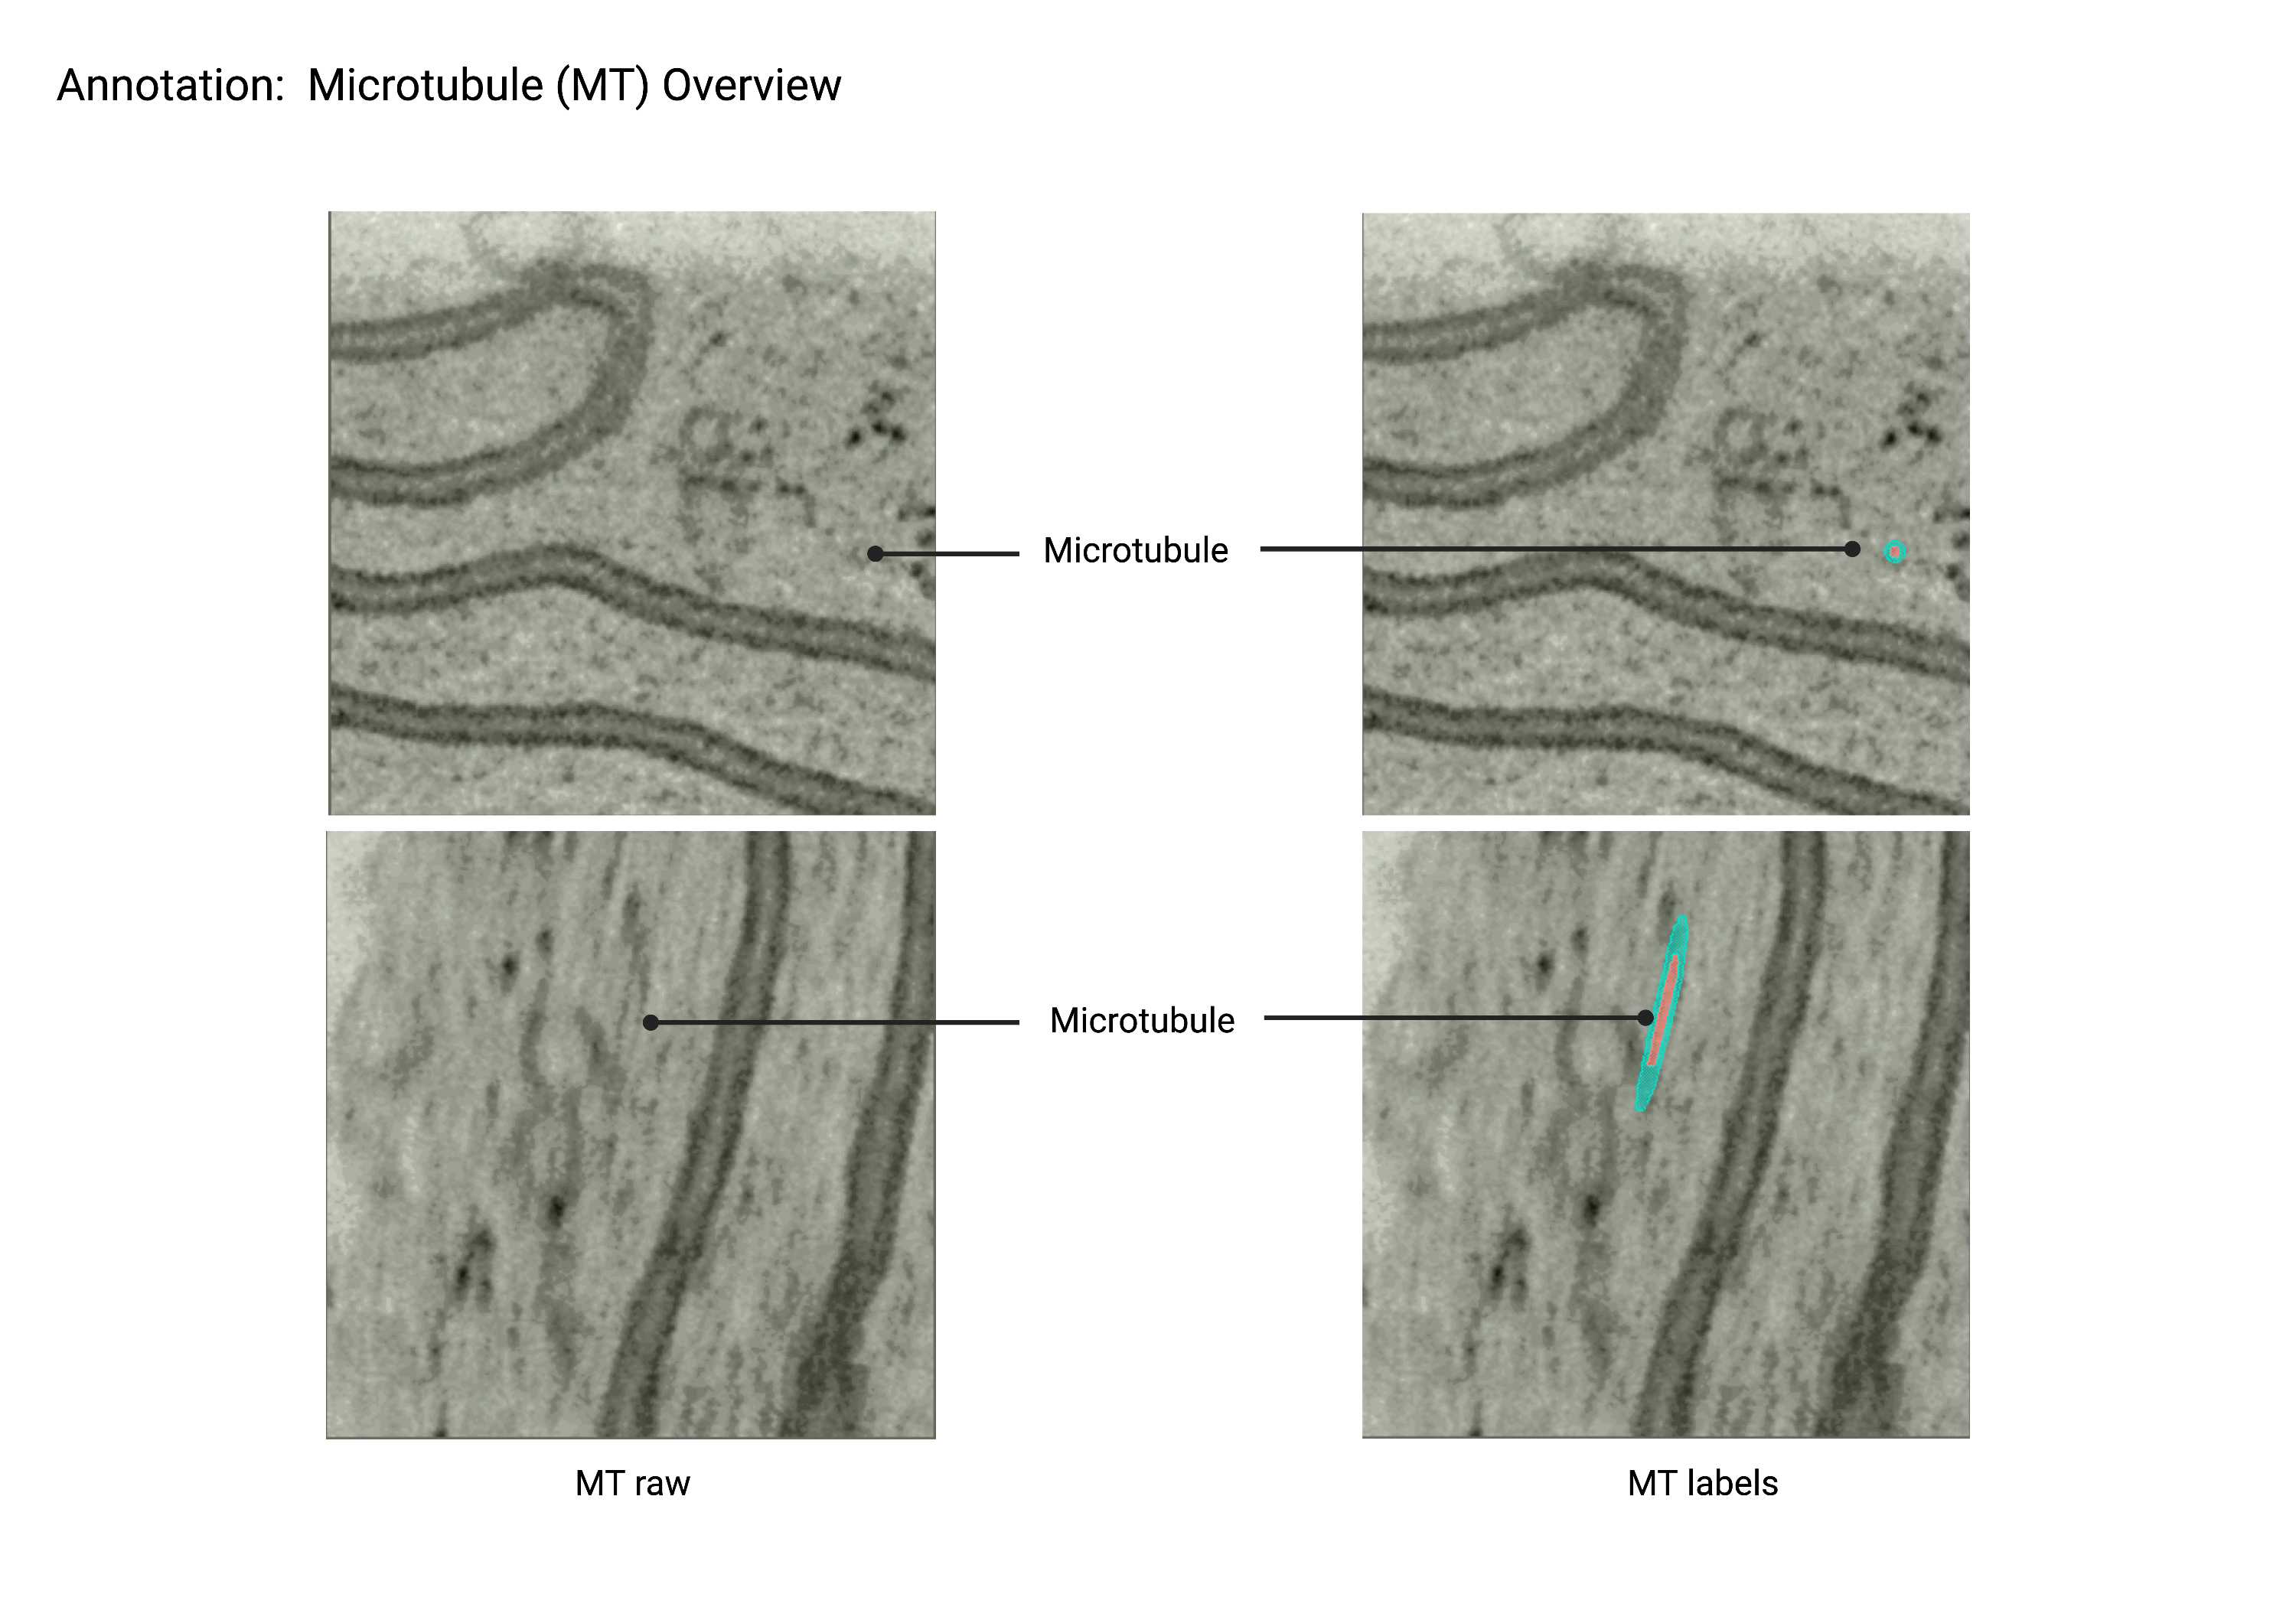
Microtubules out/in
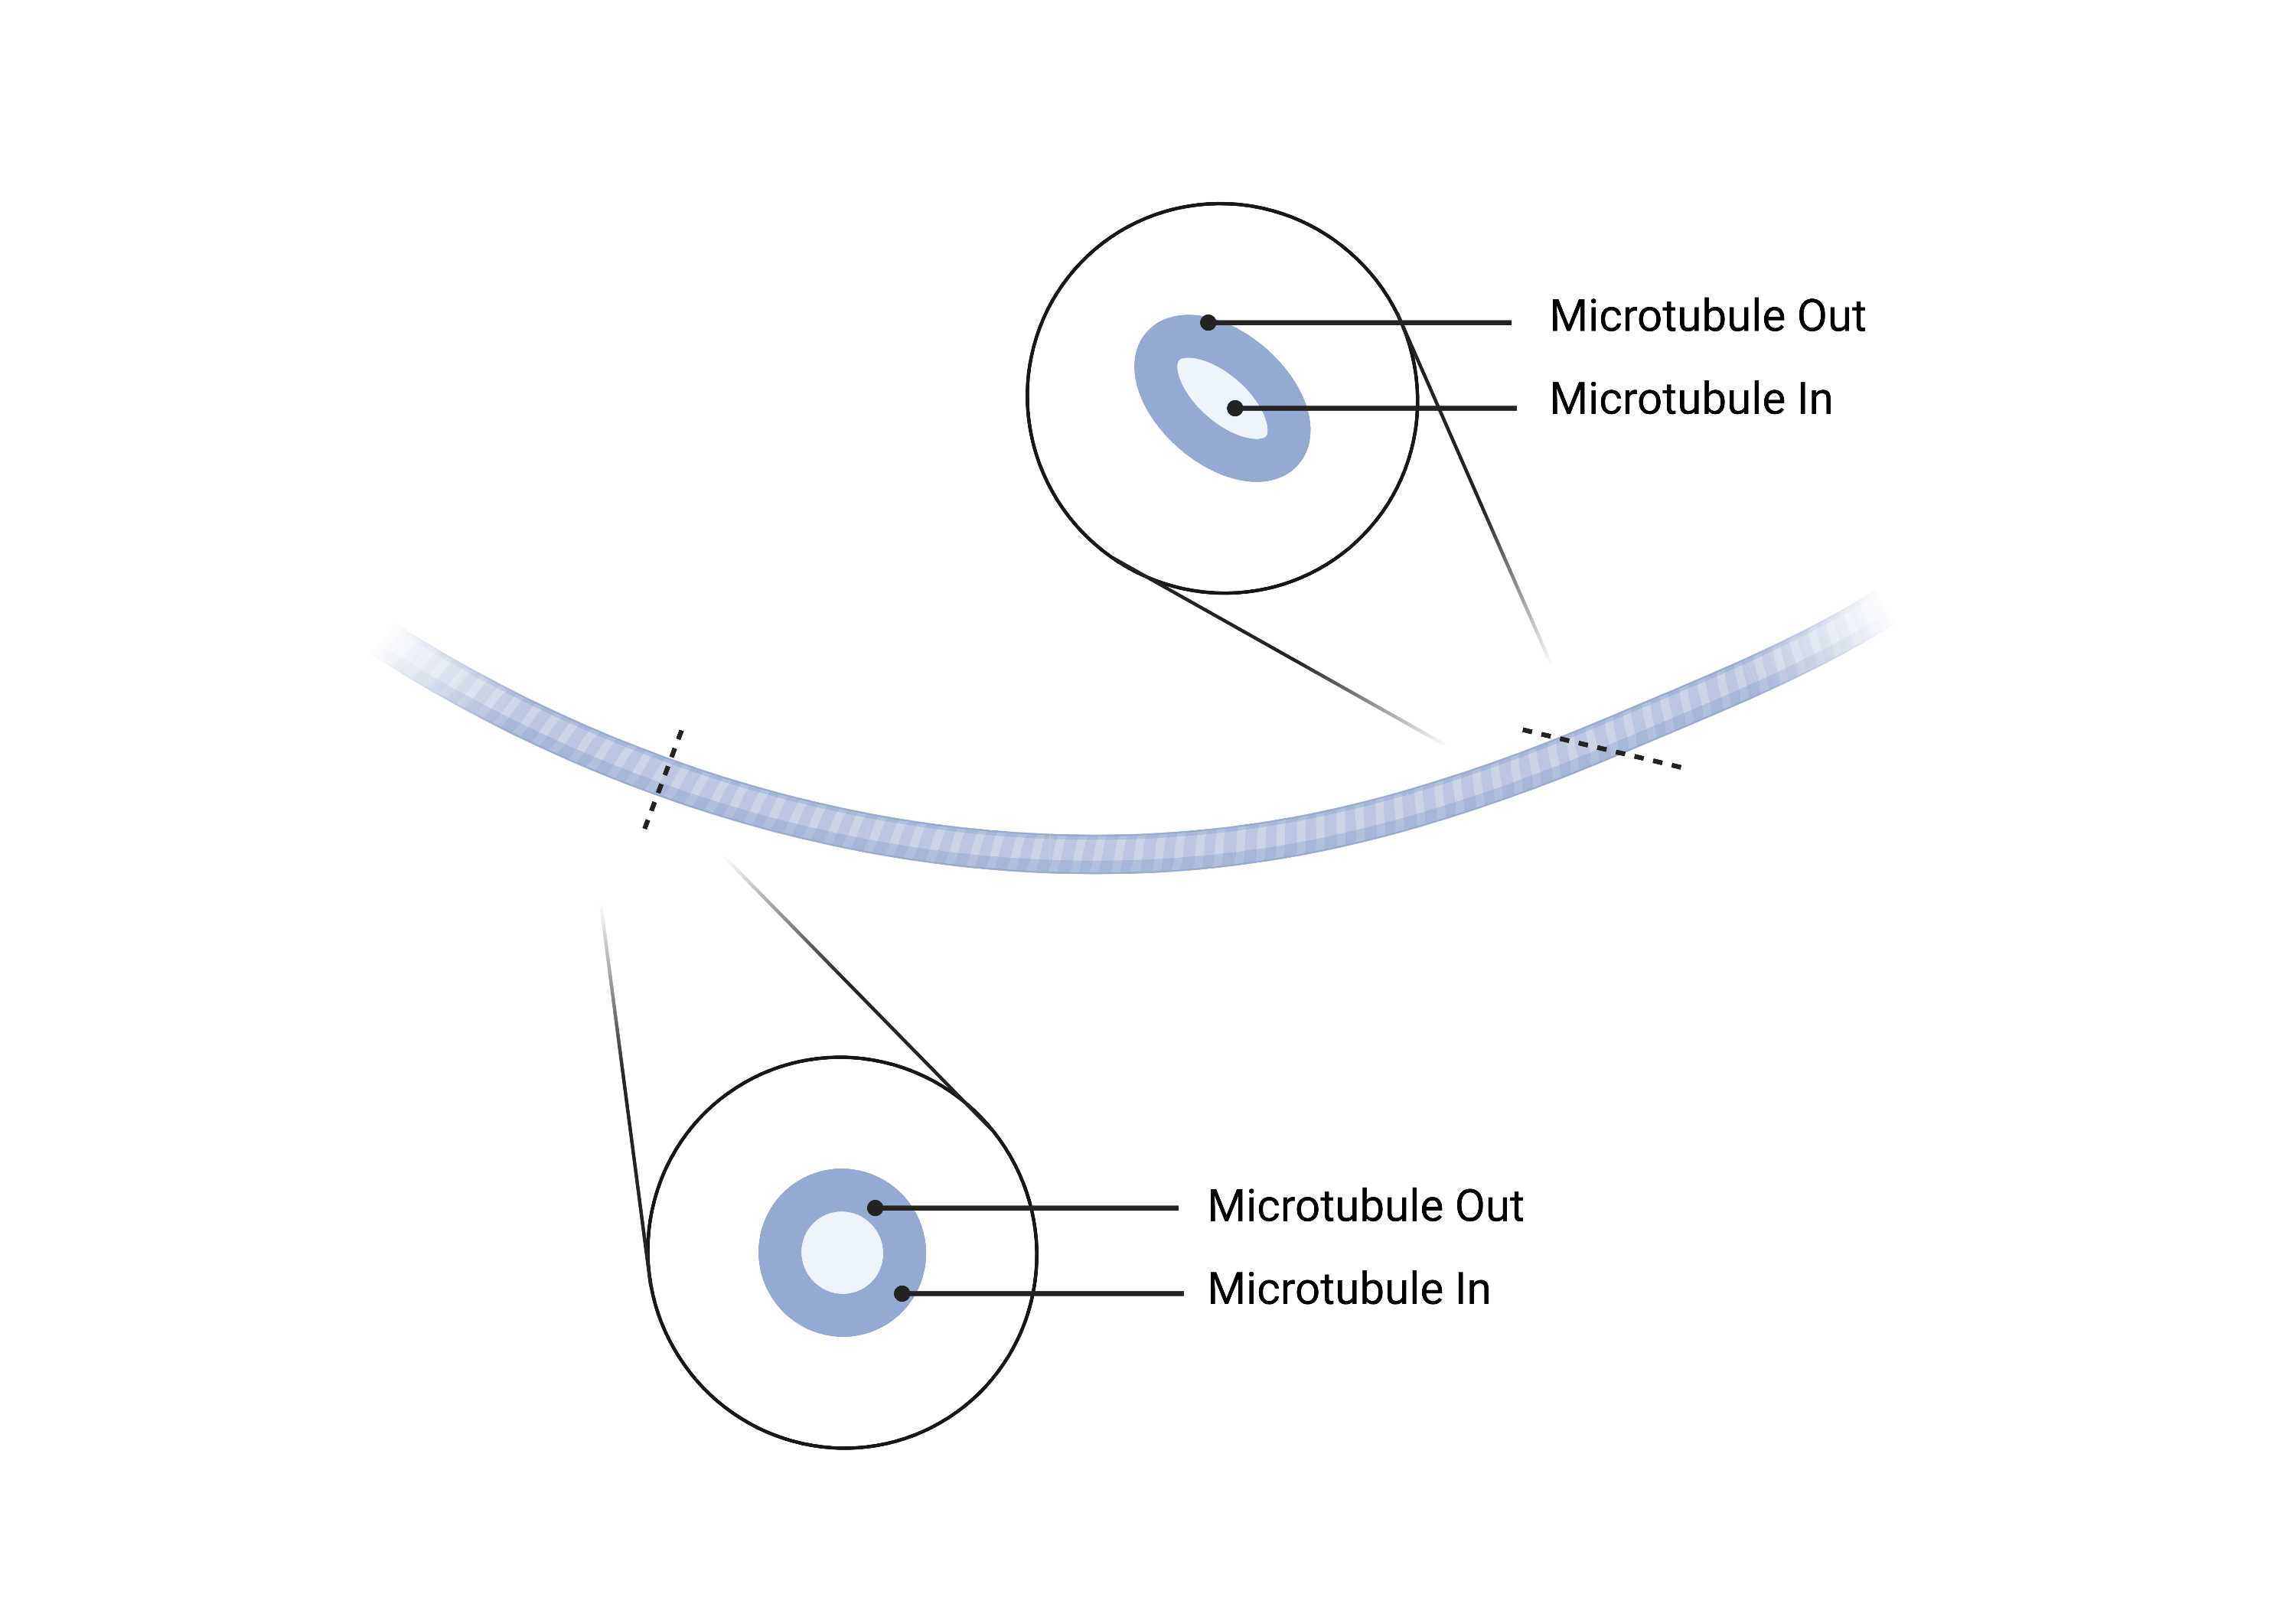
- Microtubules out refer to the tubulins forming the hollow cytoskeleton.
- The hollow region inside the tube is labeled as microtubules in for machine learning classification.
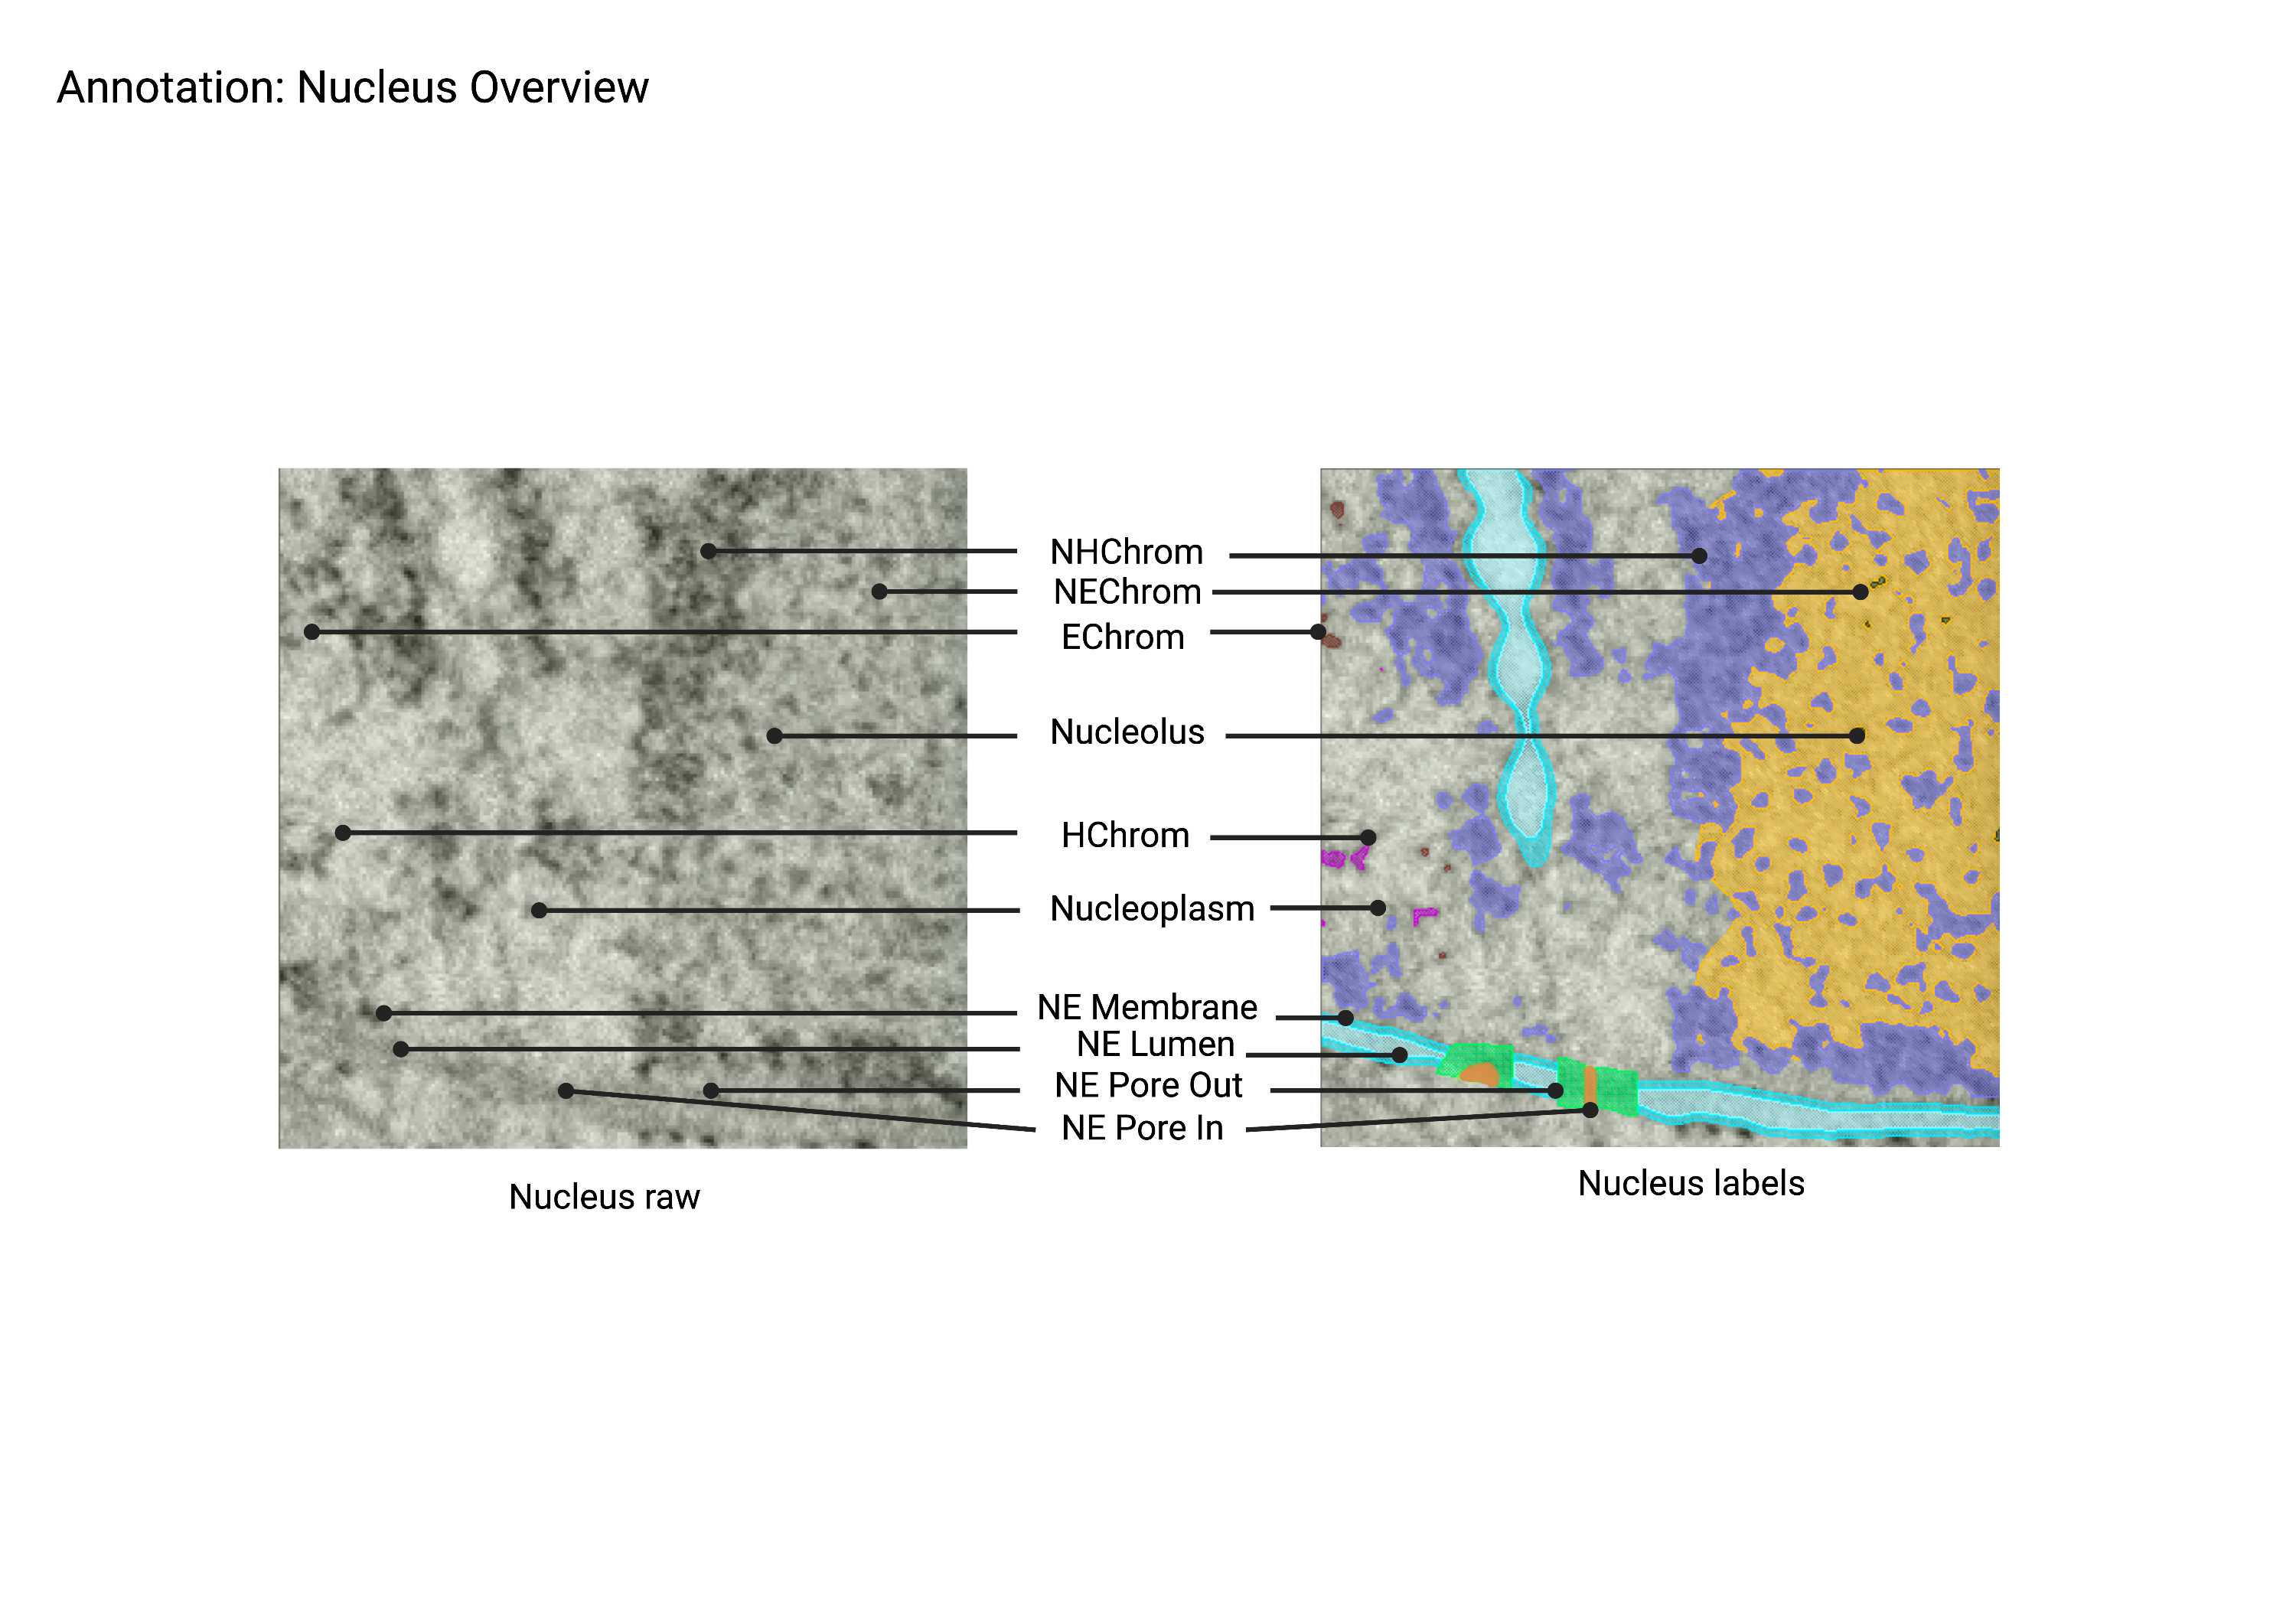
NE (nuclear envelope) pore out/in
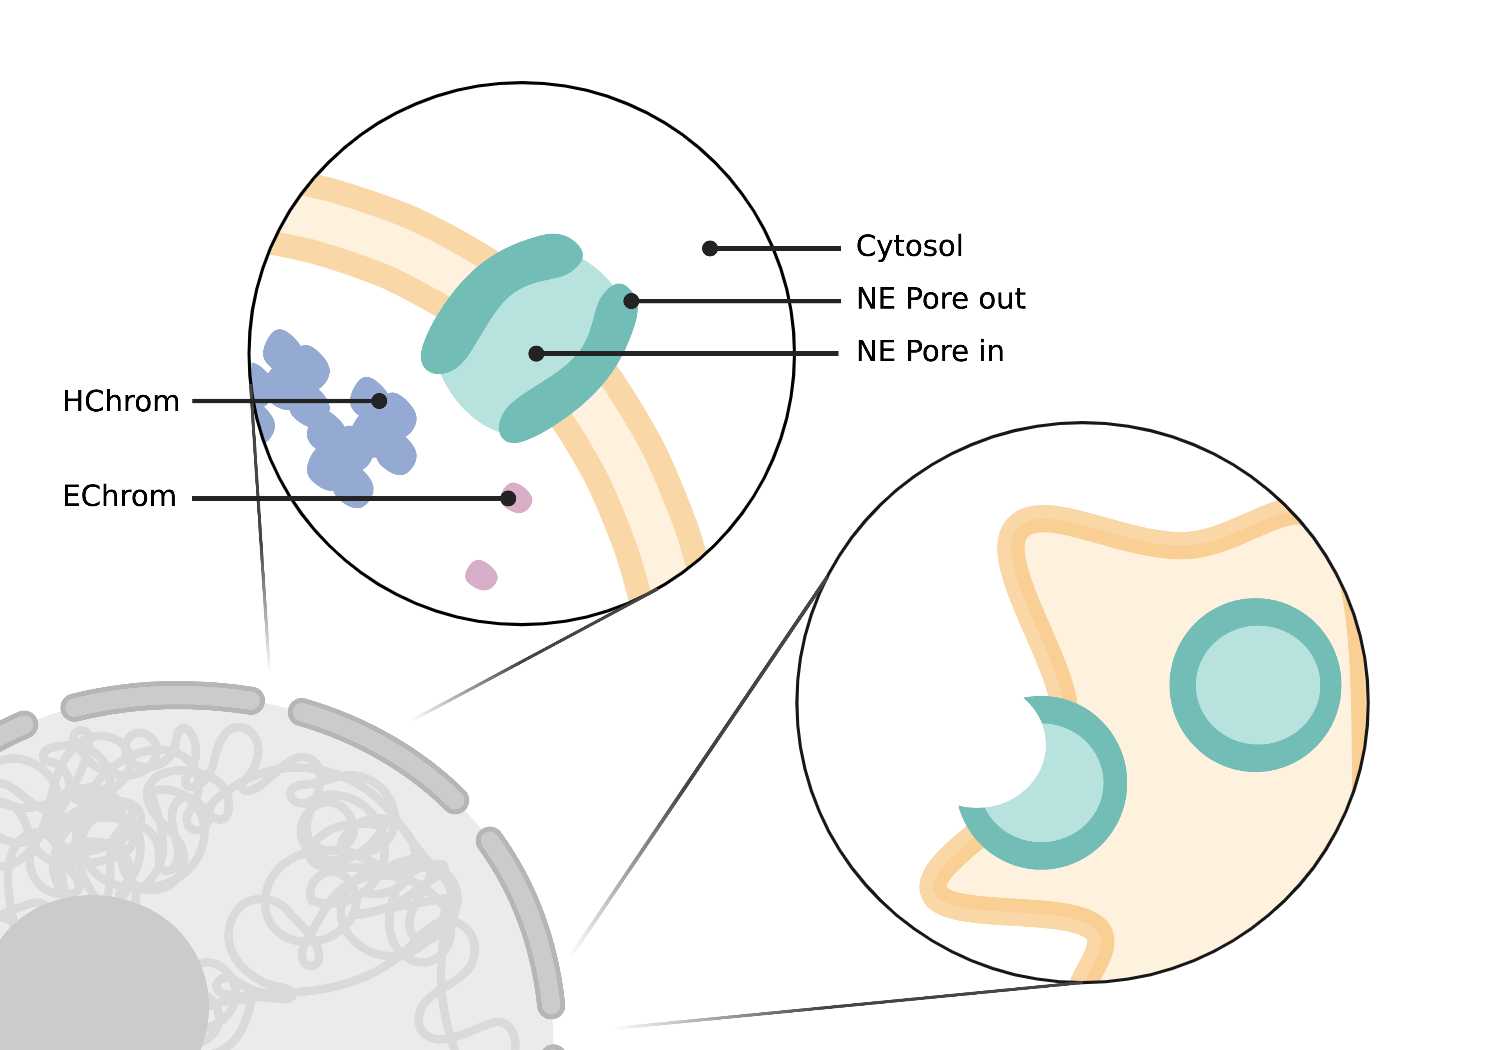
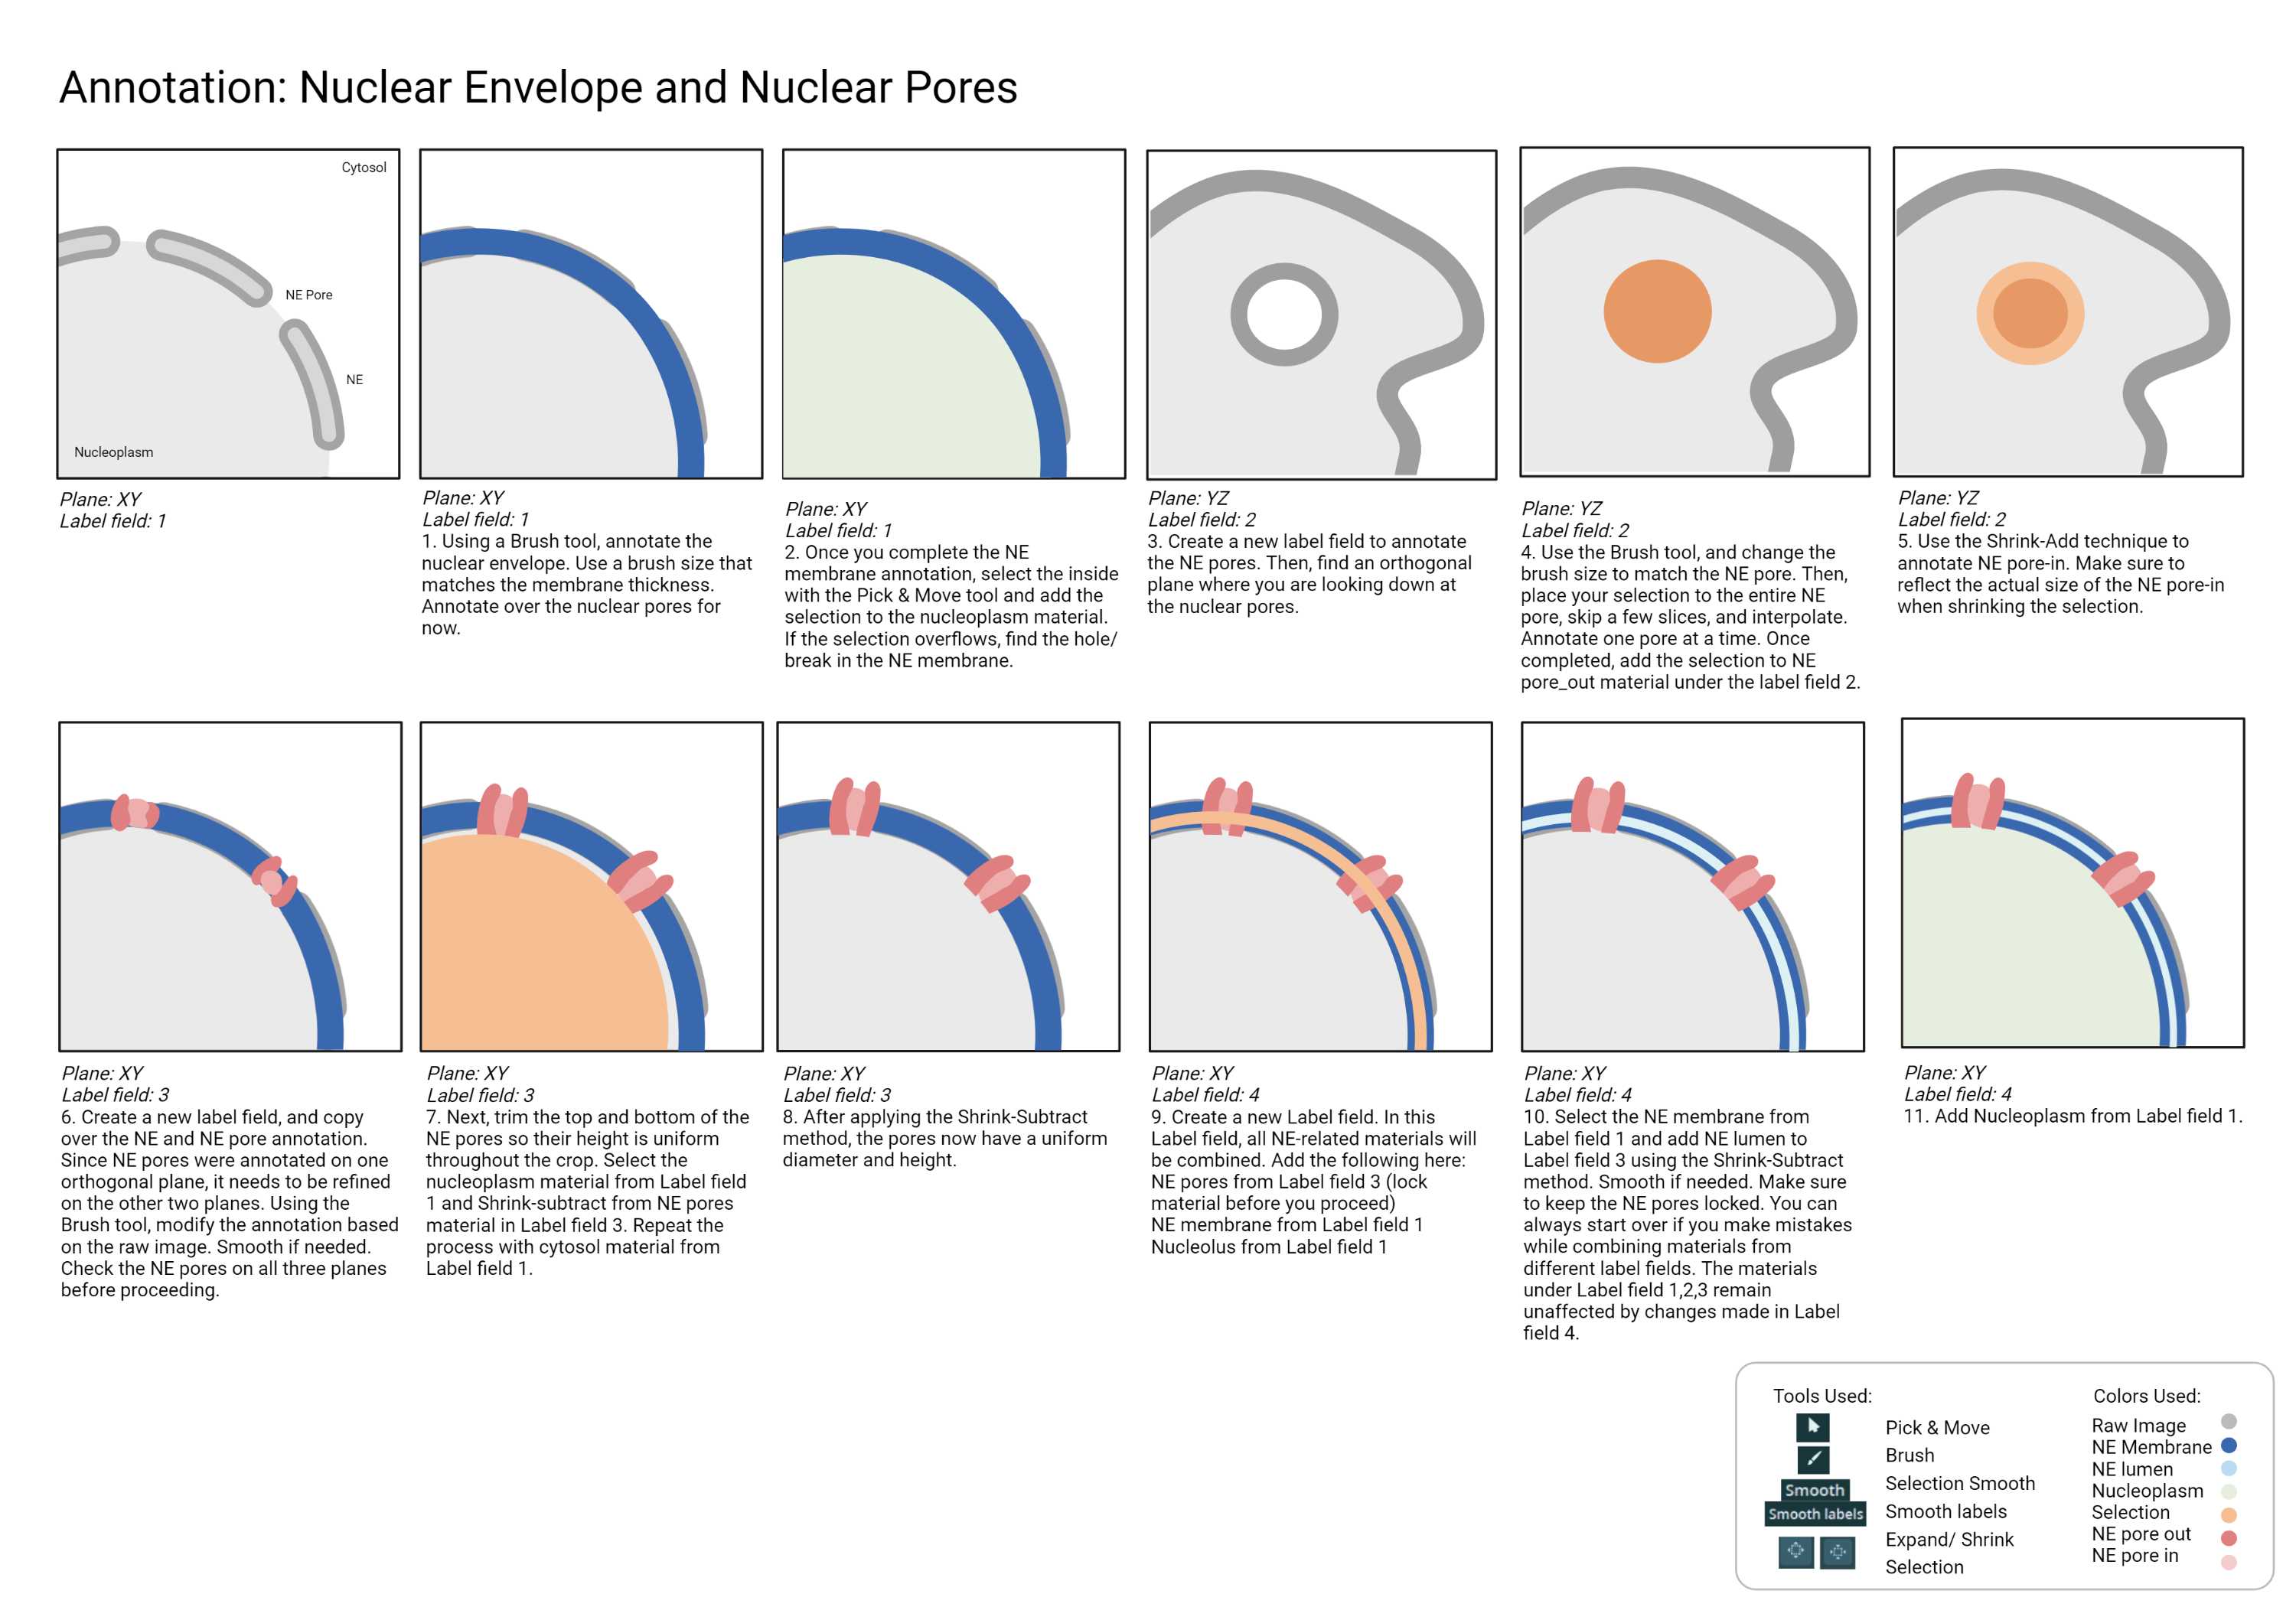
- The NE pore out refers to the NE pore itself. For machine learning classification, the ring-like NE pore complex is labeled as NE pore out, and the opening channel in the middle of the pore is labeled as NE pore in.
Export
- The last step of the annotation. The completed label field is exported as a 3D tif file.
Raw image
- The original FIBSEM image without any annotations.
Crop
- A small region of the EM data that is cropped for annotation
label field
- label fields are where annotations are made. One raw image can have multiple label fields. Annotation made in each label field does not affect annotation made in the other label fields.
Materials
- Annotation is saved to materials. Each material contains voxels with the same ID.
Filter
- This can be applied to the raw image to further process the data (e.g. smoothing and de-noise).
Labels/label fields
- Annotations made on the raw image.
Touching
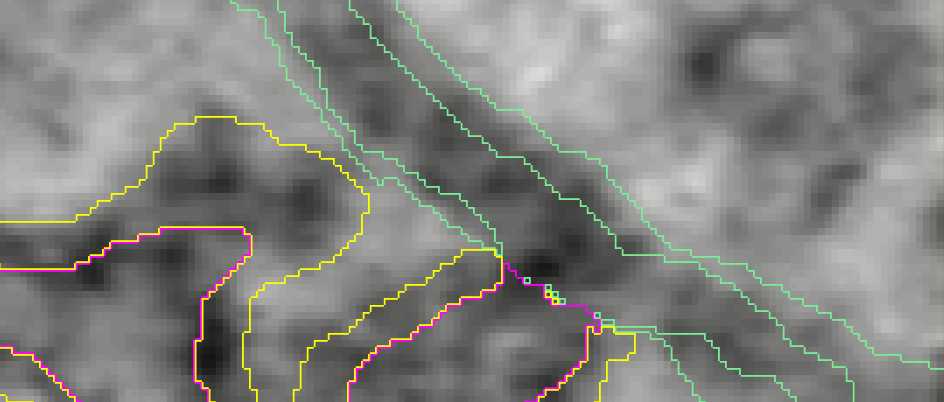
- When membranes are conjoined together with no exterior or cytosol pixels in between.
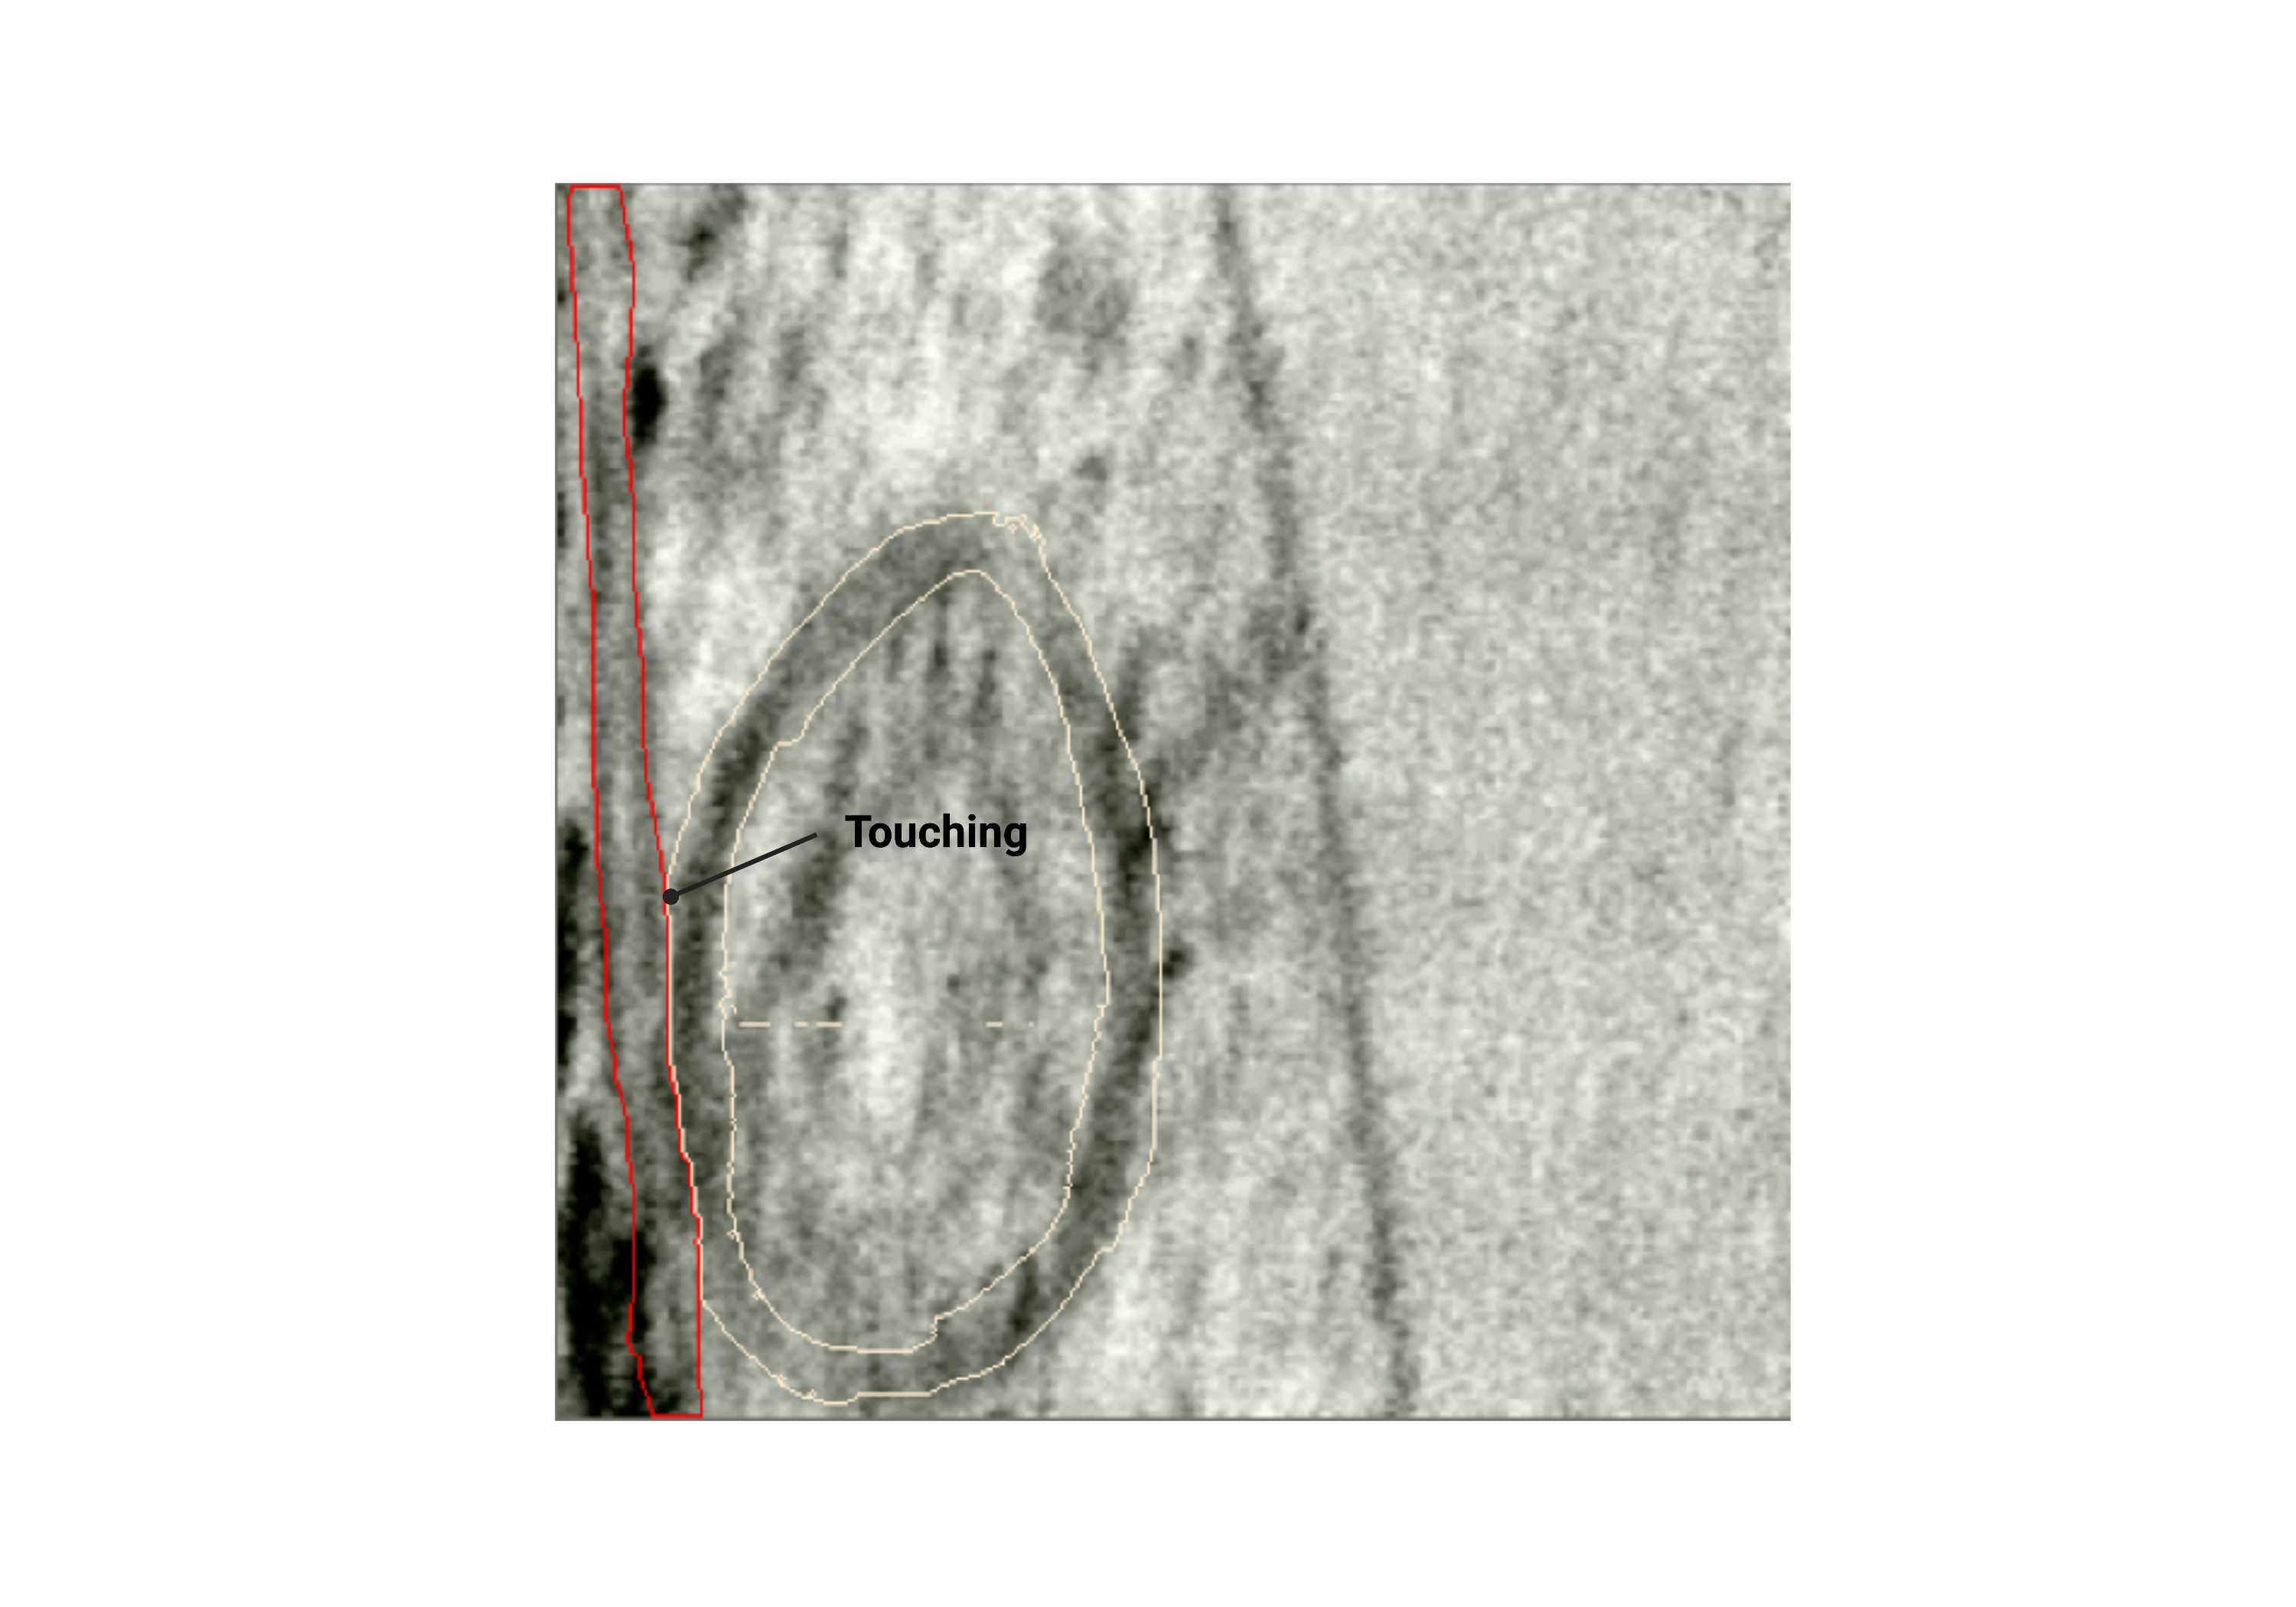
Fig 2.2.6 Touching
Separate
- Force space between touching membranes.
Merge
- Combine two different materials together.
Common Annotation Mistakes
The examples below show some annotation mistakes commonly found among beginners. Please read them before annotating and return to this section after completing your annotation to use the examples as a checklist.
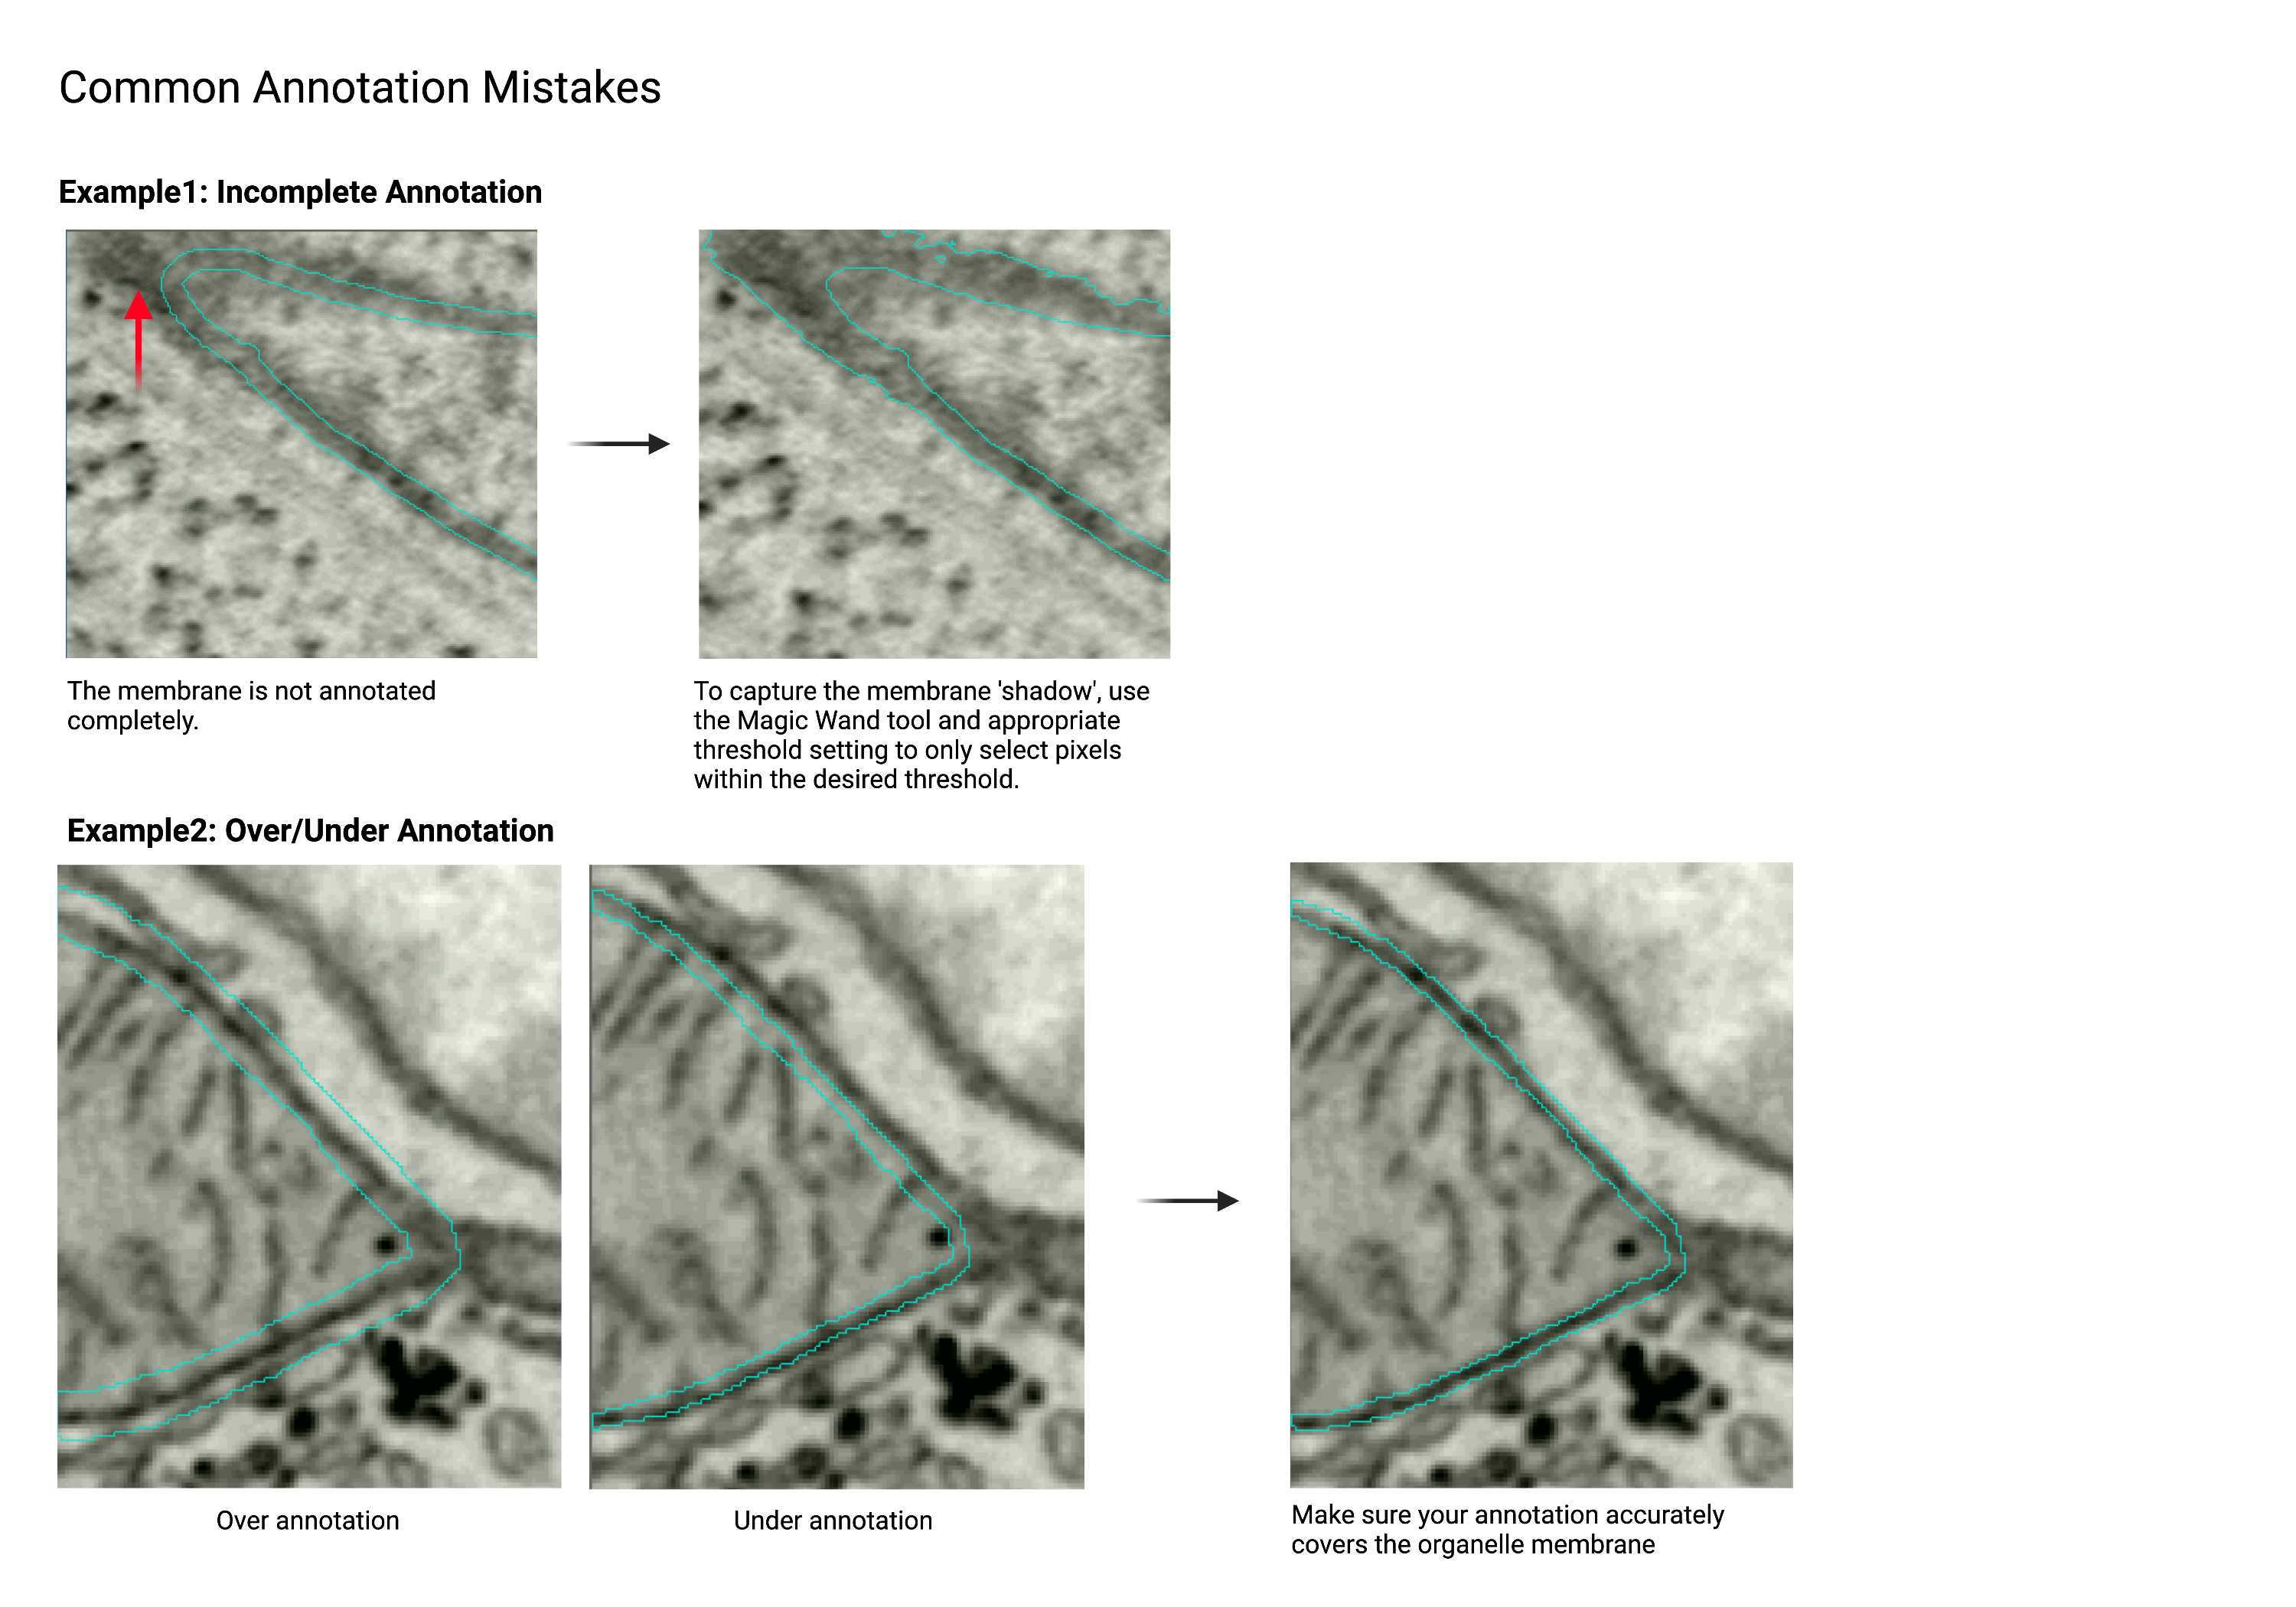
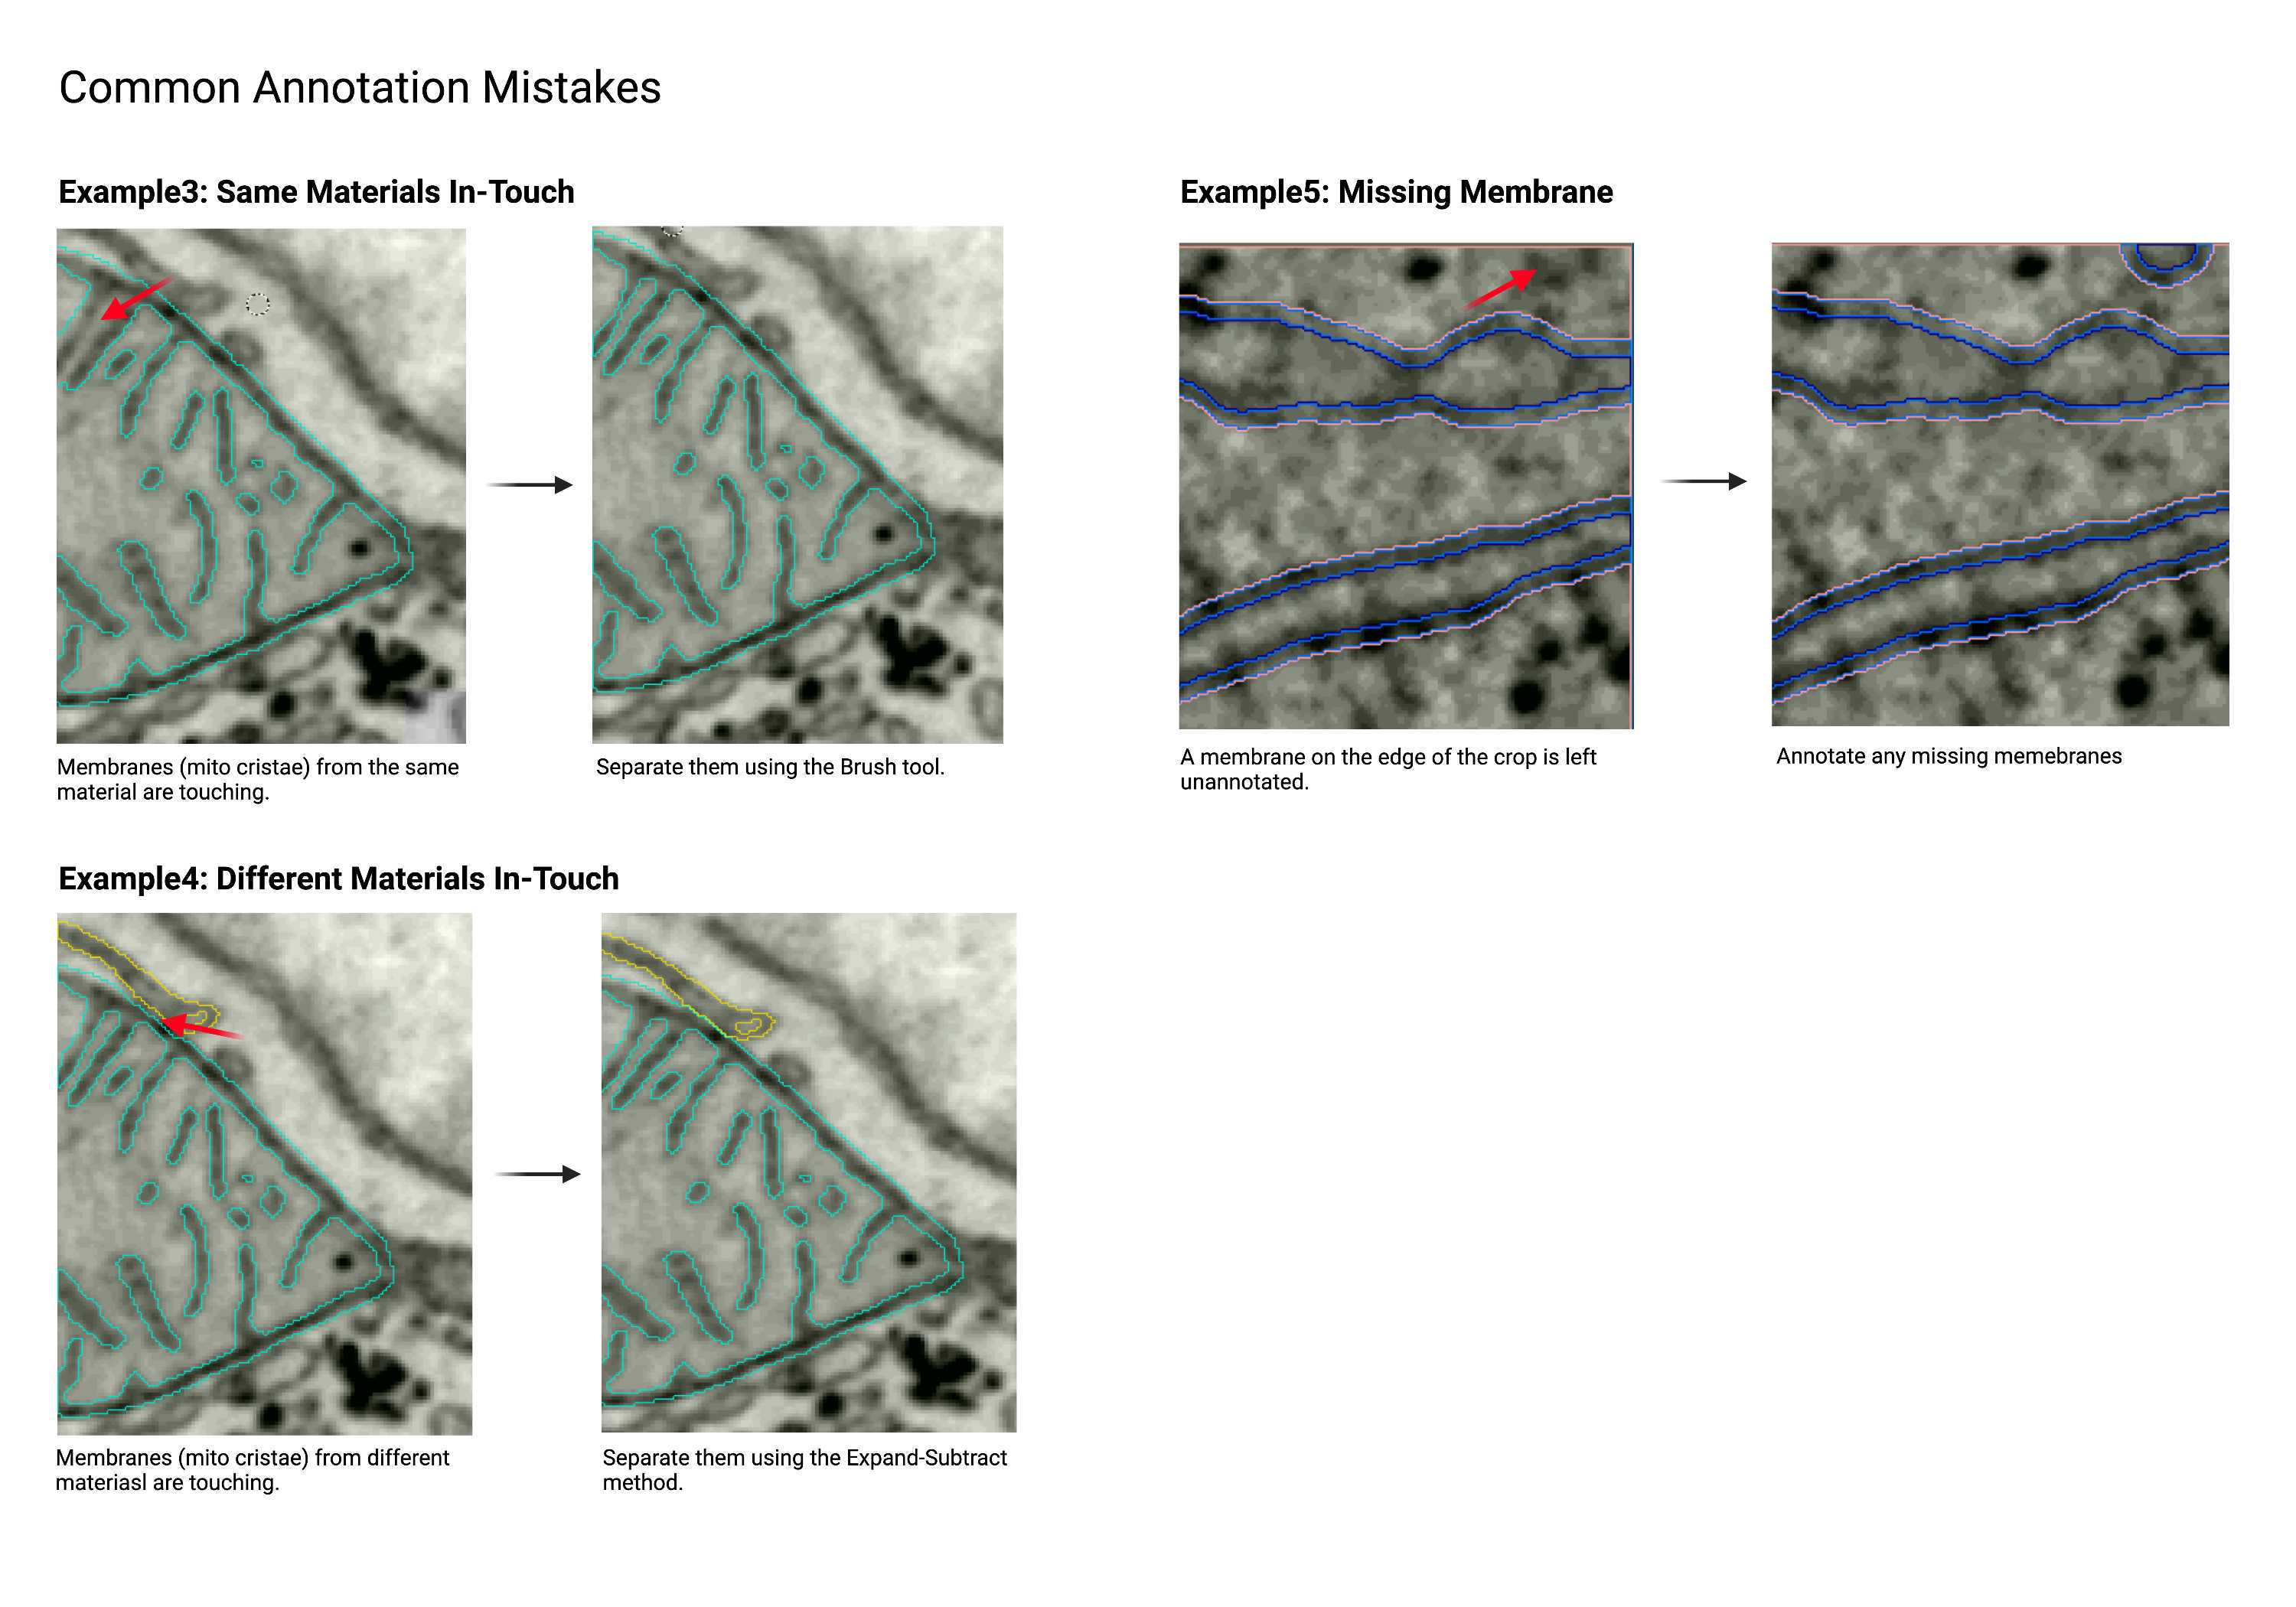
Keyboard Shortcuts
Annotation Techniques
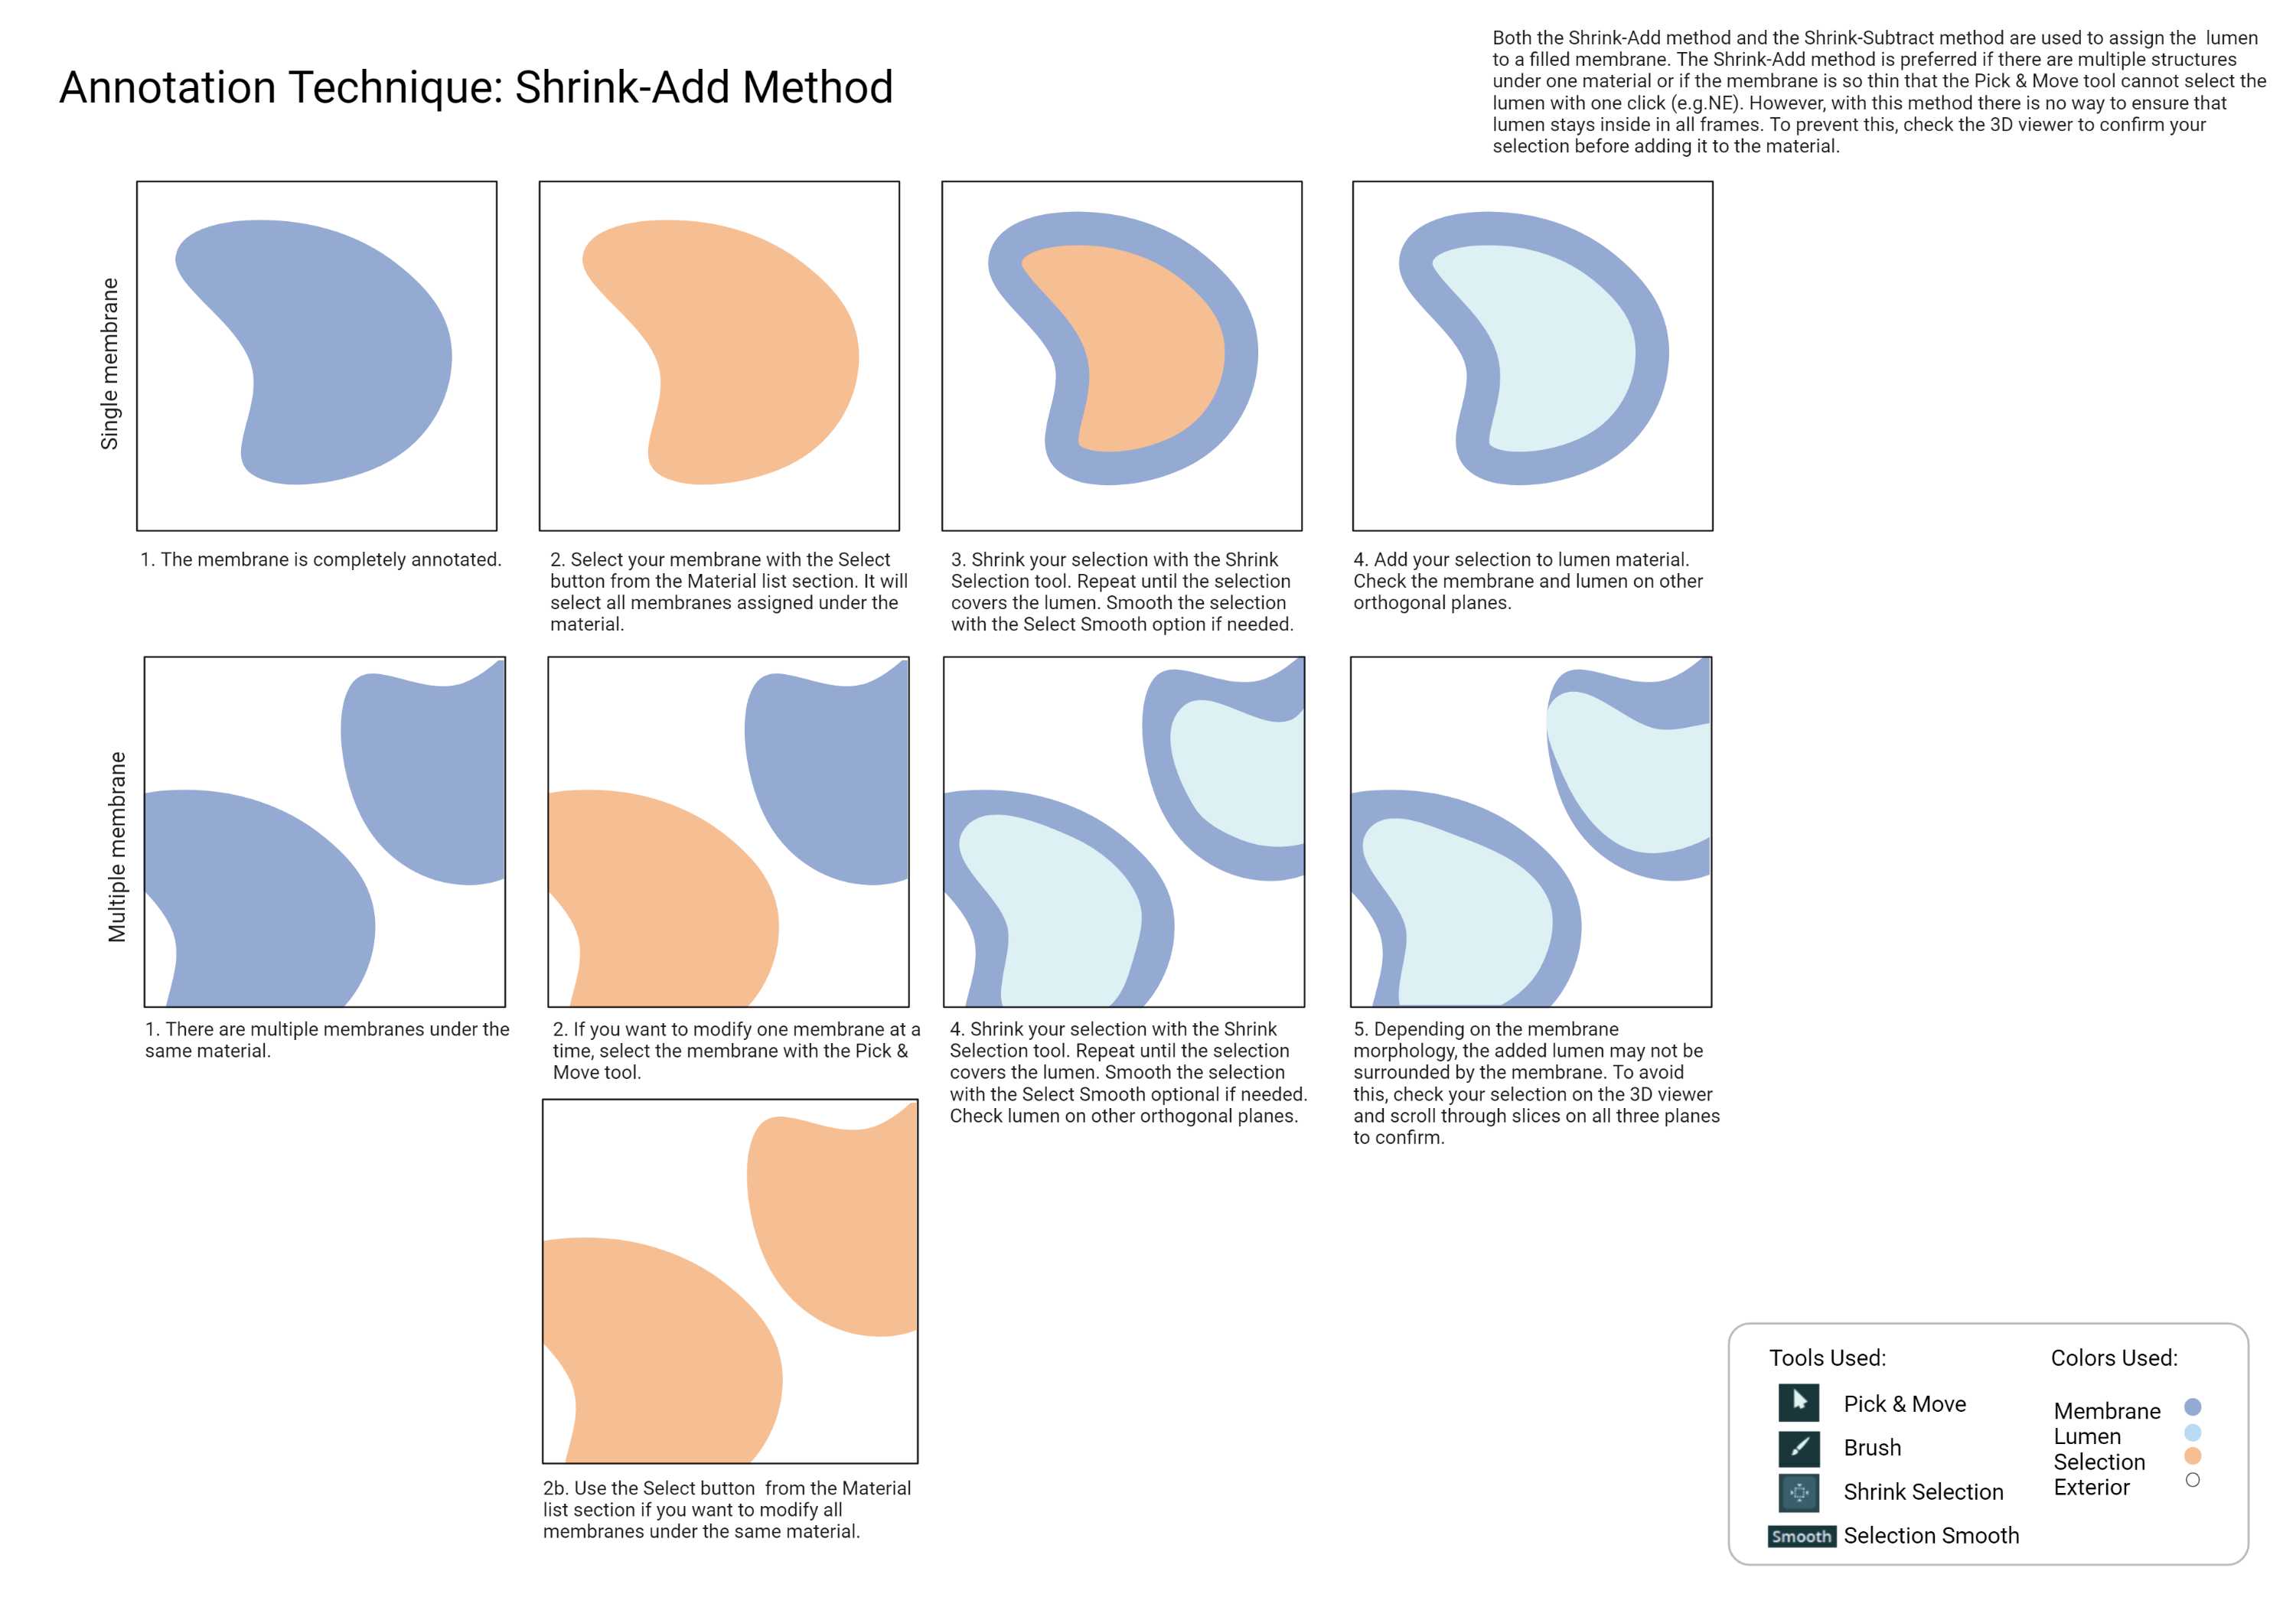
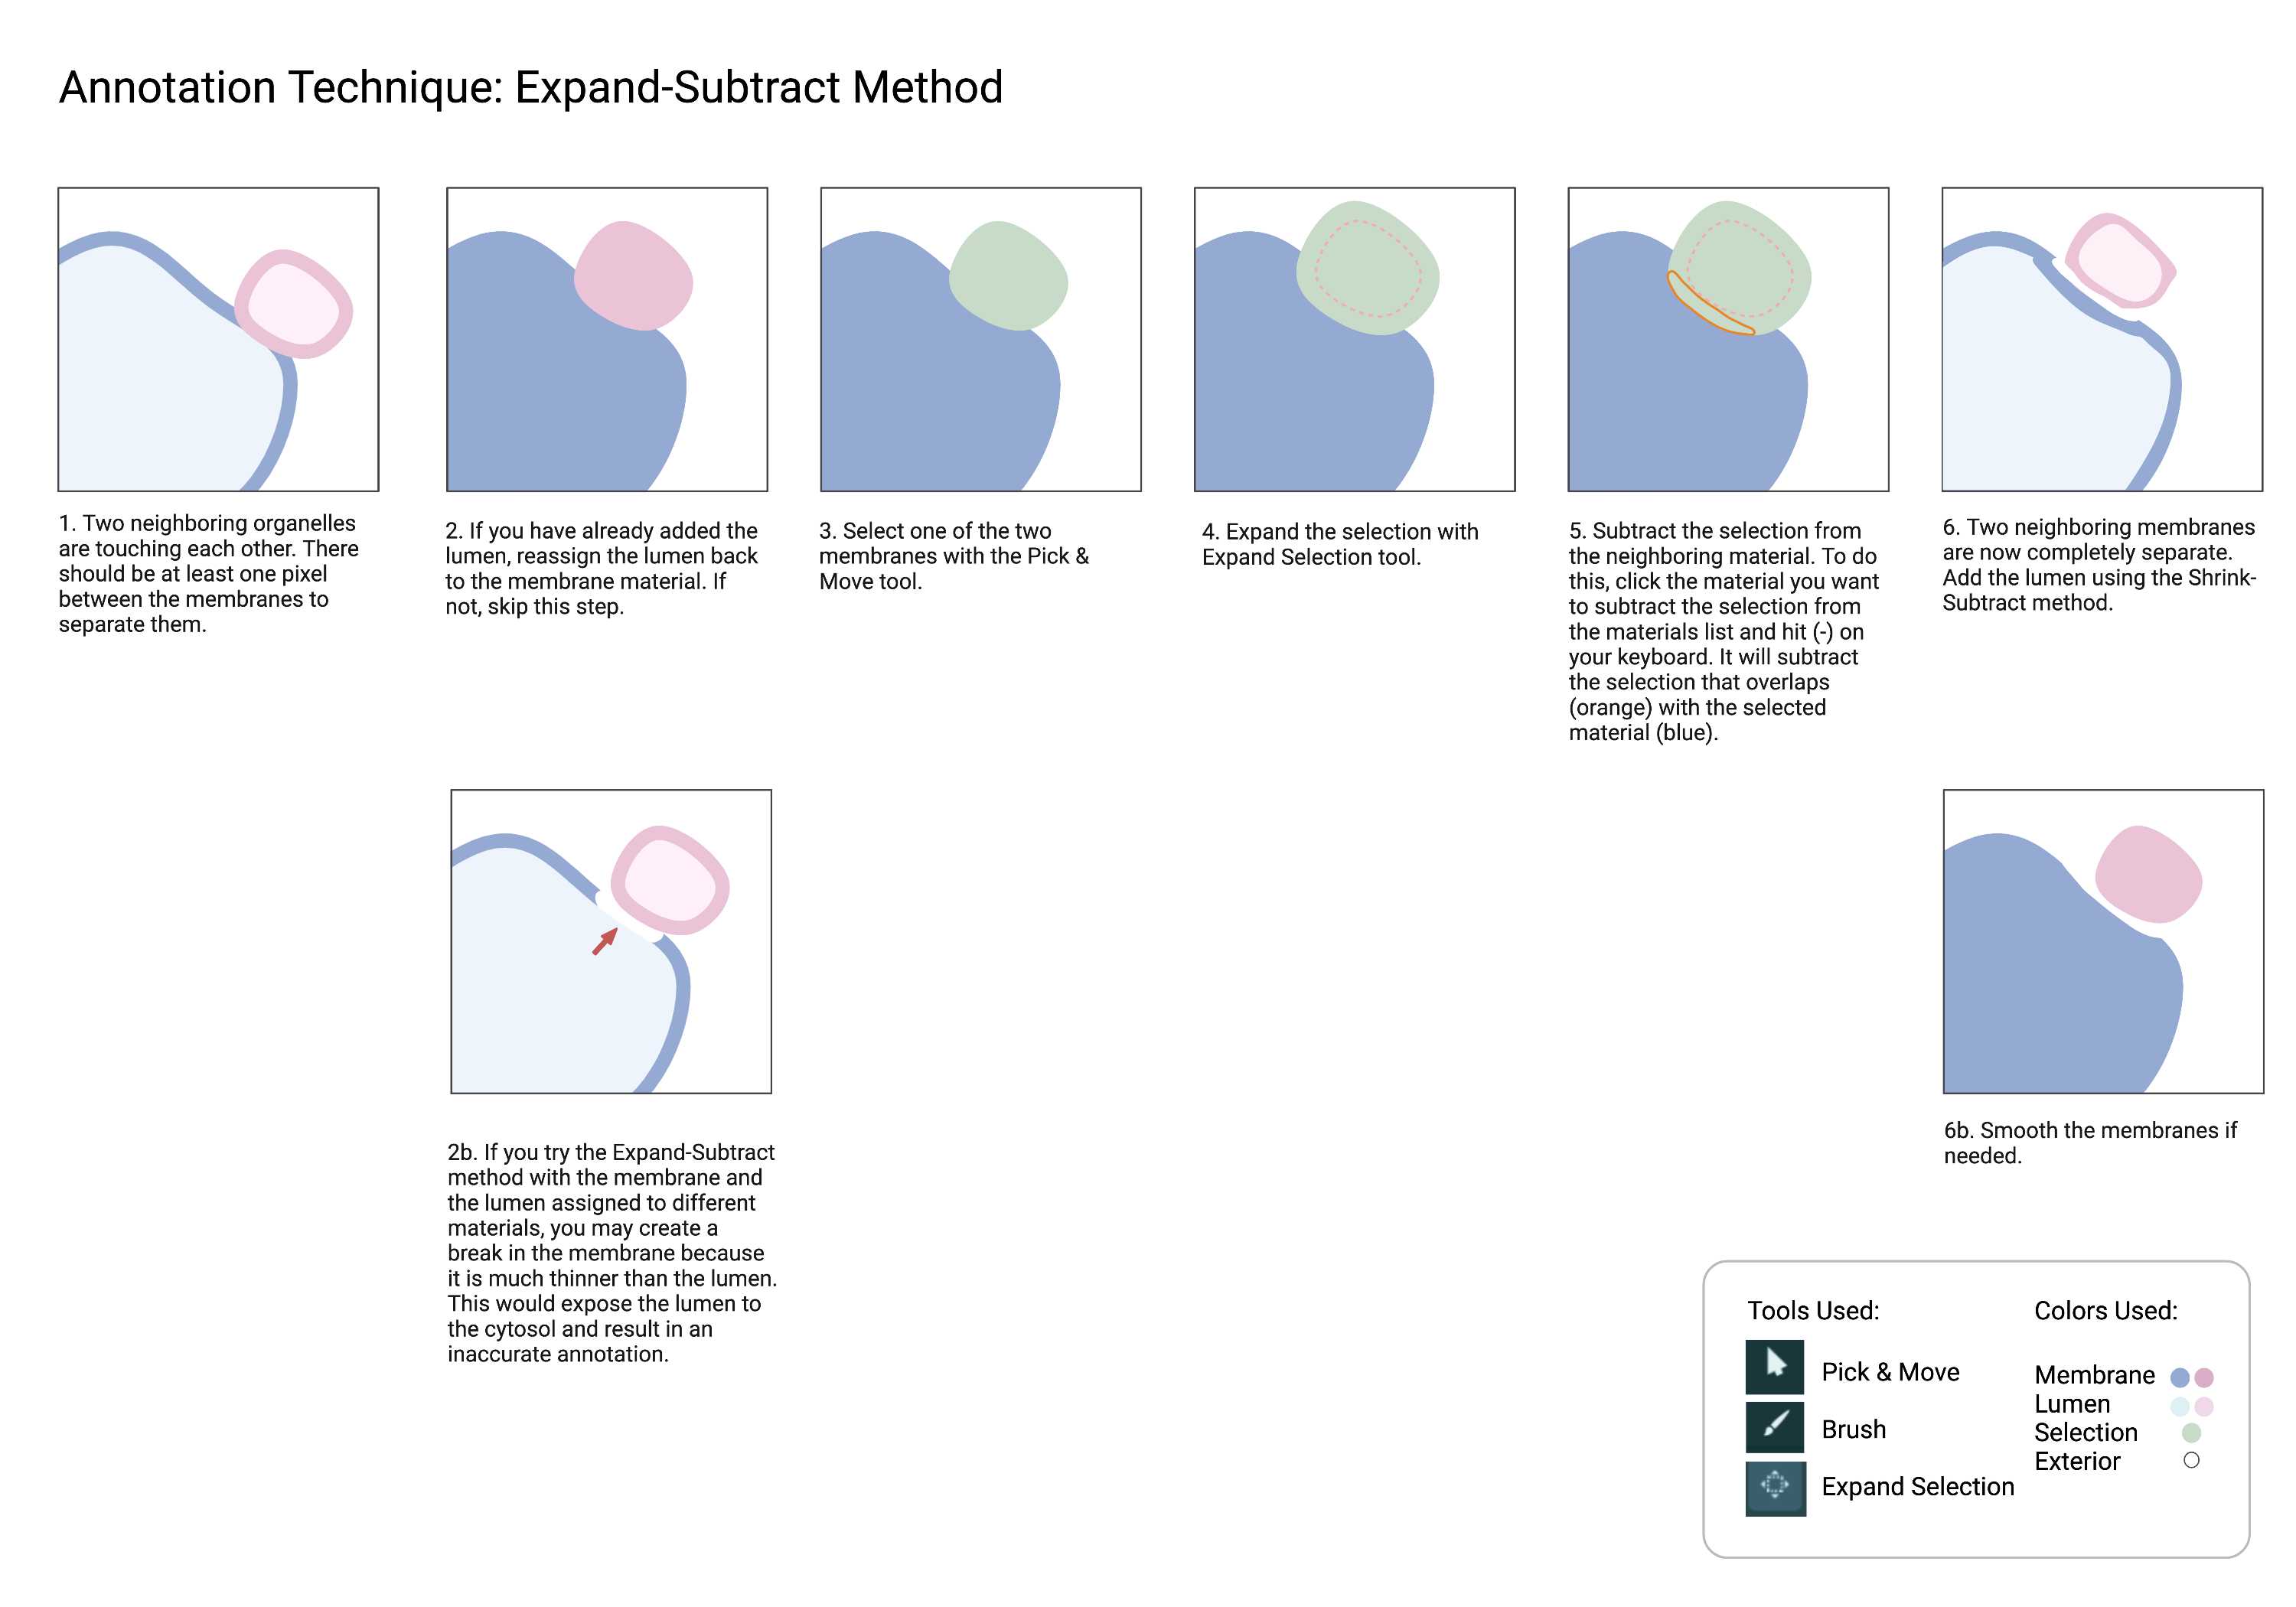
Cellmap uses various techniques with the different annotation tools found in Amira. Below are commonly used methods for faster and more efficient annotation. Please familiarize yourself with these techniques.
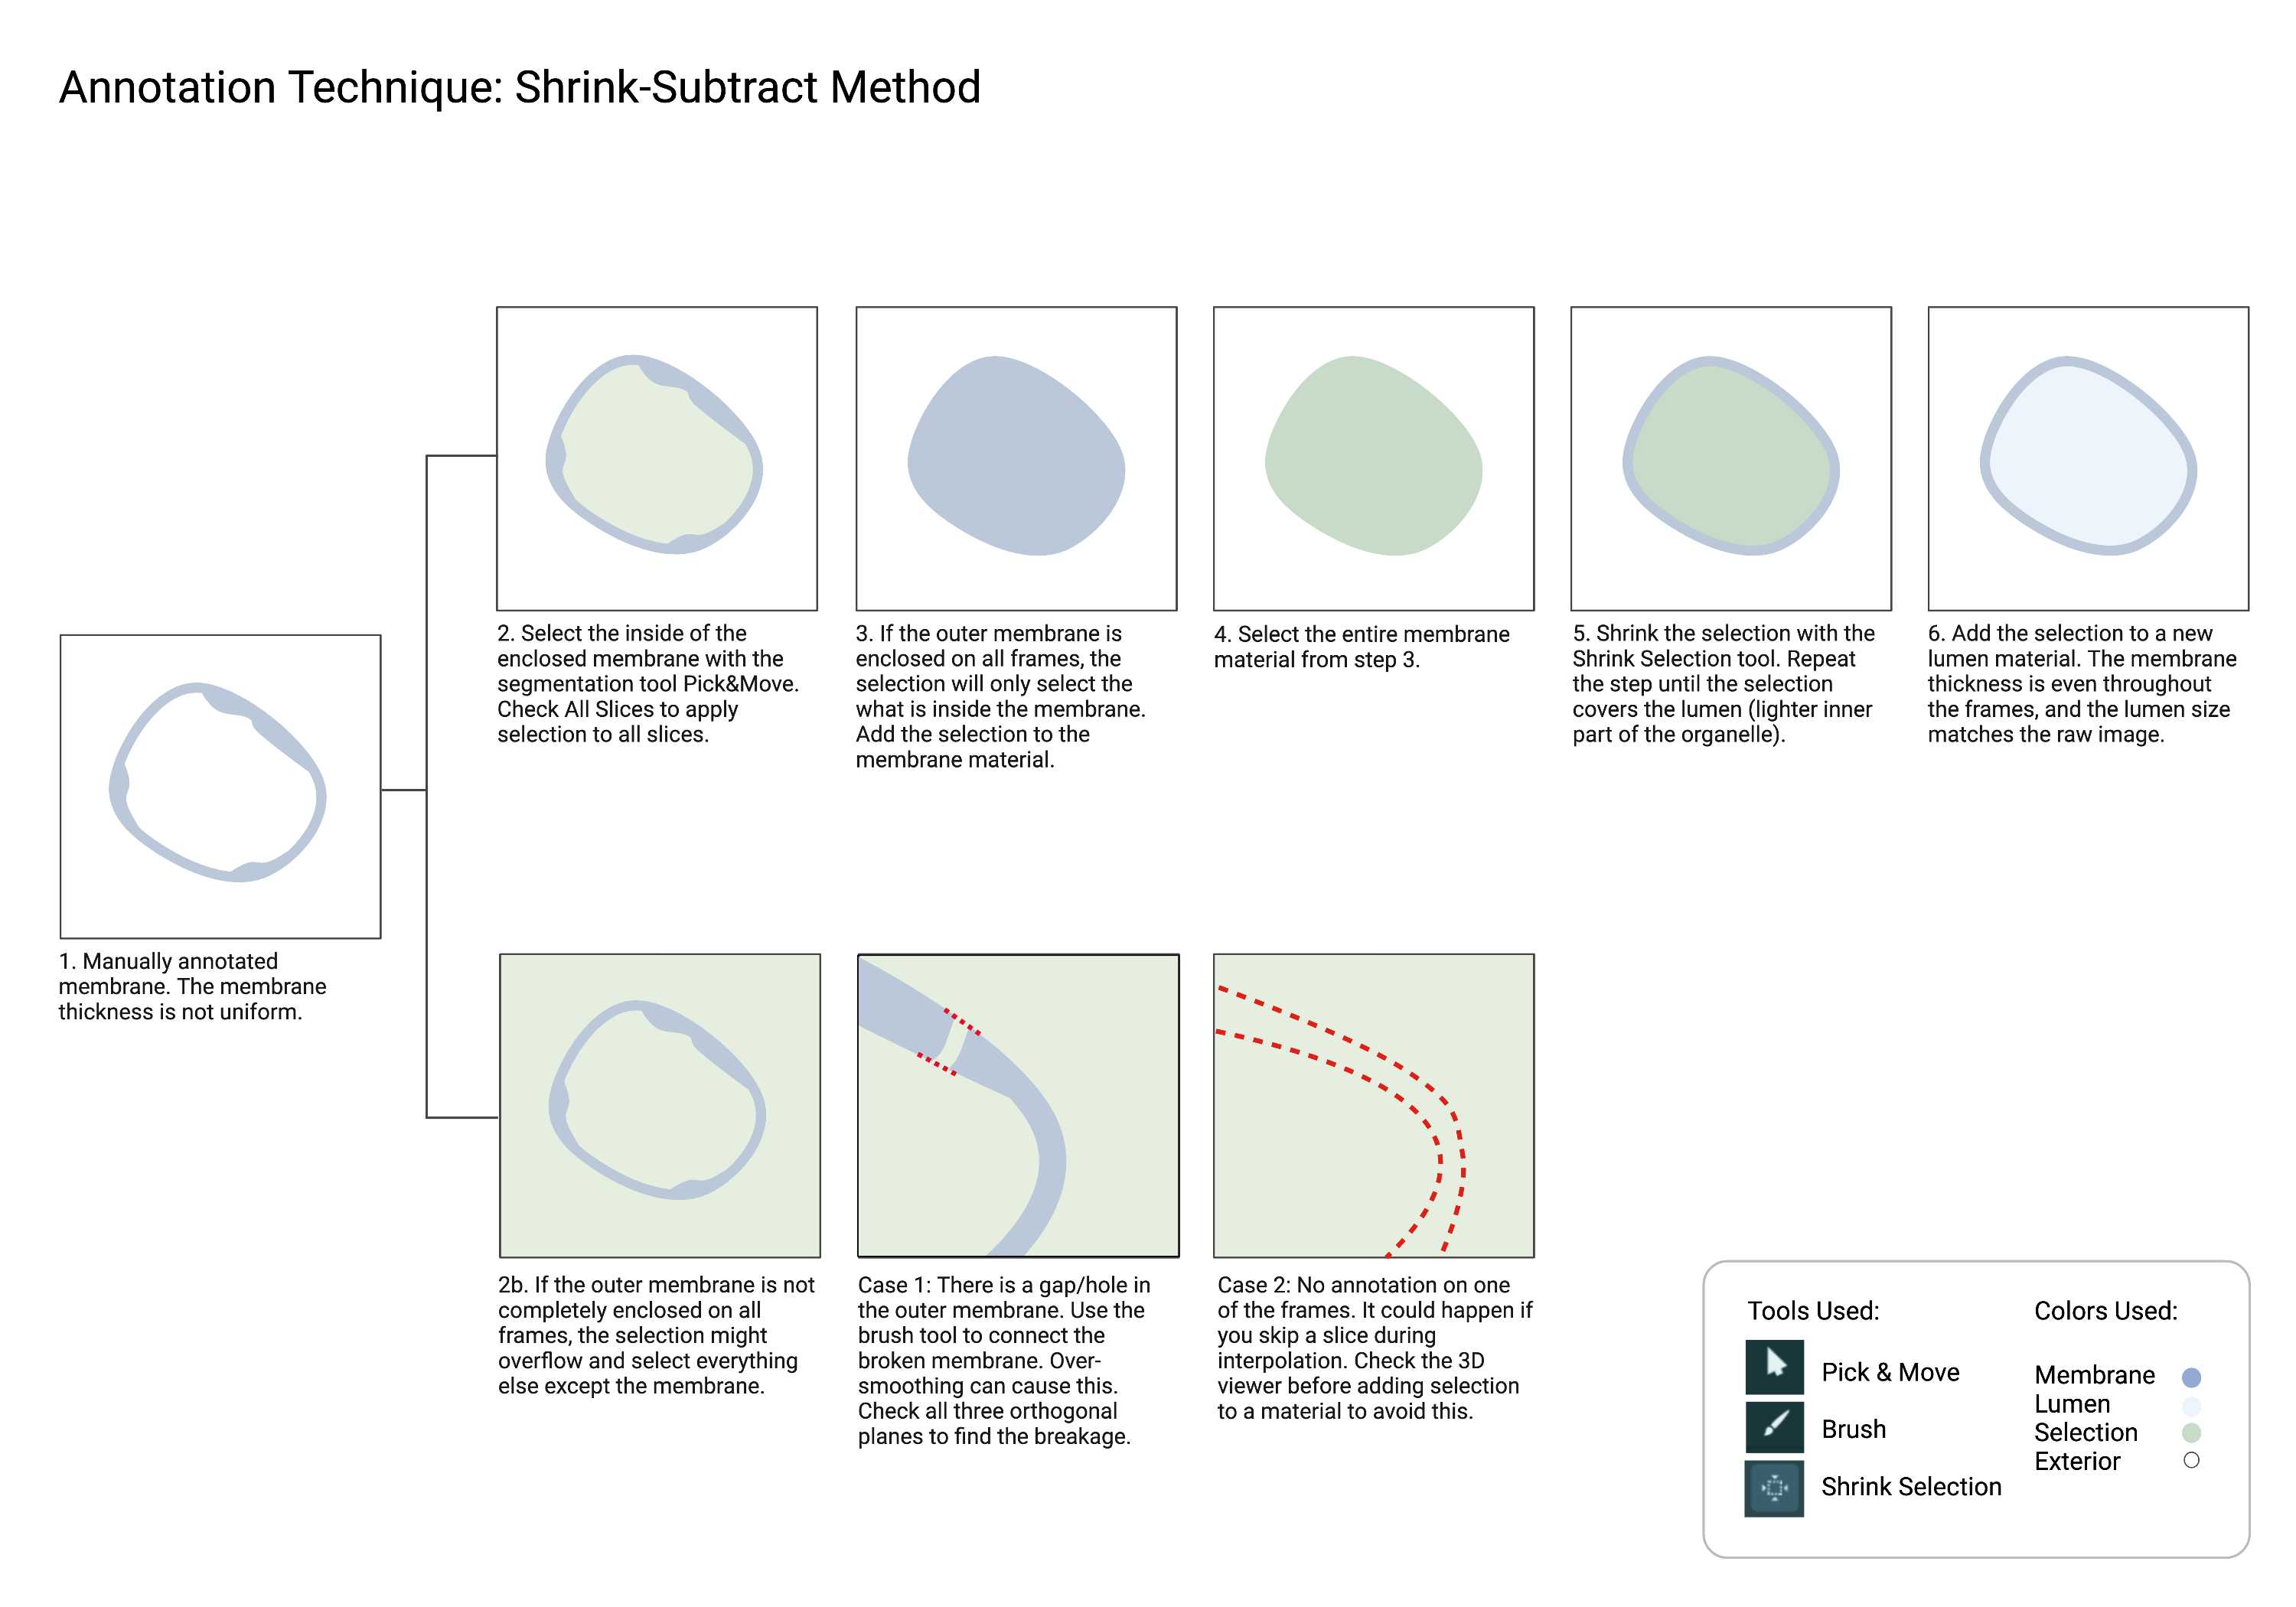
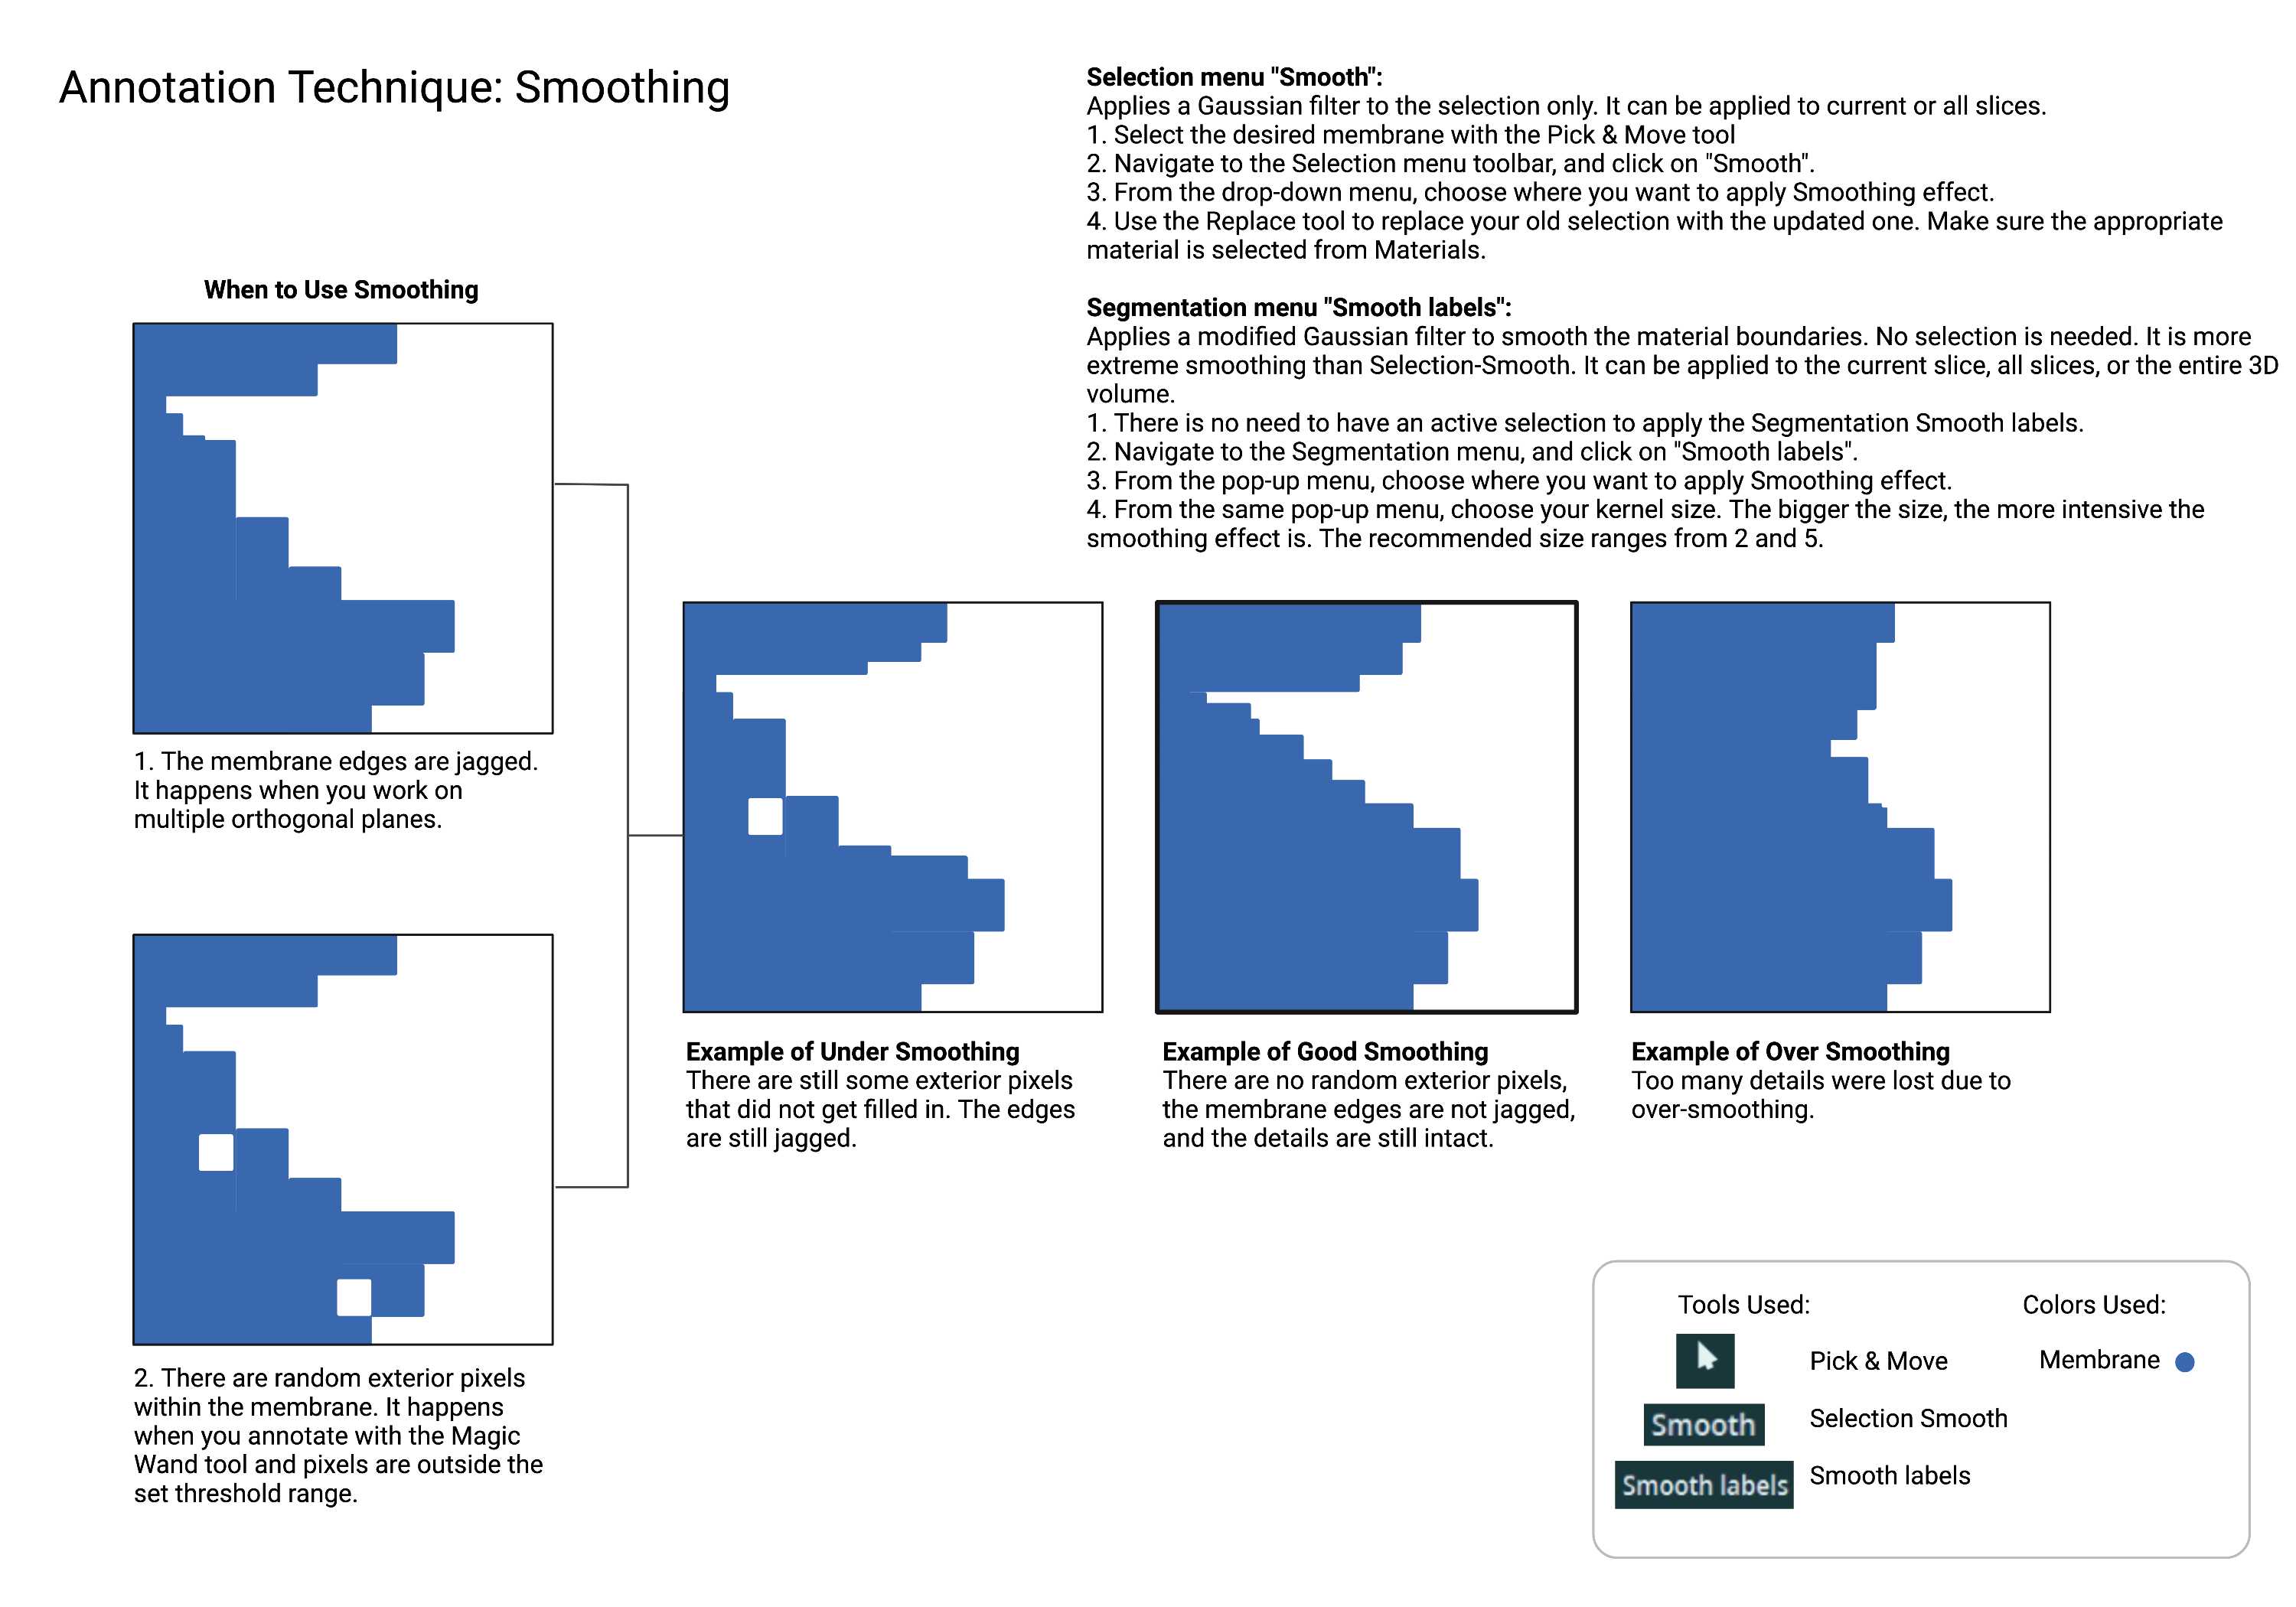
While you don't need to have an active selection to use the Segmentation smooth tool, selecting the material you are smoothing can be useful in some cases. You can easily see what's changed after smoothing. You can replace the material with the modified selection or start again.
Mitochondria
Mitochondria
Summary
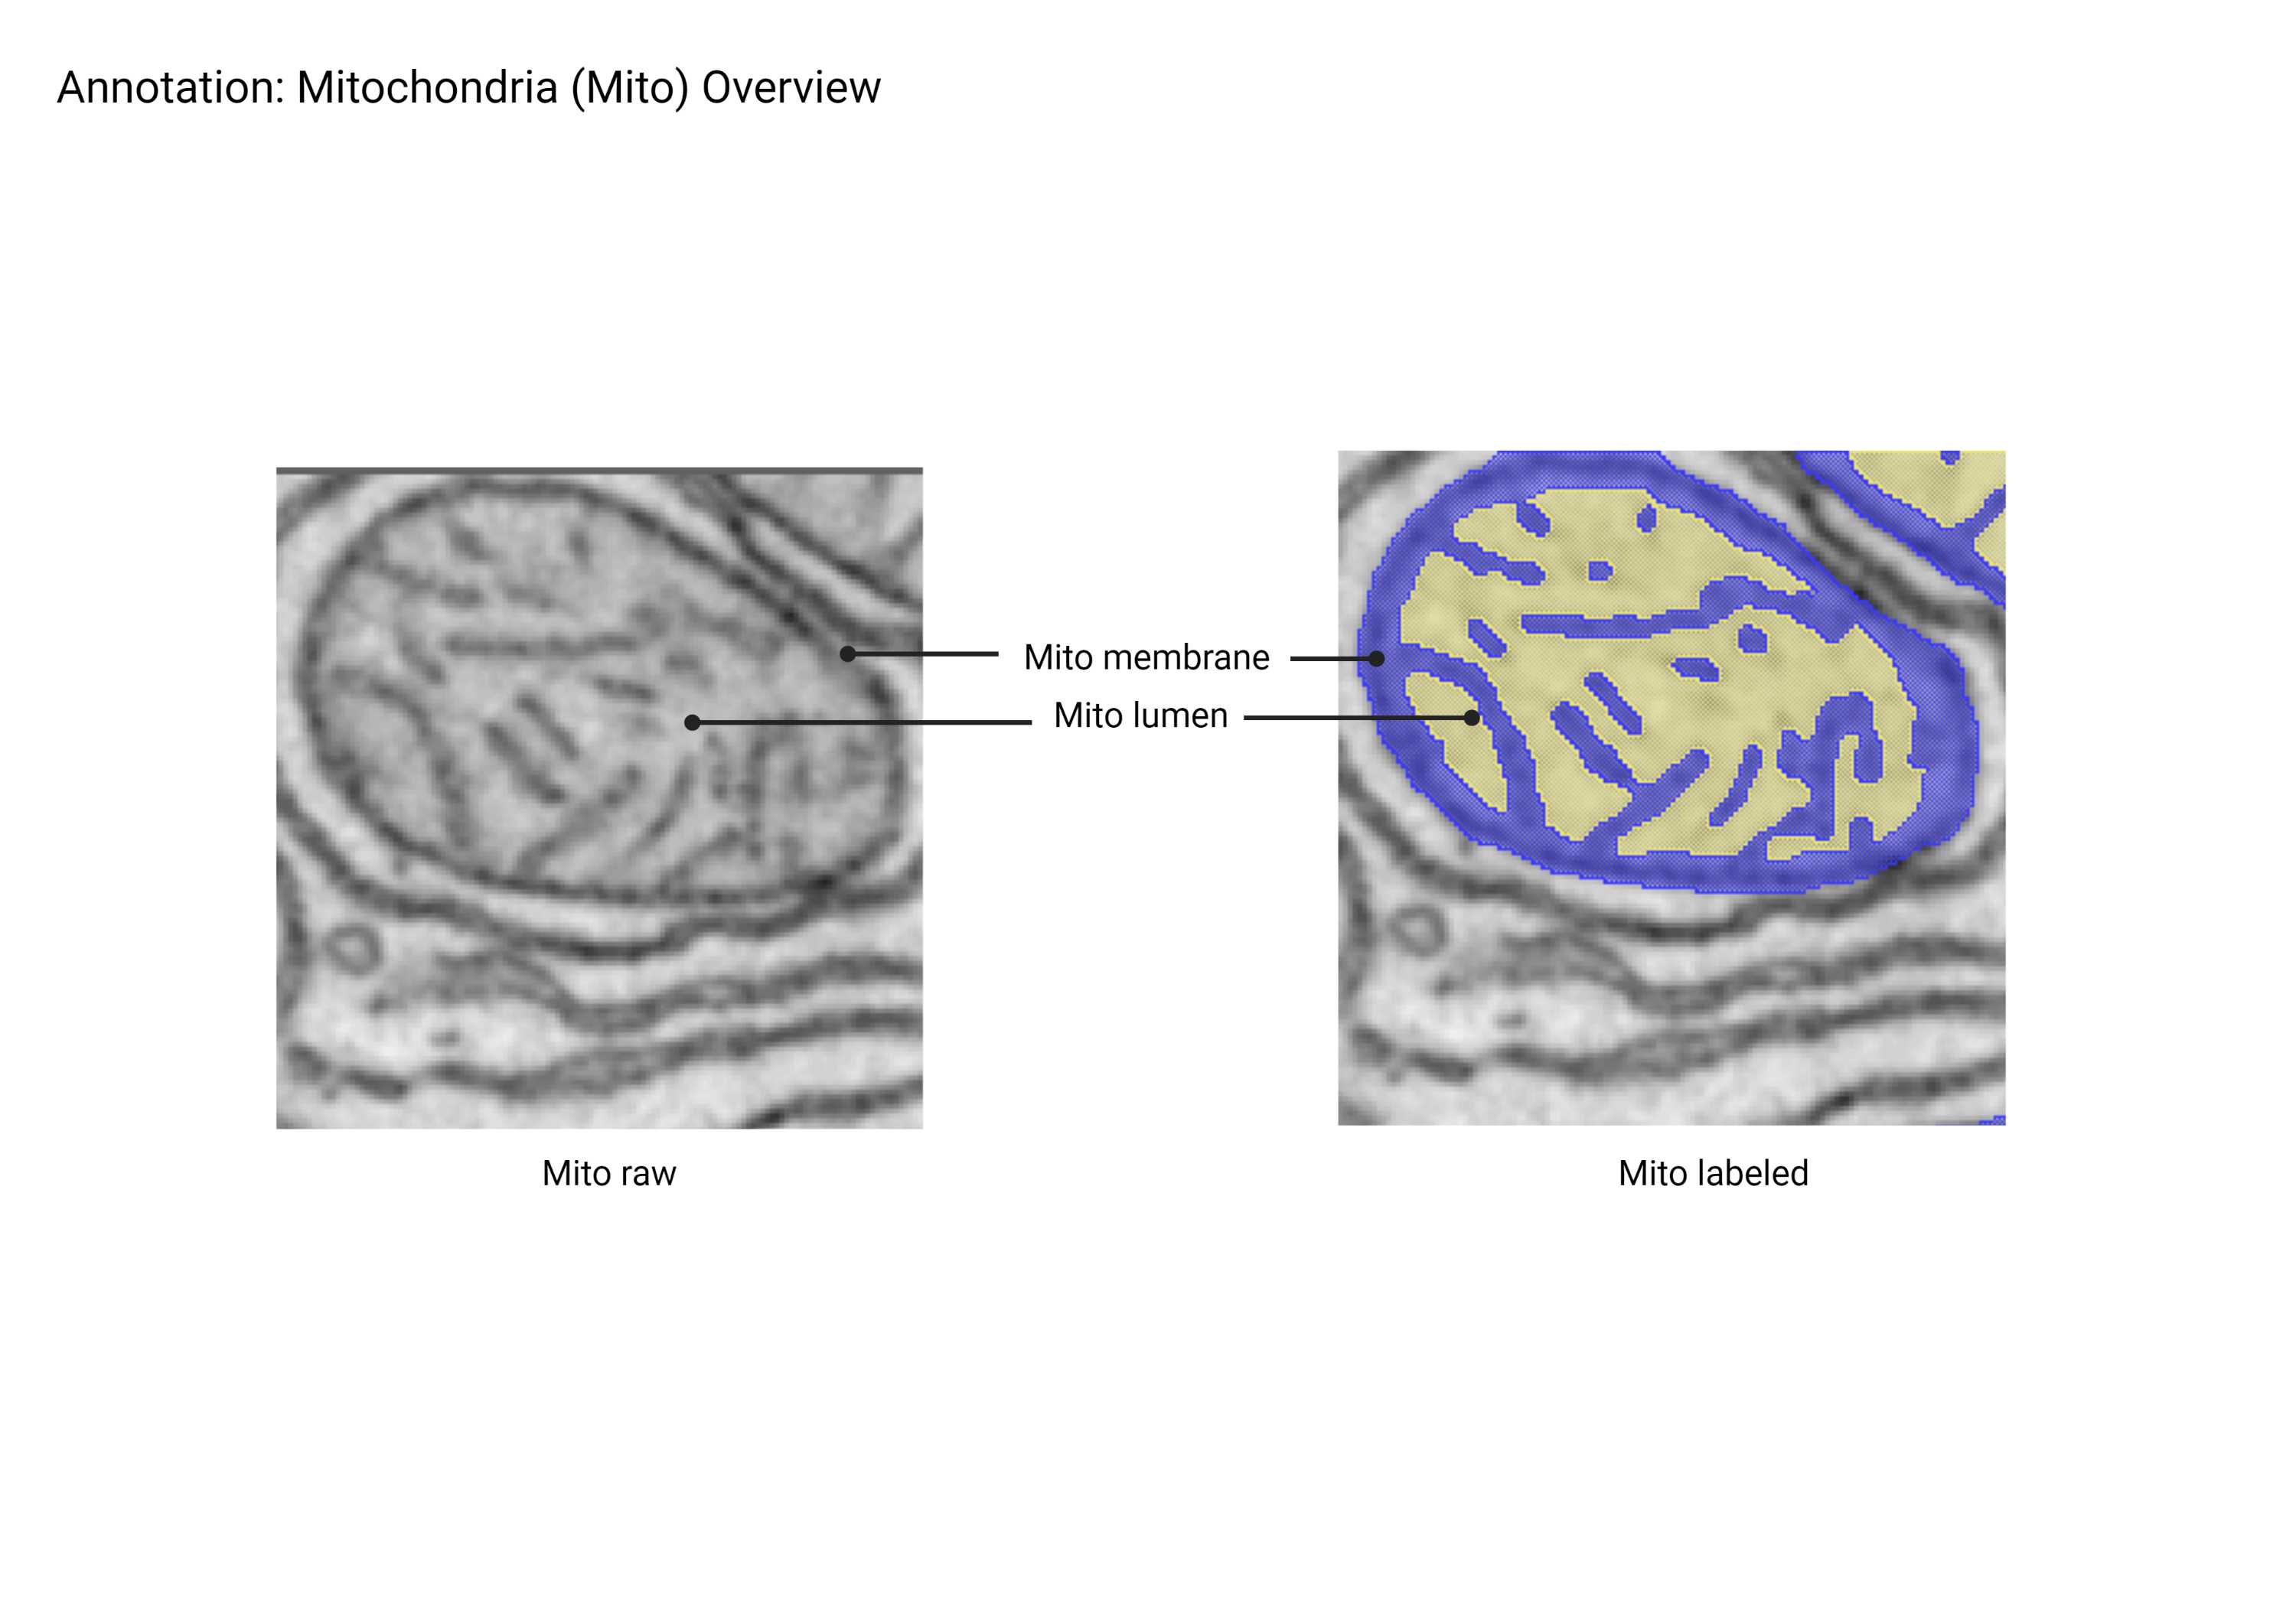
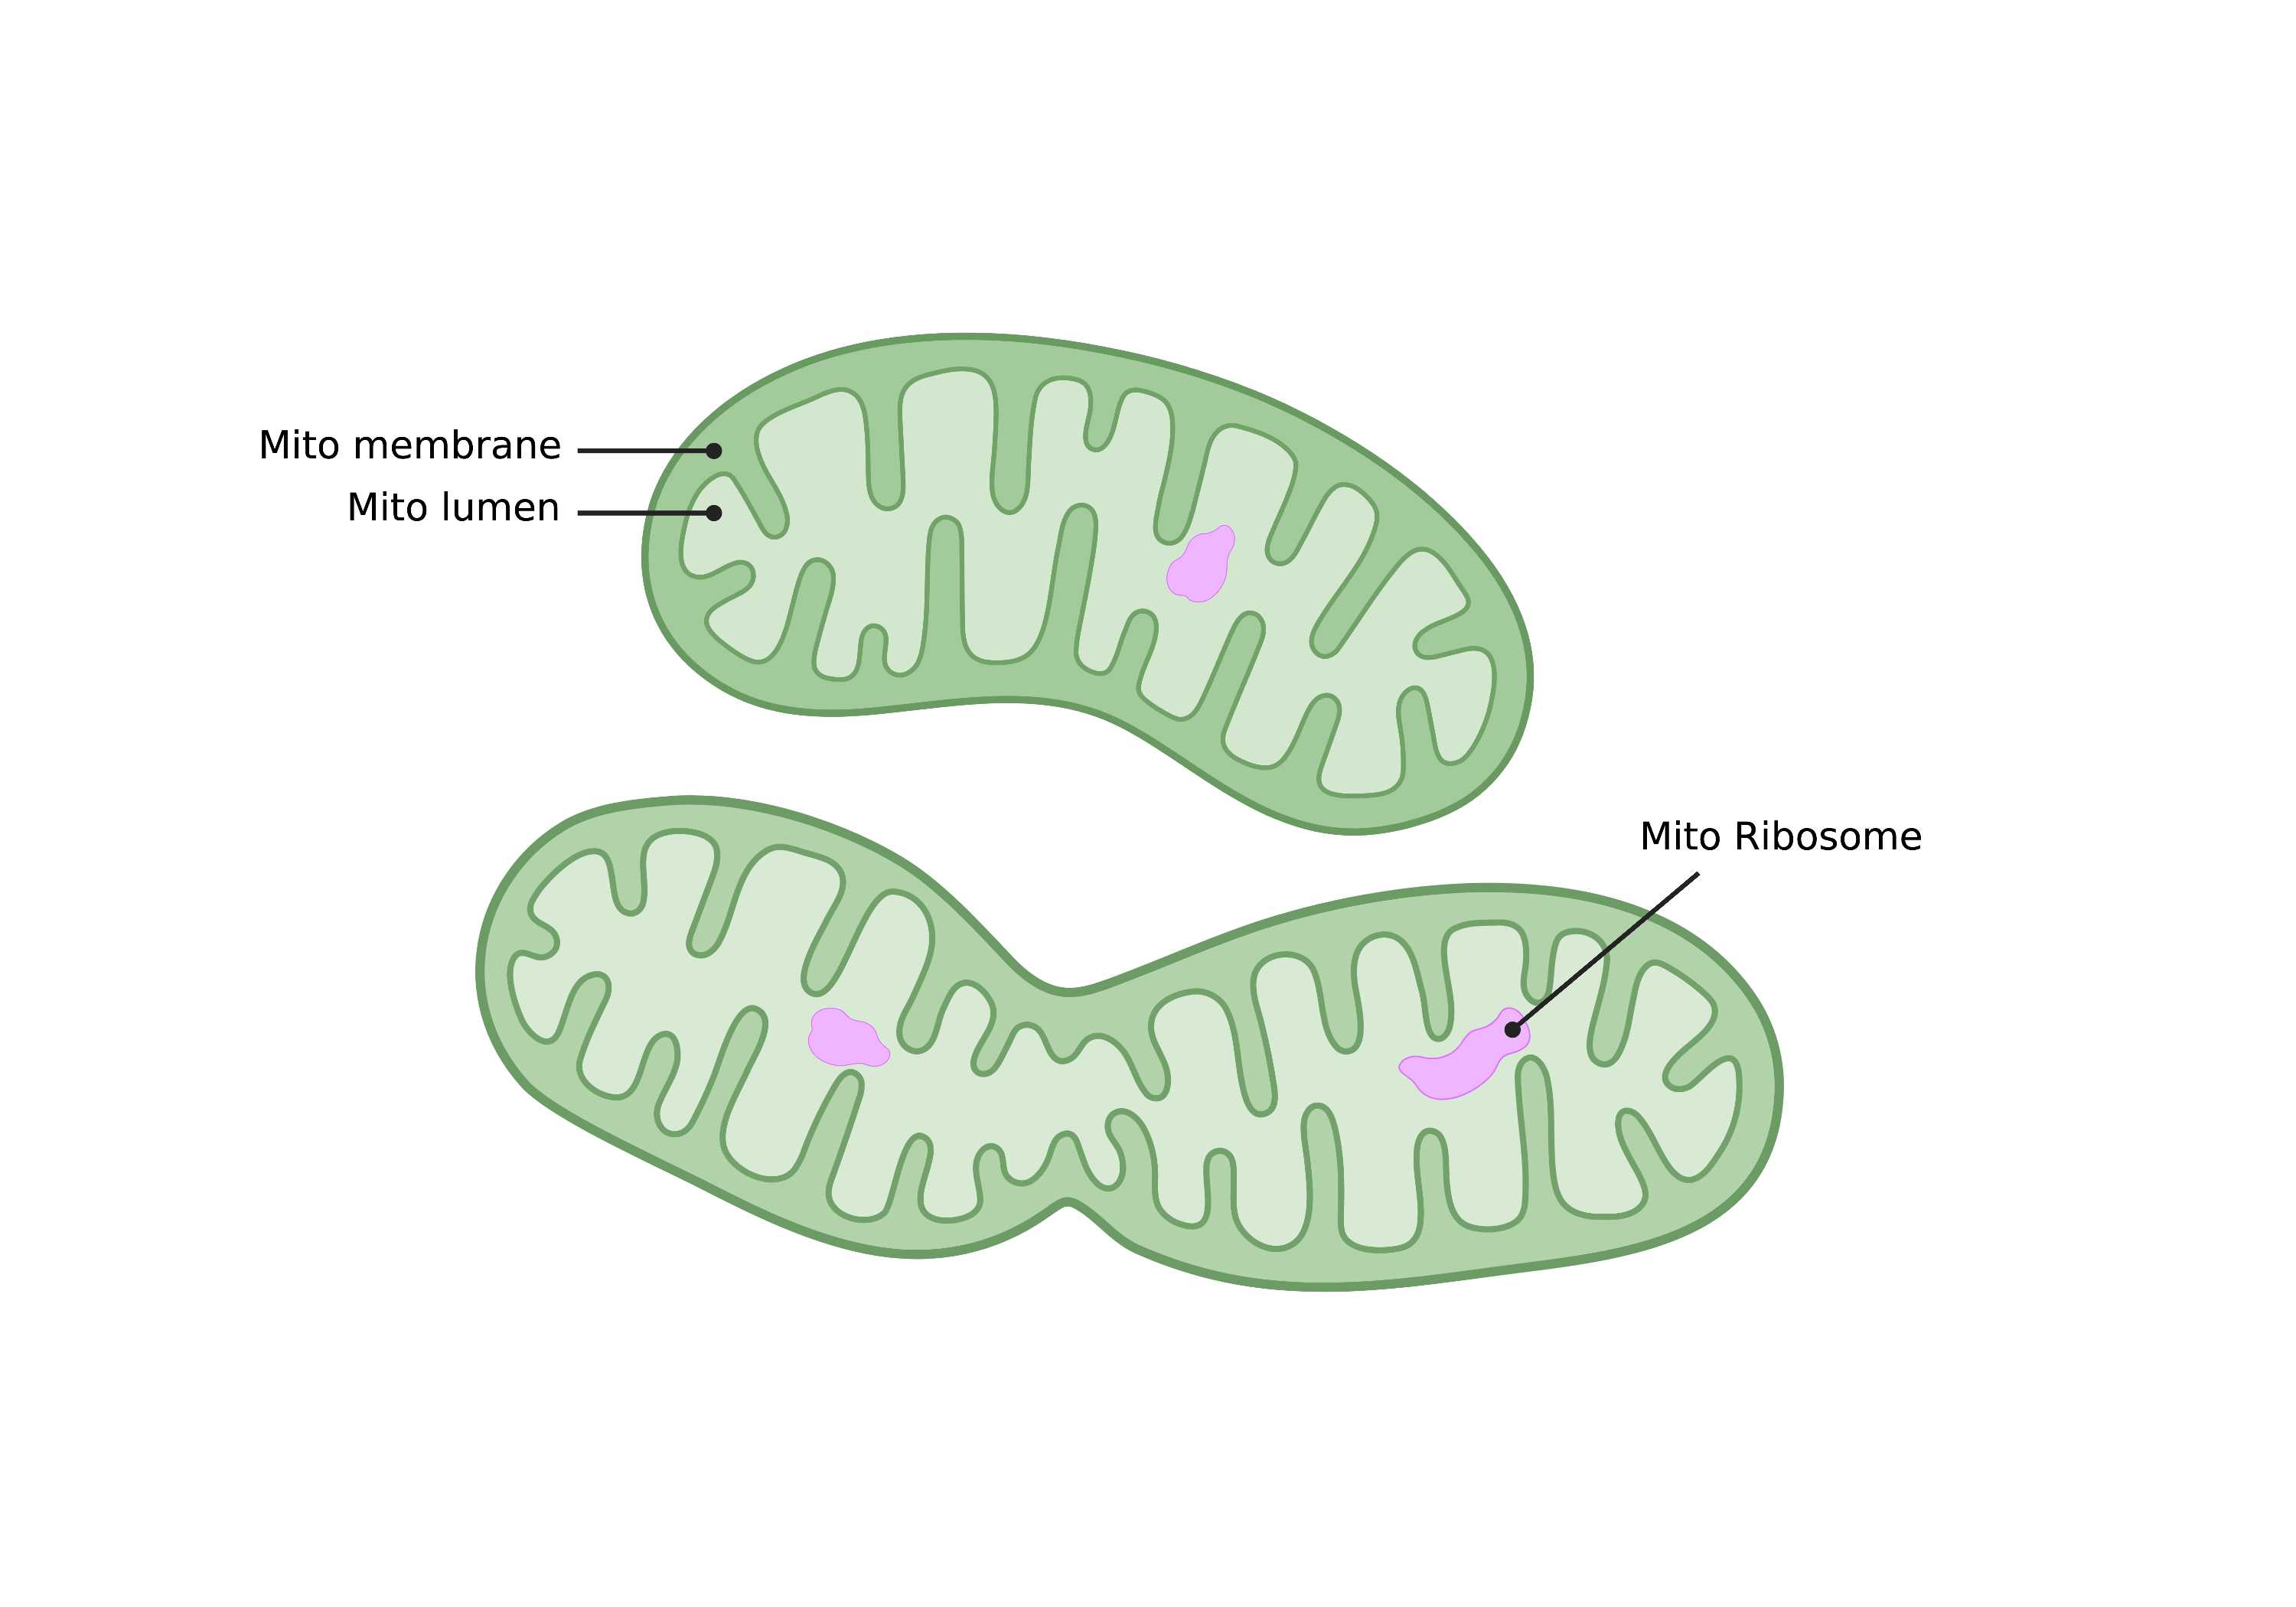
- Large, ovoid organelles characterized by outer and inner membranes that form cristae. Mitochondria can fuse and branch to form tubular networks. Inner membrane folding density varies based on cell type. Dark-staining aggregates within mitochondria lumen have been identified and labeled as mitochondrial ribosomes.
Description
- Ovoid, branching organelles.
- Contains inner and outer membrane (cristae).
Recommended Annotation Steps
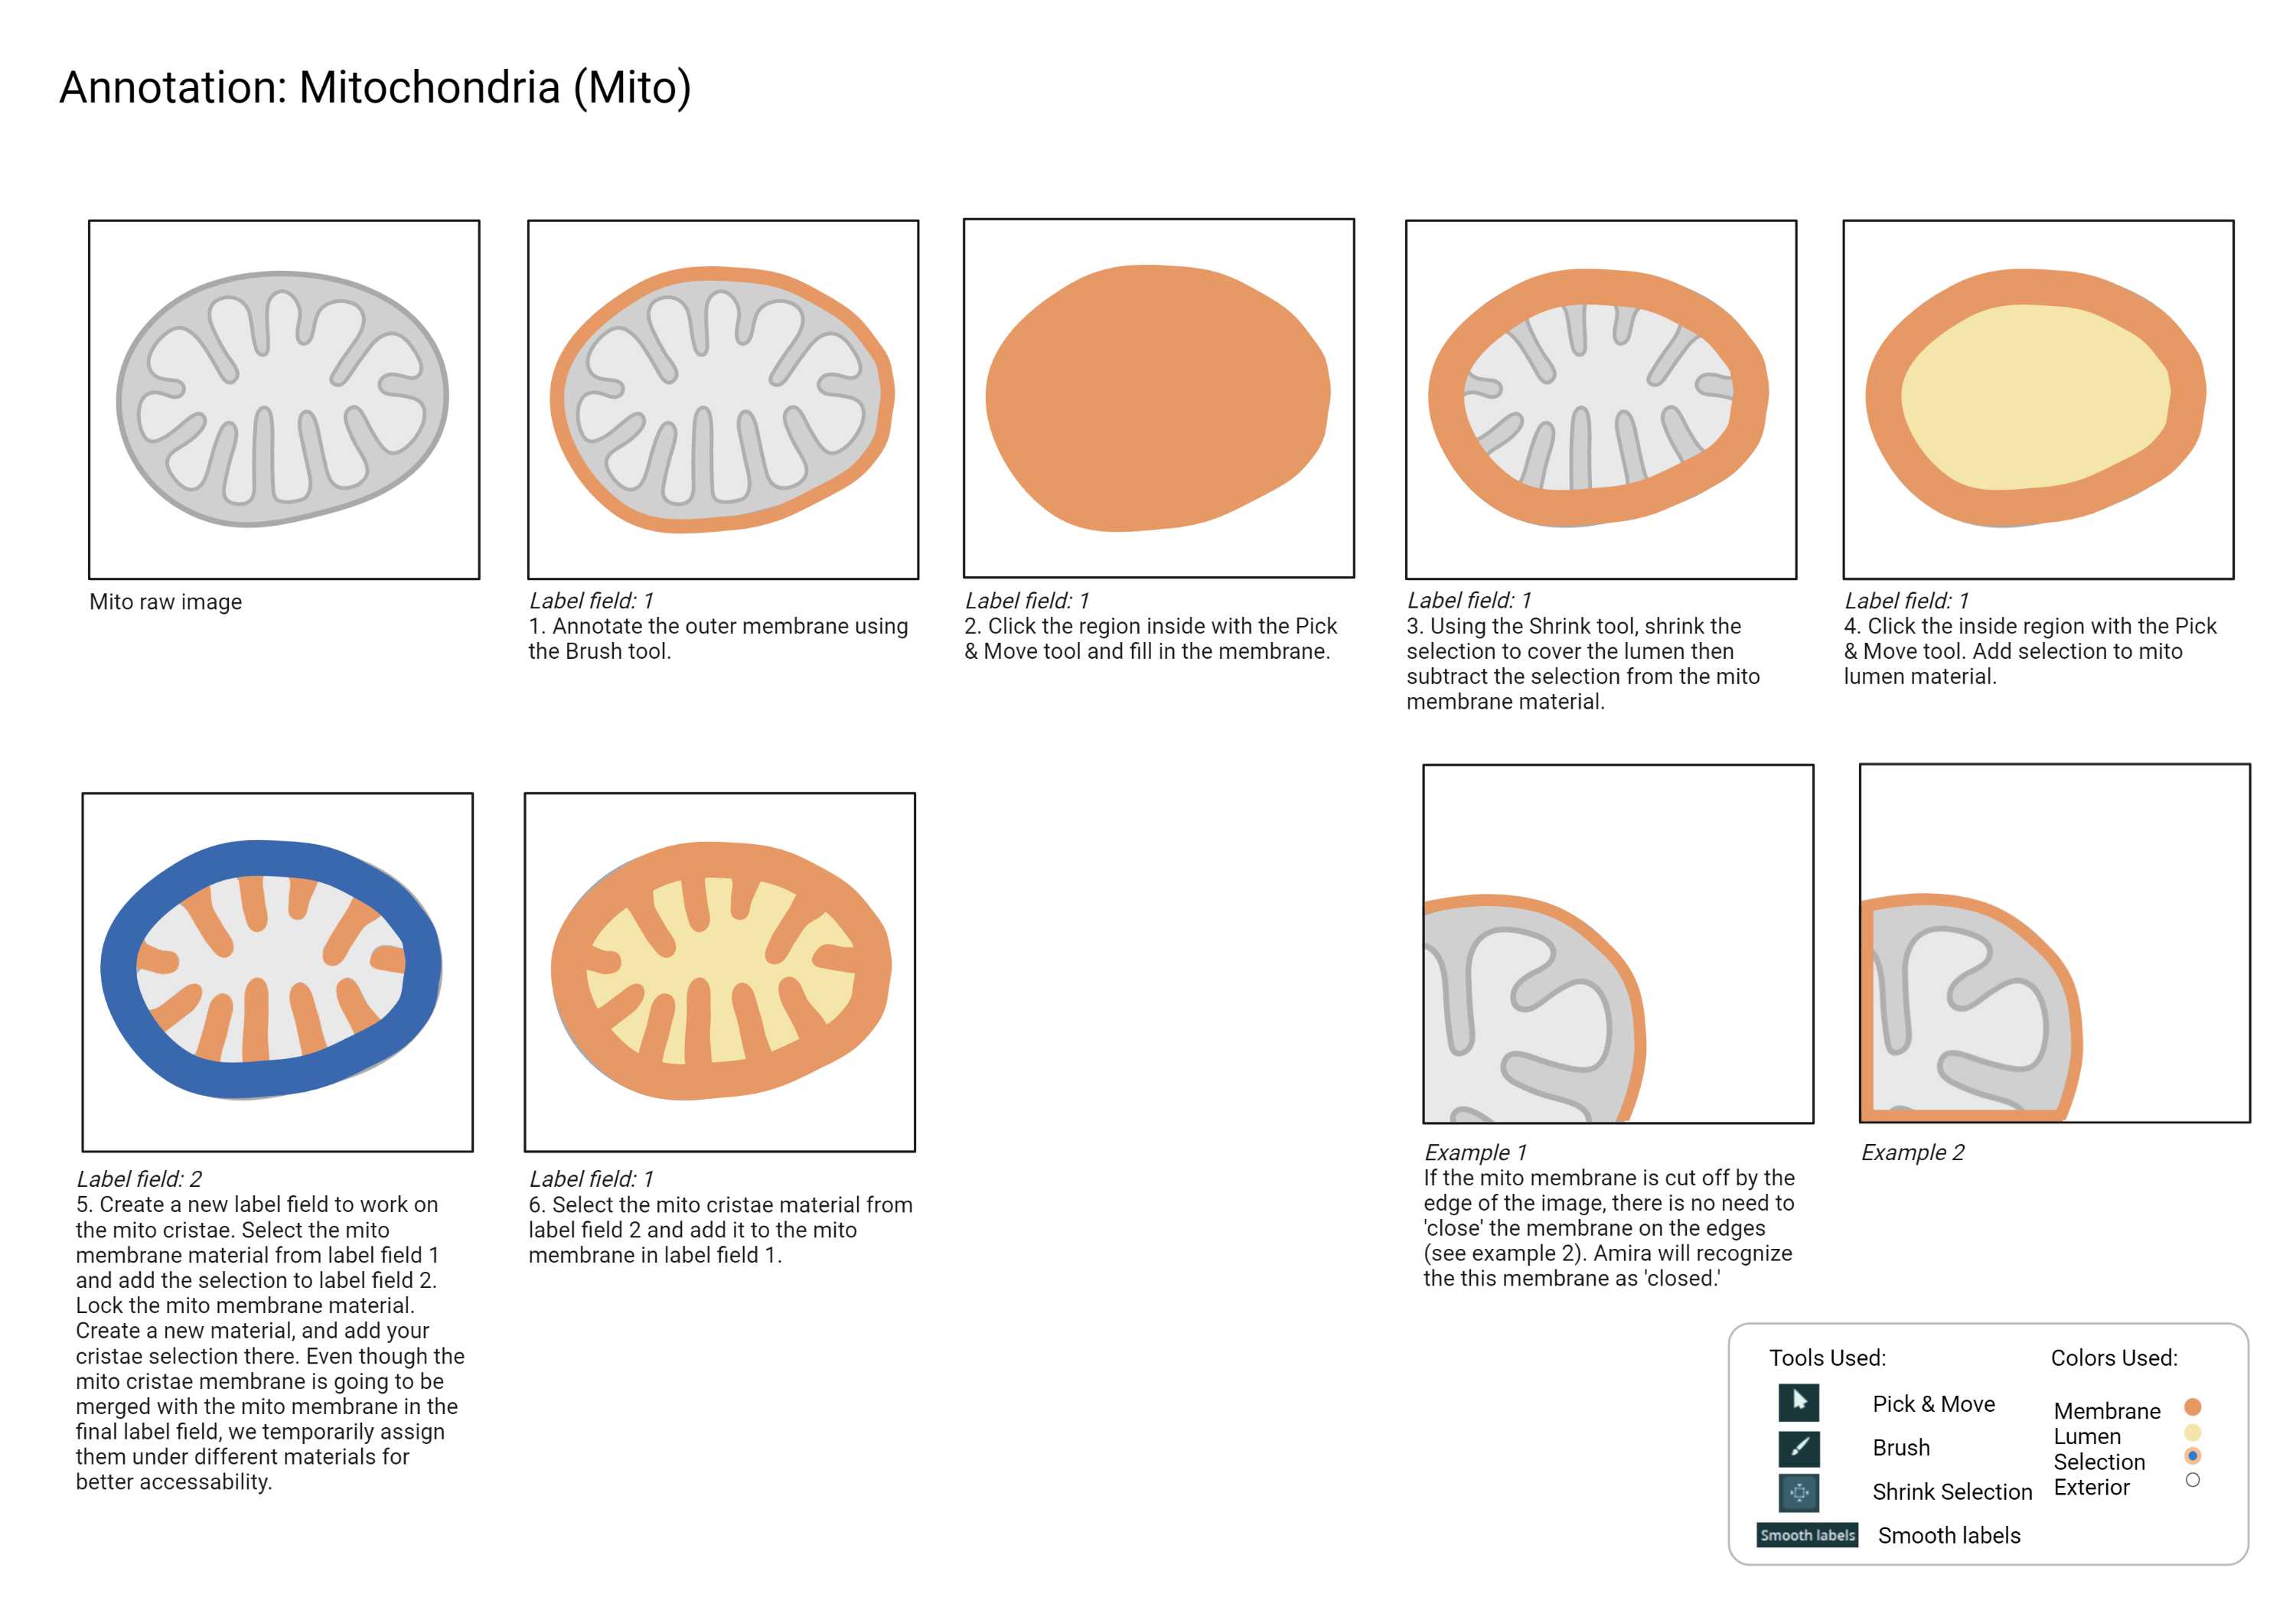
- Since mitochondria are one of the most abundant intracellular organelles, it is recommended to annotate them before any other classes to avoid unwanted overlap with other classes.
Checklist
- Each cristae strand is separated.
- All cristae connect back to the Mito outer membrane.
- Mito membrane is annotated from the first frame to the last, including the membrane shadow.
Endoplasmic Reticulum
ER
Summary
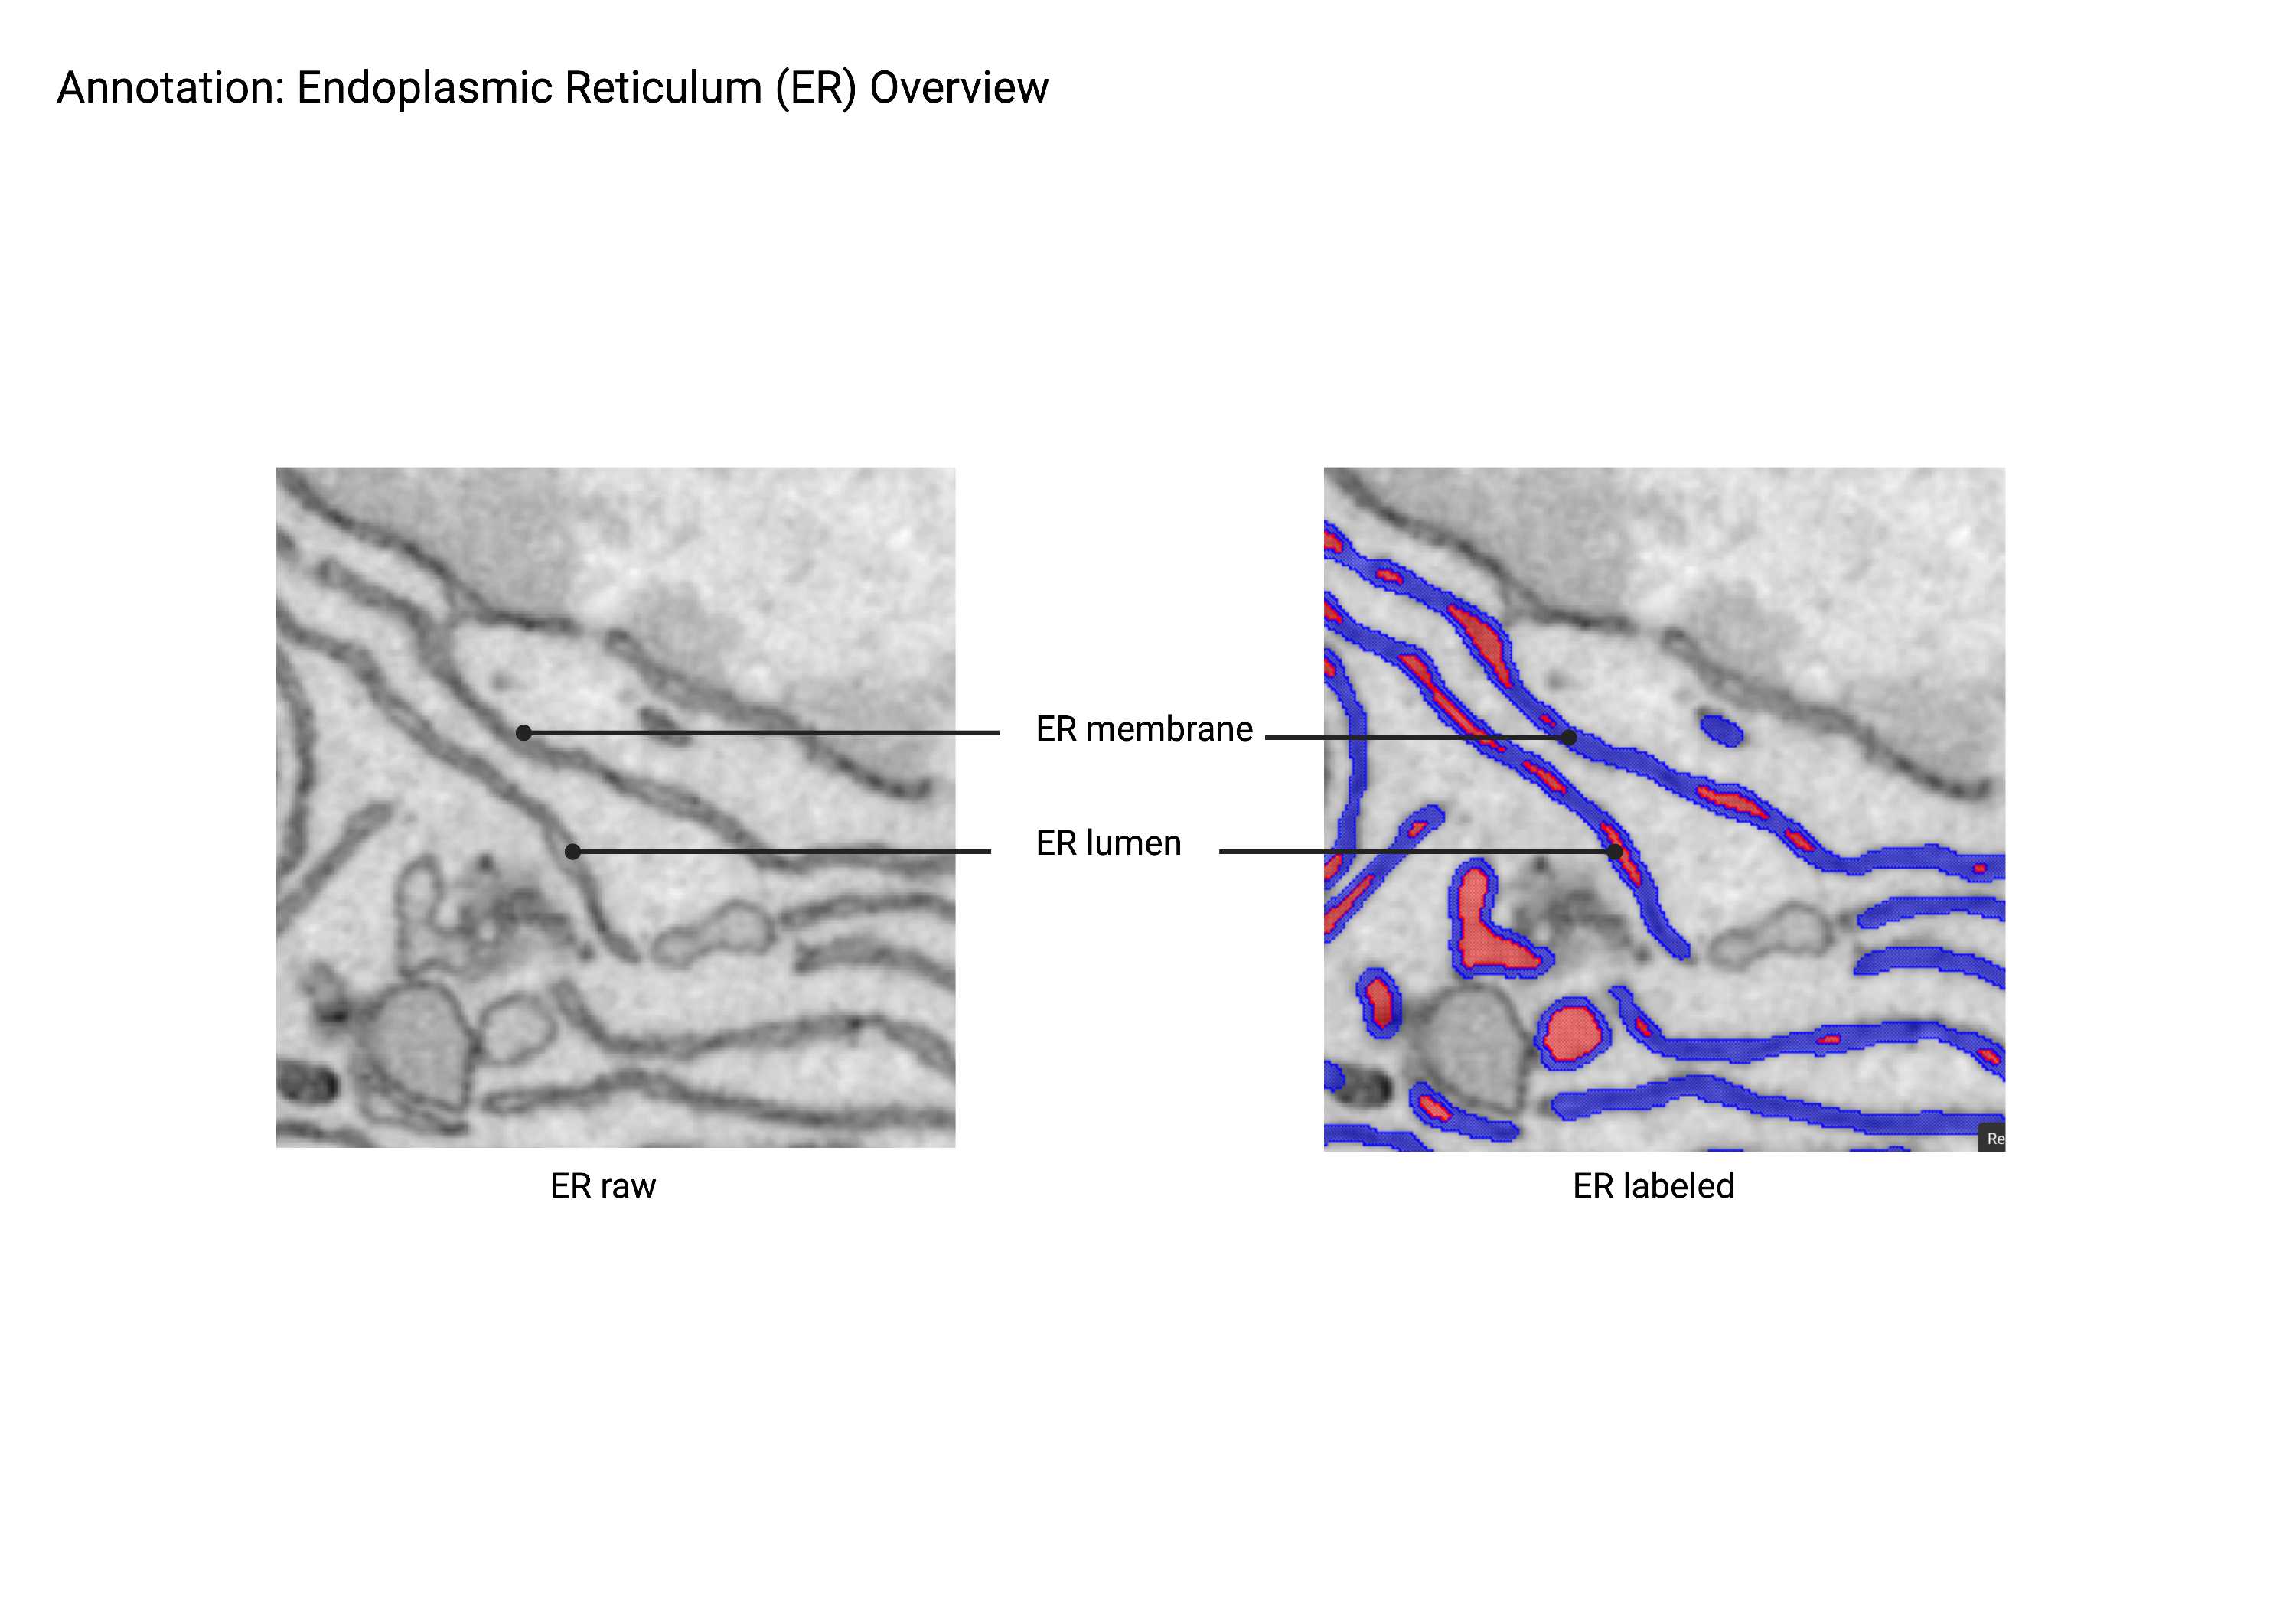
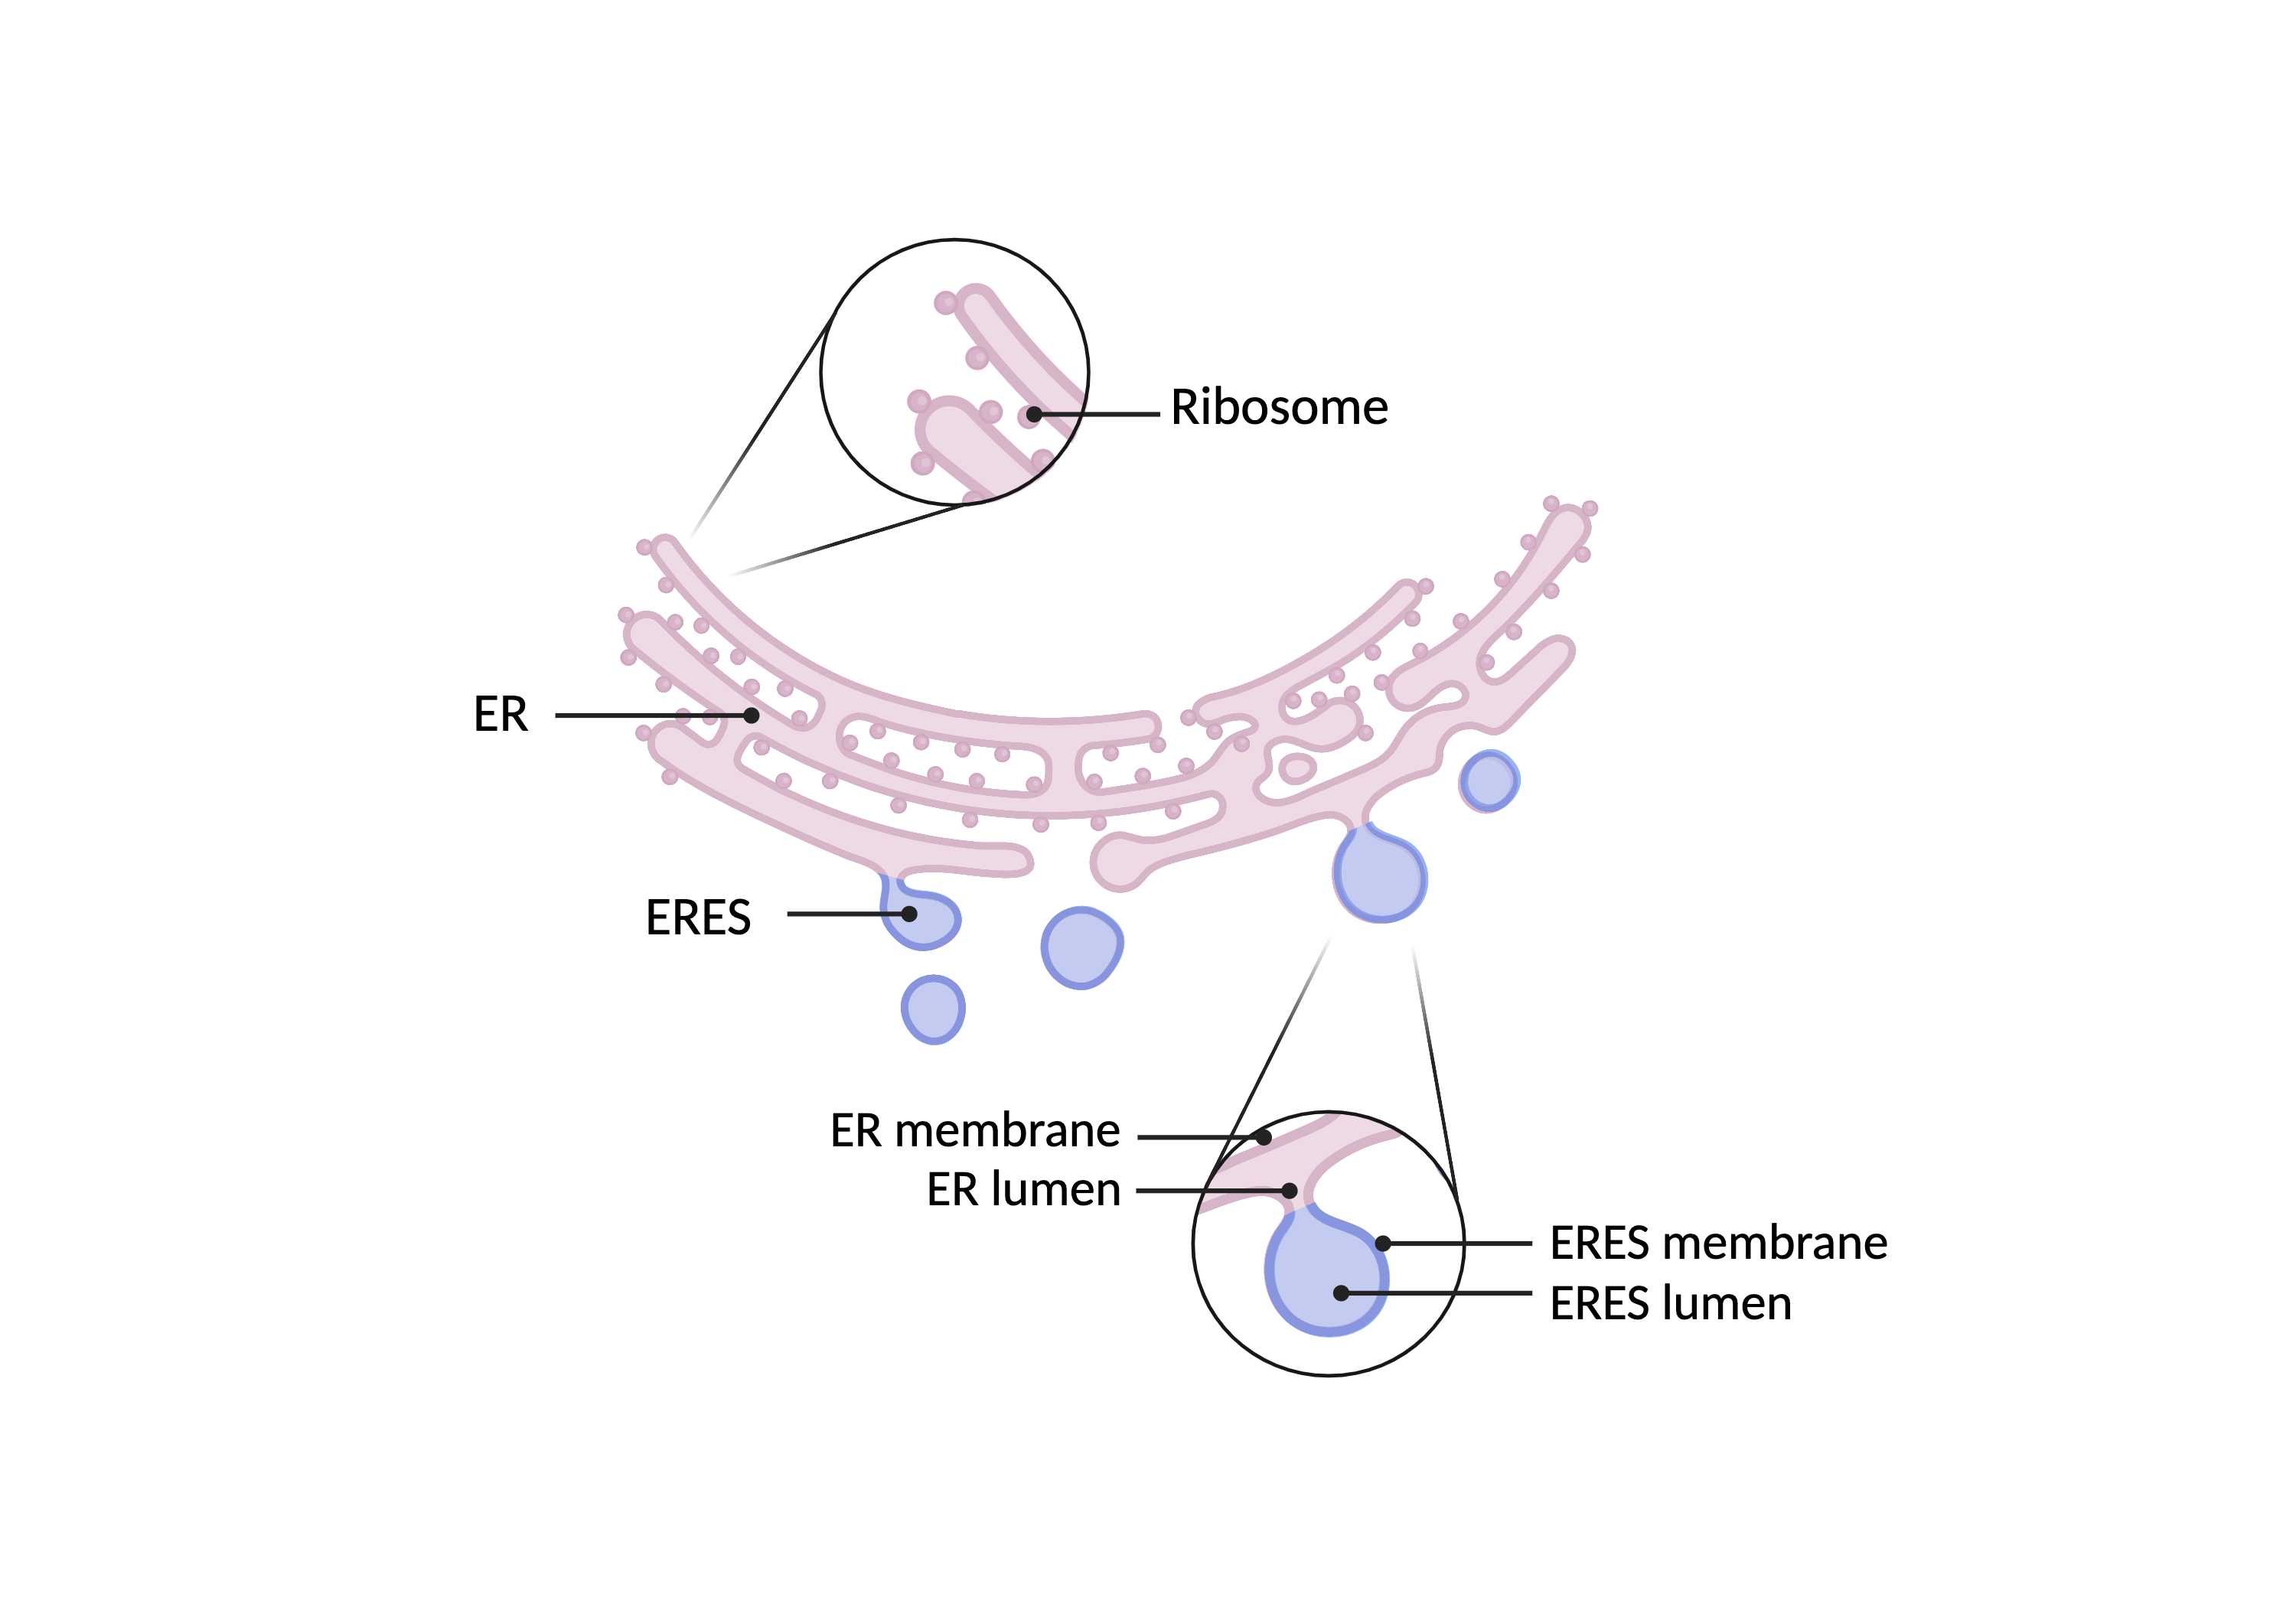
- An extensive network of tubular structures often studded with ribosomes. The endoplasmic reticulum is distinct from multi-vesicular bodies (MVBs) based on connectivity; ER tubules always connect back to themselves and ultimately connect back to the nuclear envelope. In contrast, the morphologically similar multivesicular bodies are disconnected. ER exit sites (ERES), the nuclear envelope (NE), and associated nuclear pores (NP) are included in the ER superclass.
Description
- Always connects back to itself, which then connects back to the NE.
- If it’s disconnected, then it’s a MVB.
- Can be studded with ribosomes. Ribosomes may not always be visible depending on the staining protocols used.
ERES
Summary
- A cluster of tubular structures and vesicles that bud from the endoplasmic reticulum. ERES lumen and morphology is generally consistent with the corresponding ER network.
Description
- Connected to ER.
- Clustered group of tubules/vesicles.
Recommended Annotation Steps
-
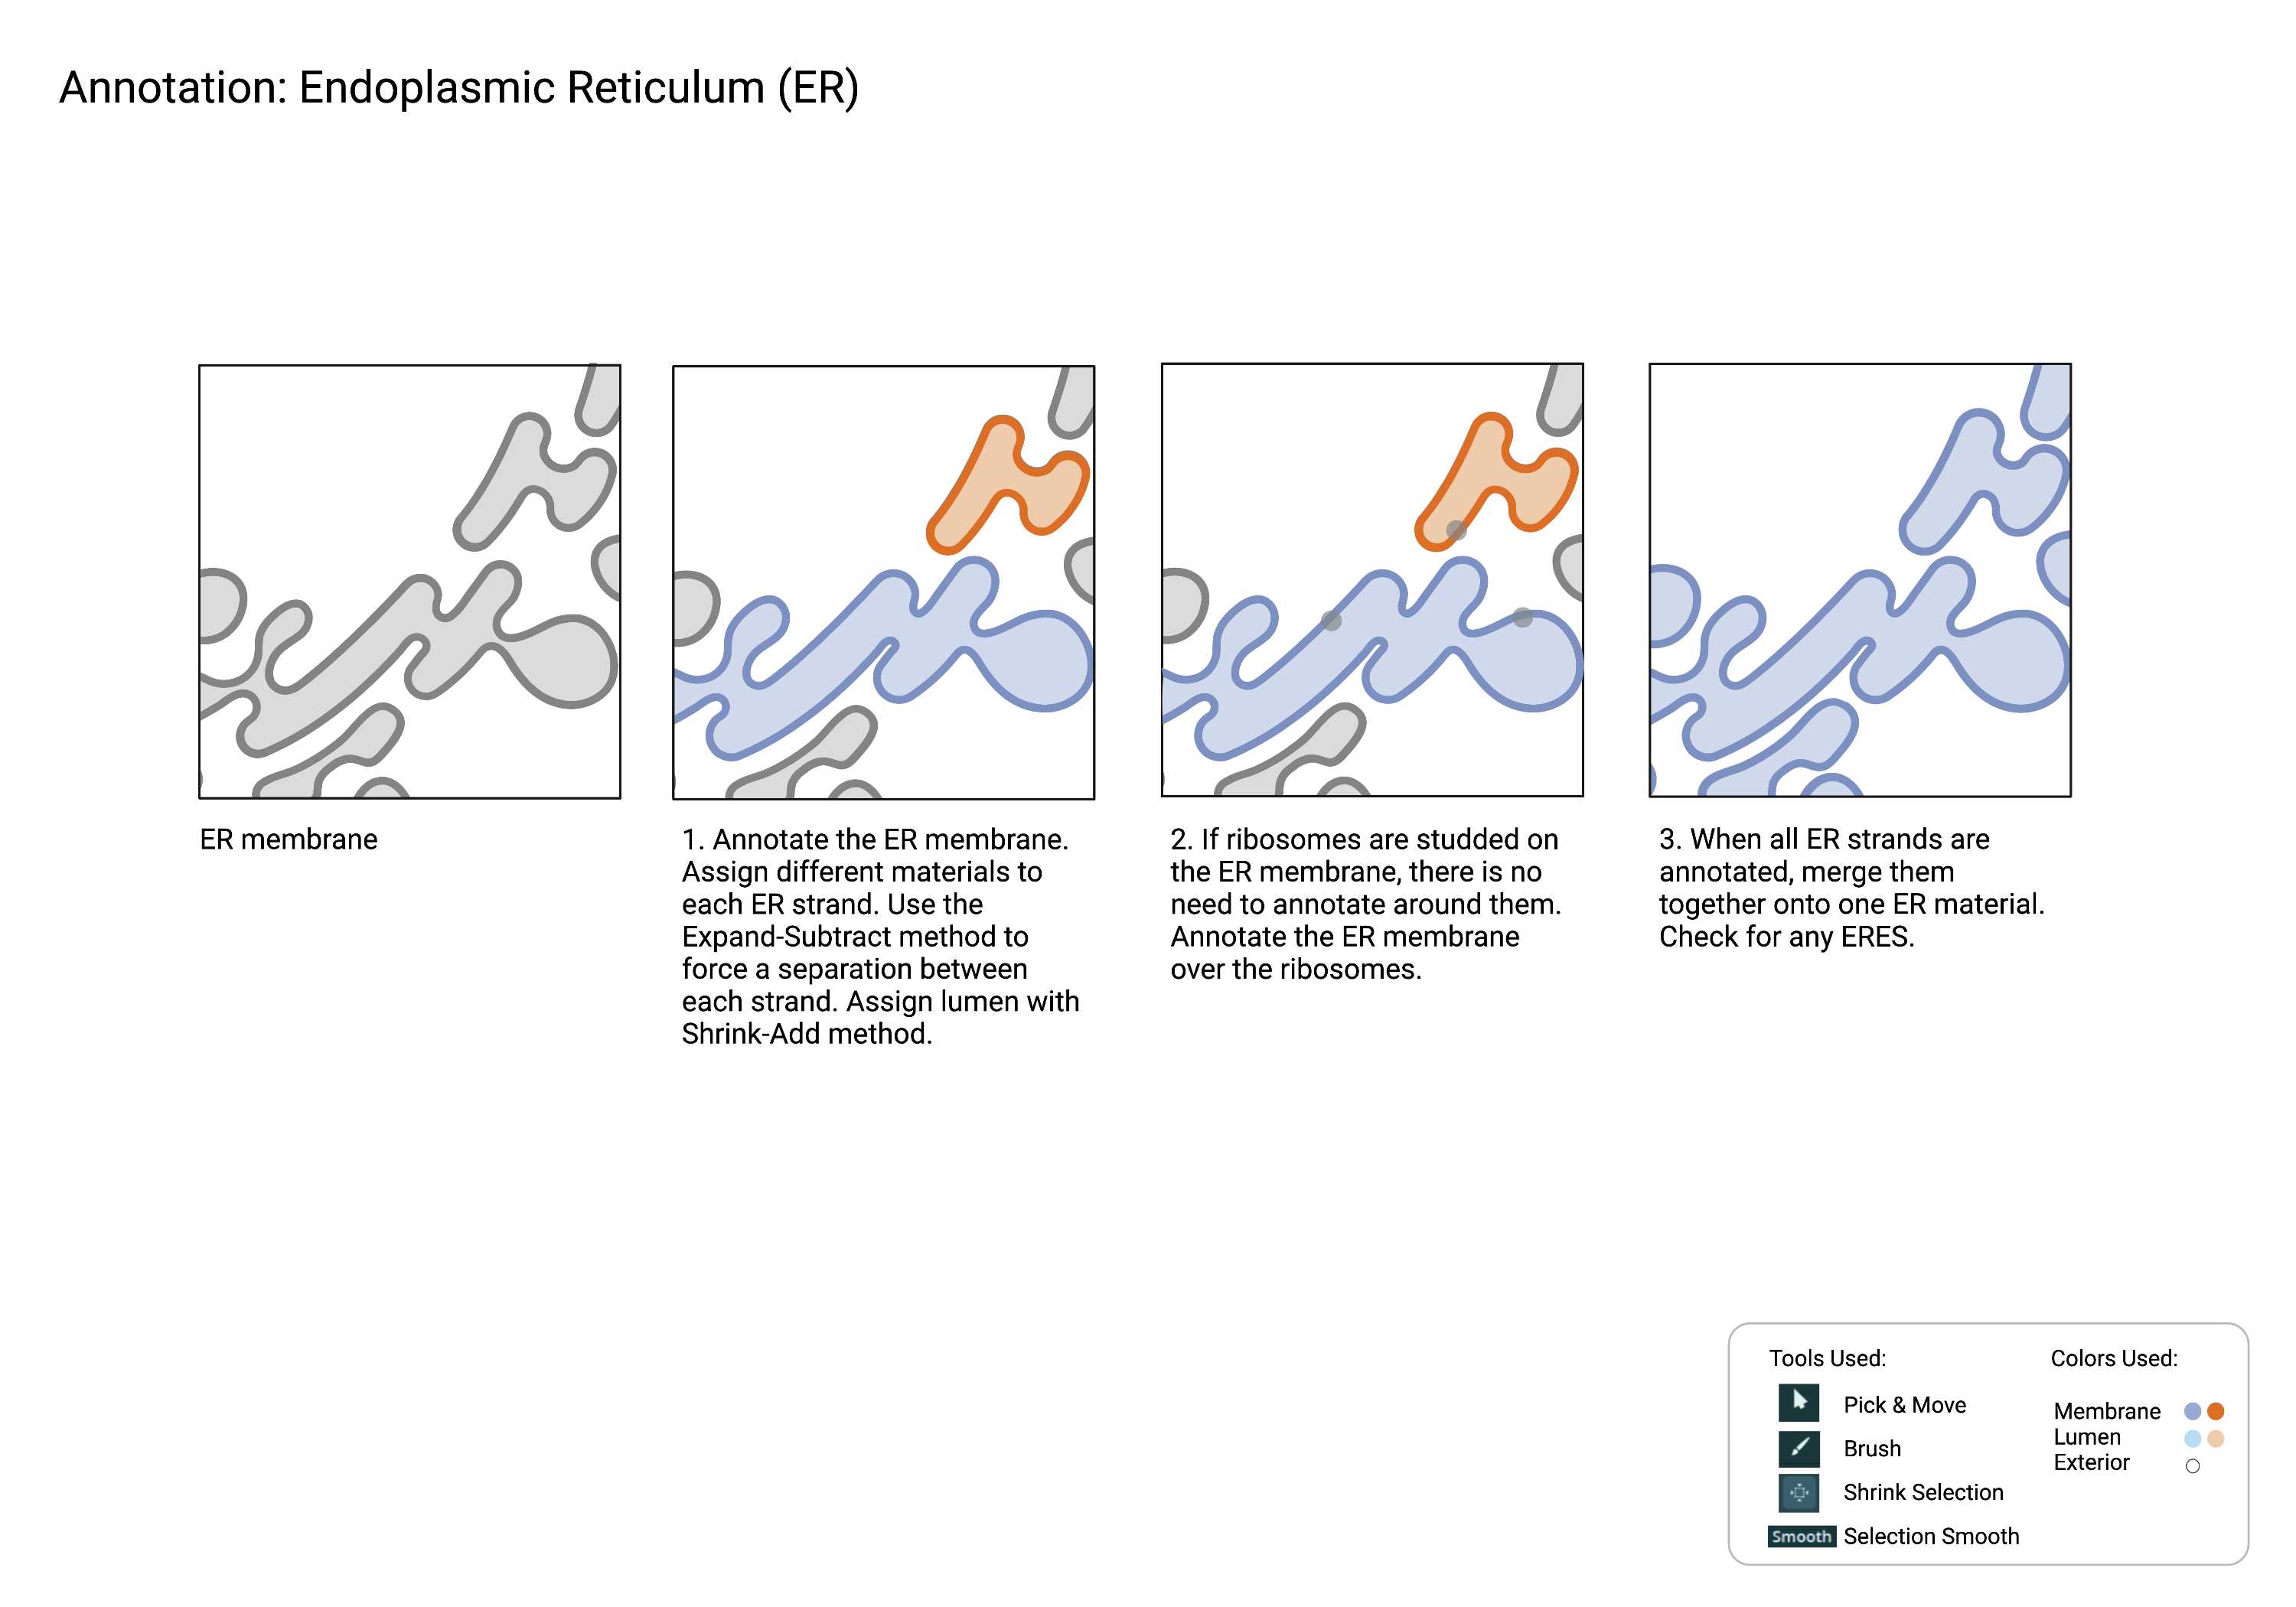
There are multiple strands of ER in the crop. Sometimes neighboring strands can merge unexpectedly due to various factors such as smoothing and interpolation.
-
Merged strands must be separated. Sometimes, it is hard to pinpoint the exact spot where two ER strands are touching within the same material. However, we can force a separation between different materials that are touching with the Expand-Subtract method.
-
There is no limit to the number of label fields and materials you can use. It is recommended to utilize as many as desired. If the project size becomes too large, delete the least used label field from the project panel.
-
Interpolation estimates and computes the selection between slices. It is recommended to use interpolation between frames where the organelle morphology does not shift much. For optimal results, annotate the ER strand on a small section at a time.
ER
ERES
- There are multiple ways to annotate ERES, but multiple annotators prefer this method due to its simplicity and accuracy.
Label field 1
-
Annotate ER and ERES together as if they belong to one big class. Do not worry about the merging point yet. Outline the structure and make sure the membrane is enclosed.
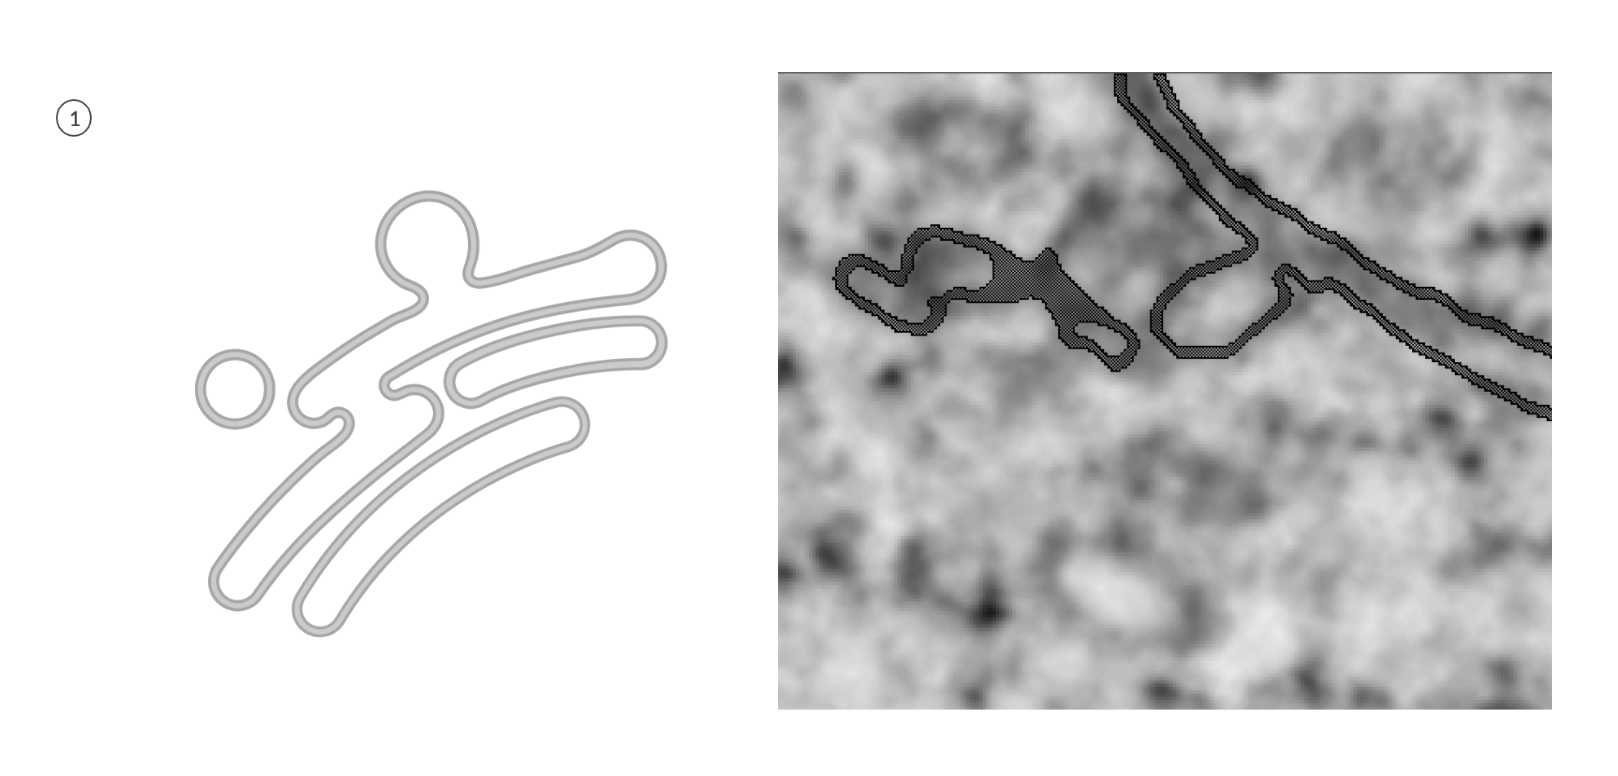
Fig 5.2.2 ERES Annotation 1 -
Click and assign the 'background' to cytosol material. Keeping the cytosol material locked will prevent making any unwanted annotations outside of the ER/ERES membrane.
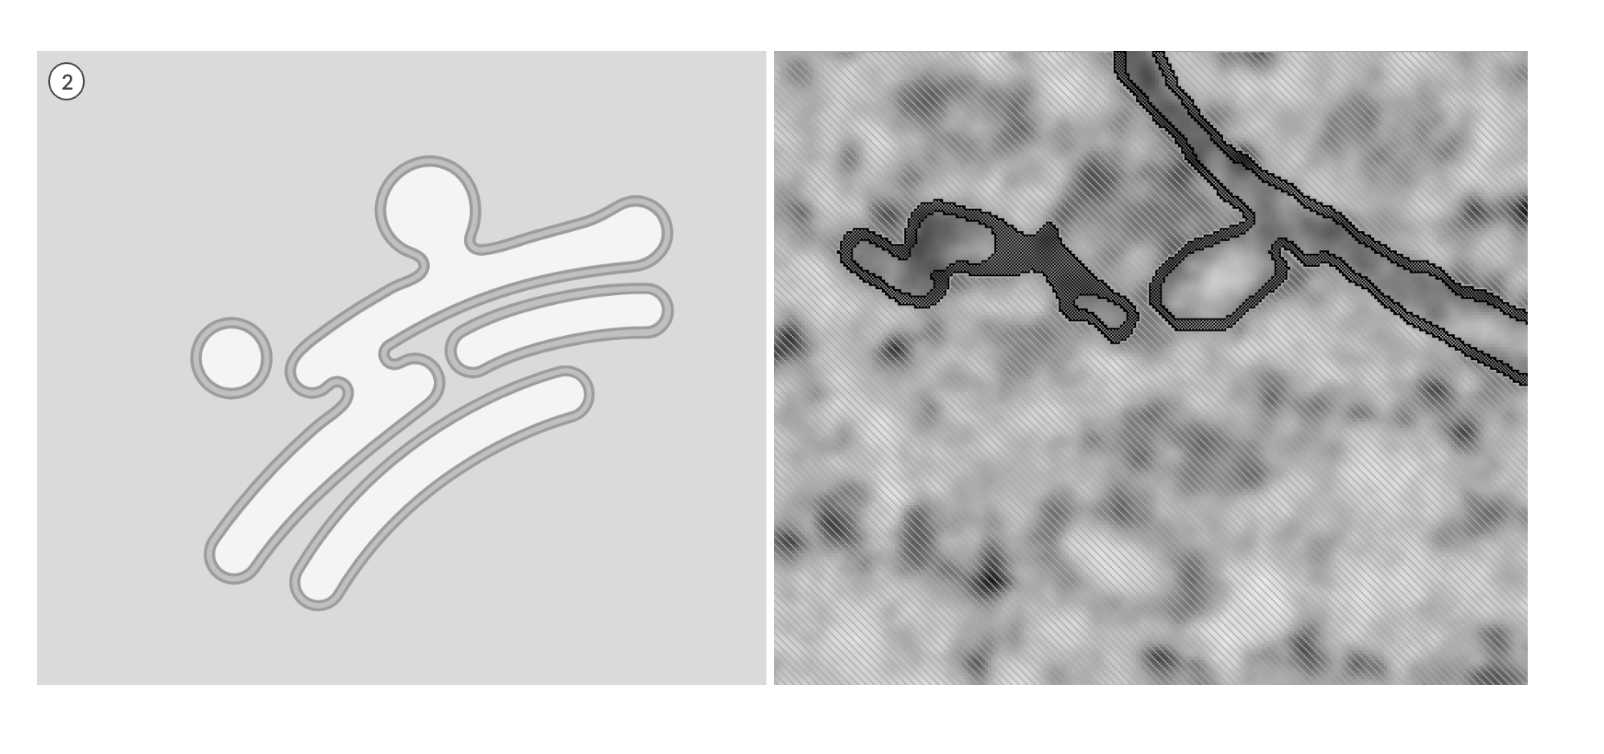
Fig 5.2.3 ERES Annotation 2
Label field 2
-
Draw a straight line where the two membranes meet, then interpolate until you get to the frame where they are entirely separated. Since the
backgroundis locked, your selection outside the membrane will not be affected. Make sure to double-check the line in all three planes. If there is a gap or break, the selection will overflow and not recognize the separation between the two membranes.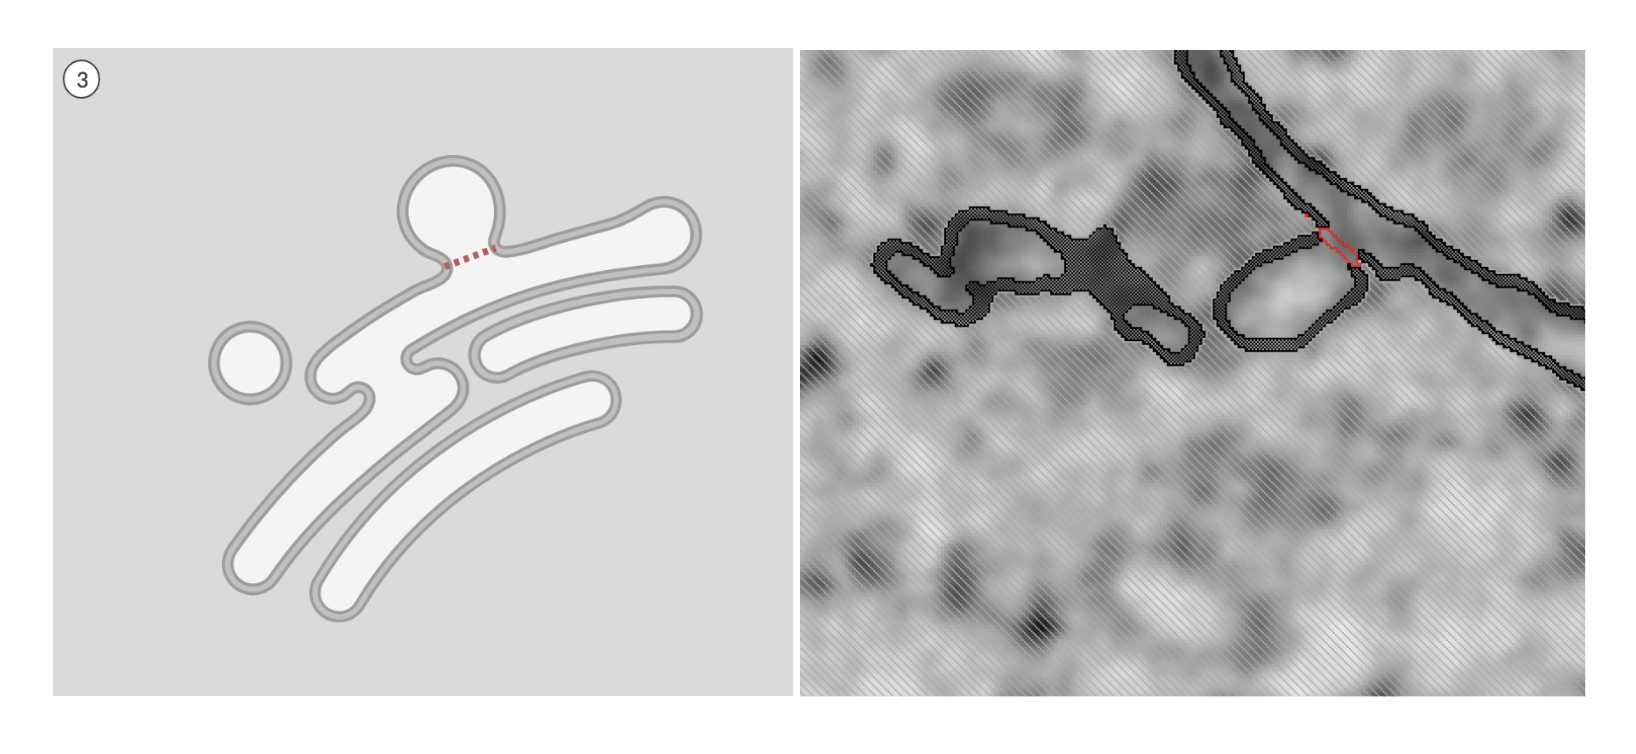
Fig 5.2.4 ERES Annotation 3 -
Now that a line separates the ER and ERES, you can reassign the selection to the corresponding materials.
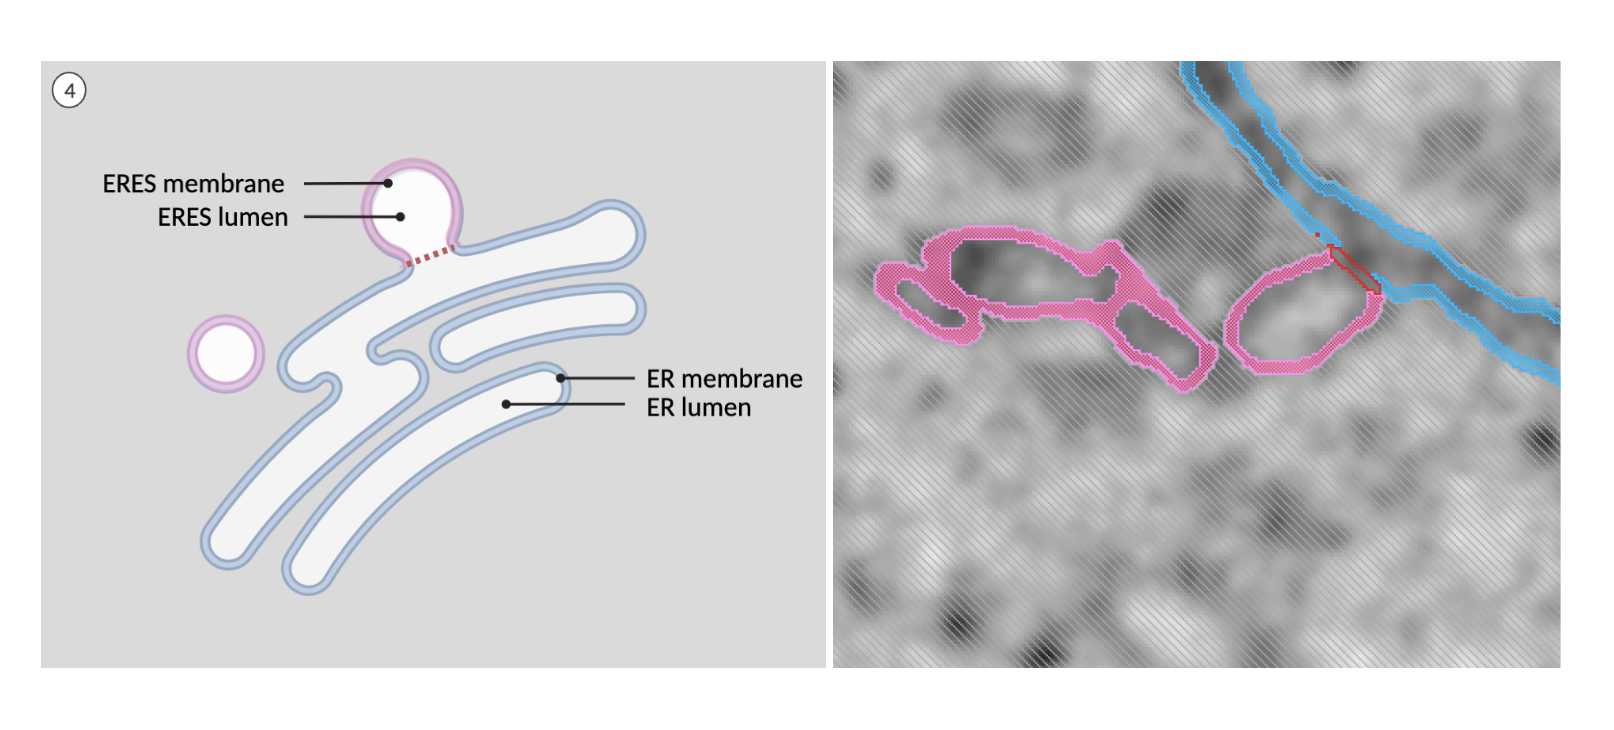
Fig 5.2.5 ERES Annotation 4 -
The pixels at the merging/separation point (temporarily labeled as 'line') need to be reassigned. Lock the ER membrane material in labelfield 2. Next, select the ER/ERES combined membrane from labelfield 1 and add the selection to ERES membrane in labelfield 2. This method will re-close the break in the membrane.
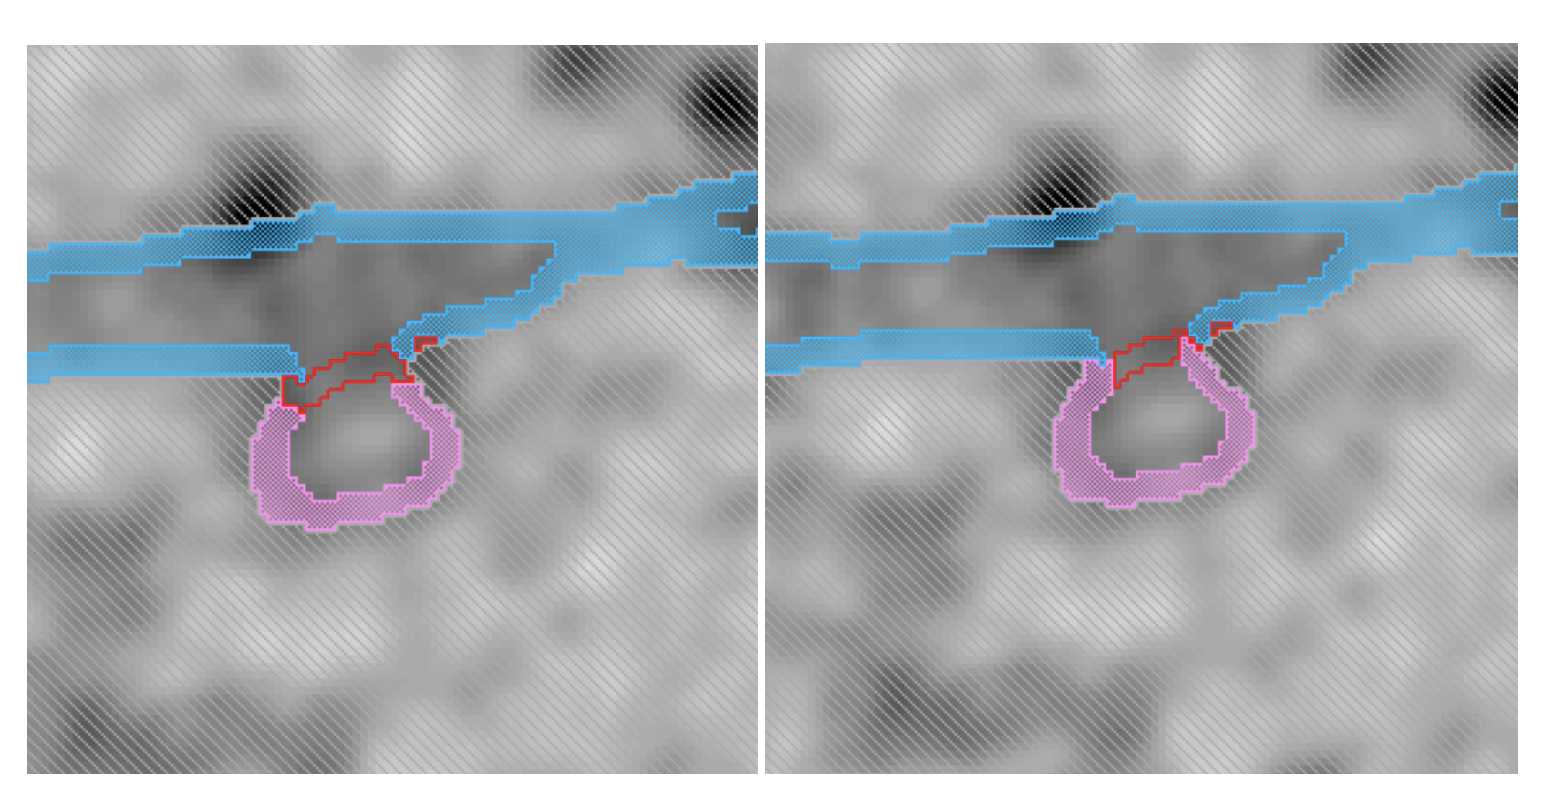
Fig 5.2.6 ERES Annotation 5 -
Assign ER lumen and ERES lumen. Then click the line that is inside the membrane and assign the selection to ERES membrane. Do not select from the materials list.
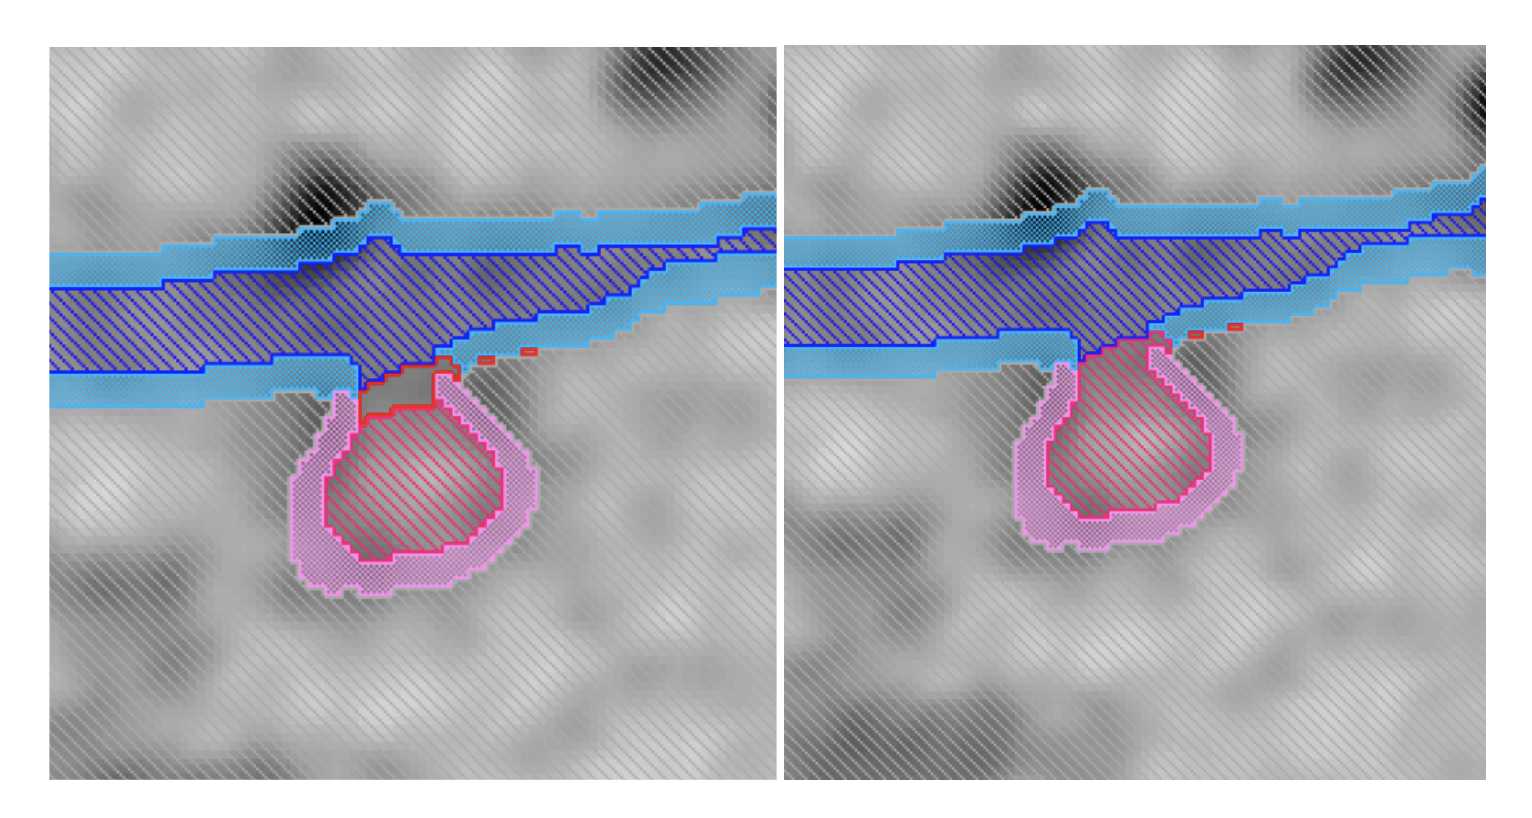
- Use all three planes to check for random pixels and reassign them to the appropriate material. Smooth if needed.
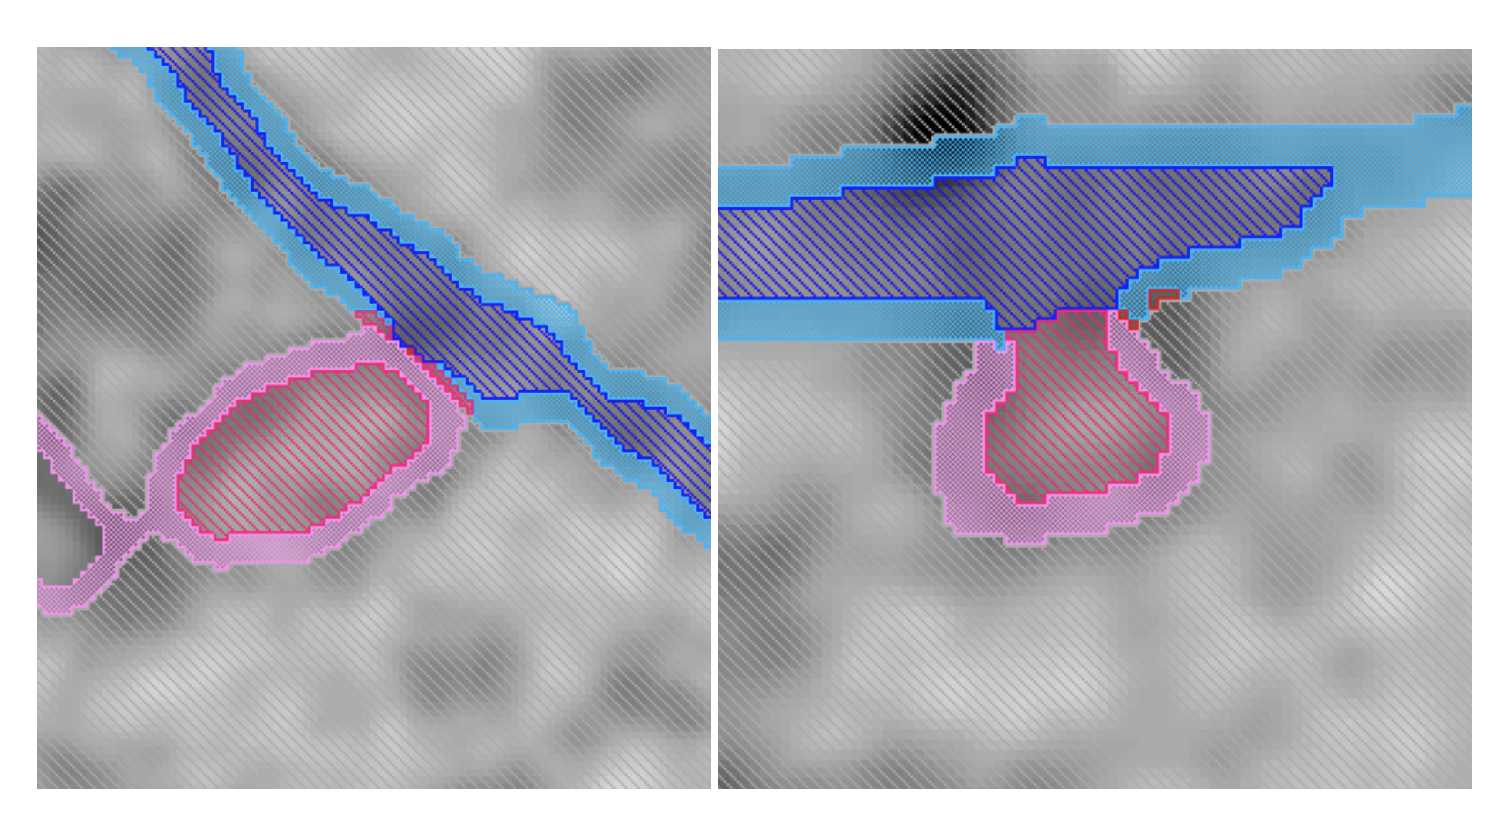
Fig 5.2.8 ERES Annotation 7
Checklist
- ER and ERES merging site is not jagged.
- No random pixels or mislabelled single pixels between the membranes.
- All membranes are enclosed and have no holes in them.
Golgi
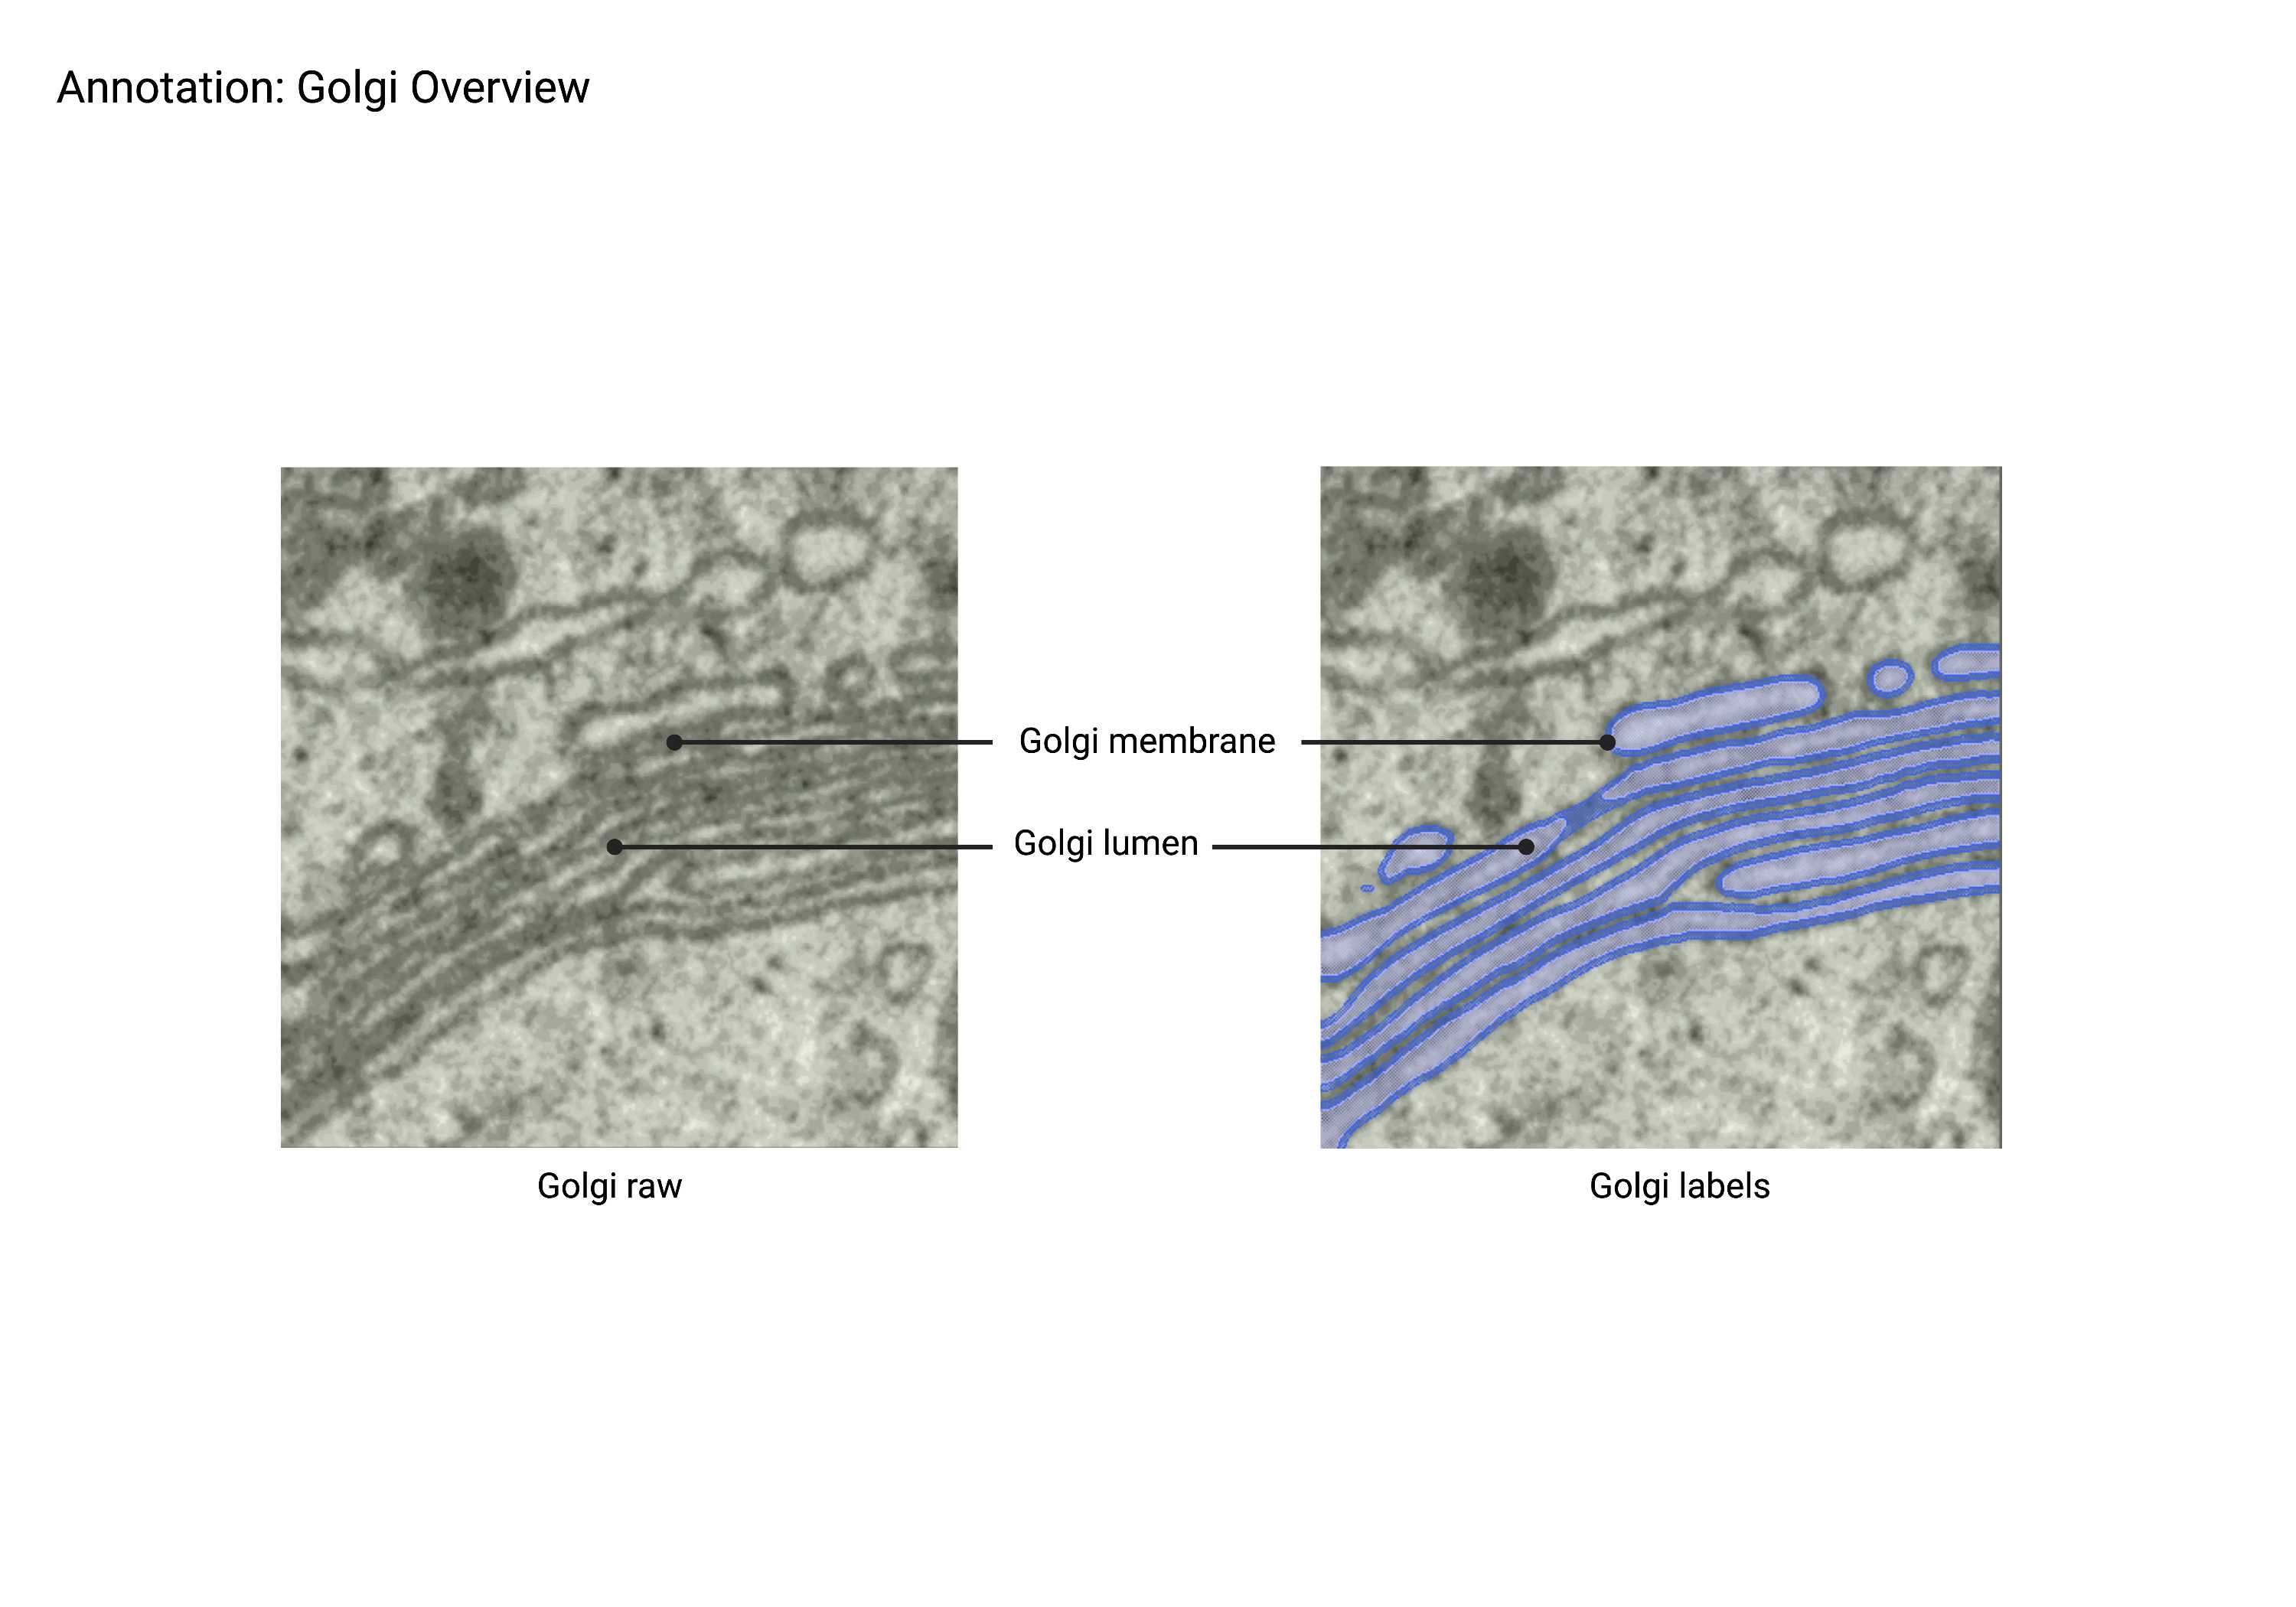
Golgi
Summary
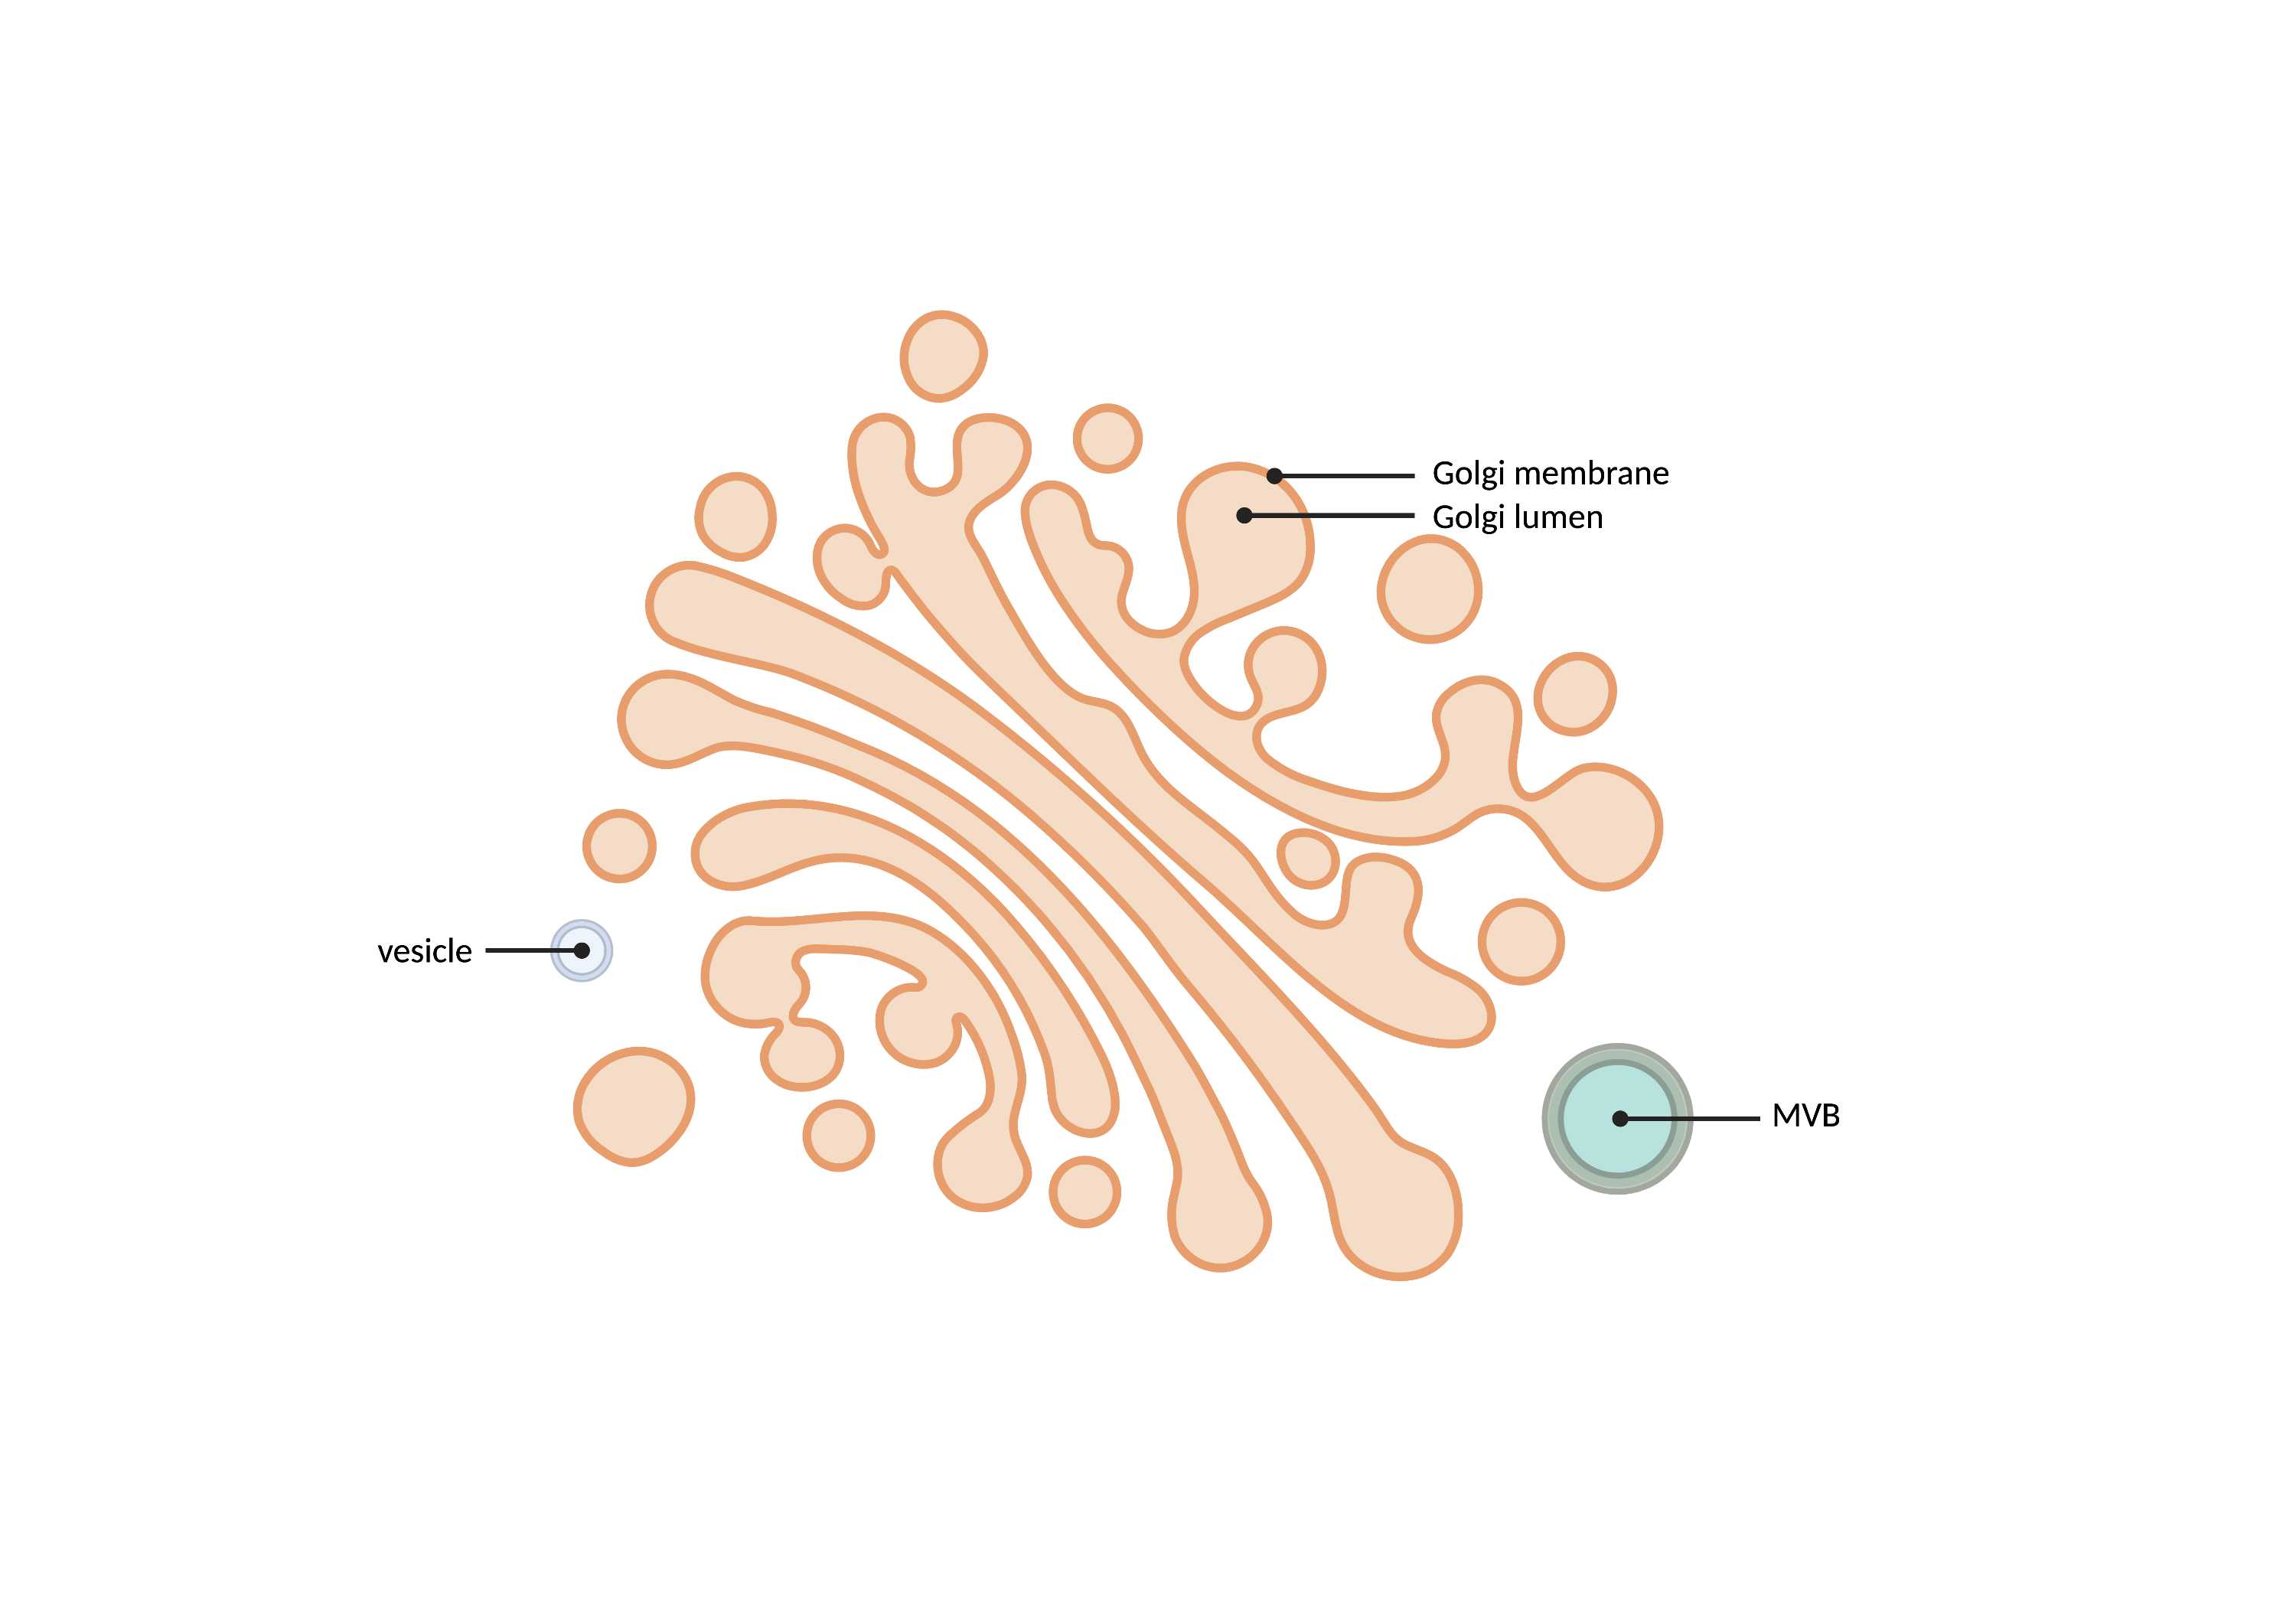
- Stacked, "pancake-like" structures that uniformly morph and bend together. Gaps of a similar thickness to each Golgi layer compose a Golgi apparatus that often consists of 5-7 layers. Stacks may be interconnected and often connect to ER network and endosomal network (Endo). Surrounding and budding vesicles are often included in the Golgi network.
Description
- Stacked organelle with ‘pancake-like’ structure.
- There are usually 5-7 stacks (not definitive though).
- Stacks may be interconnected.
- Stacks can also possibly connect to ER.
- Vesicles bud off of stacks.
- MVBs can possibly be connected to stacks.
Recommended Annotation Steps
-
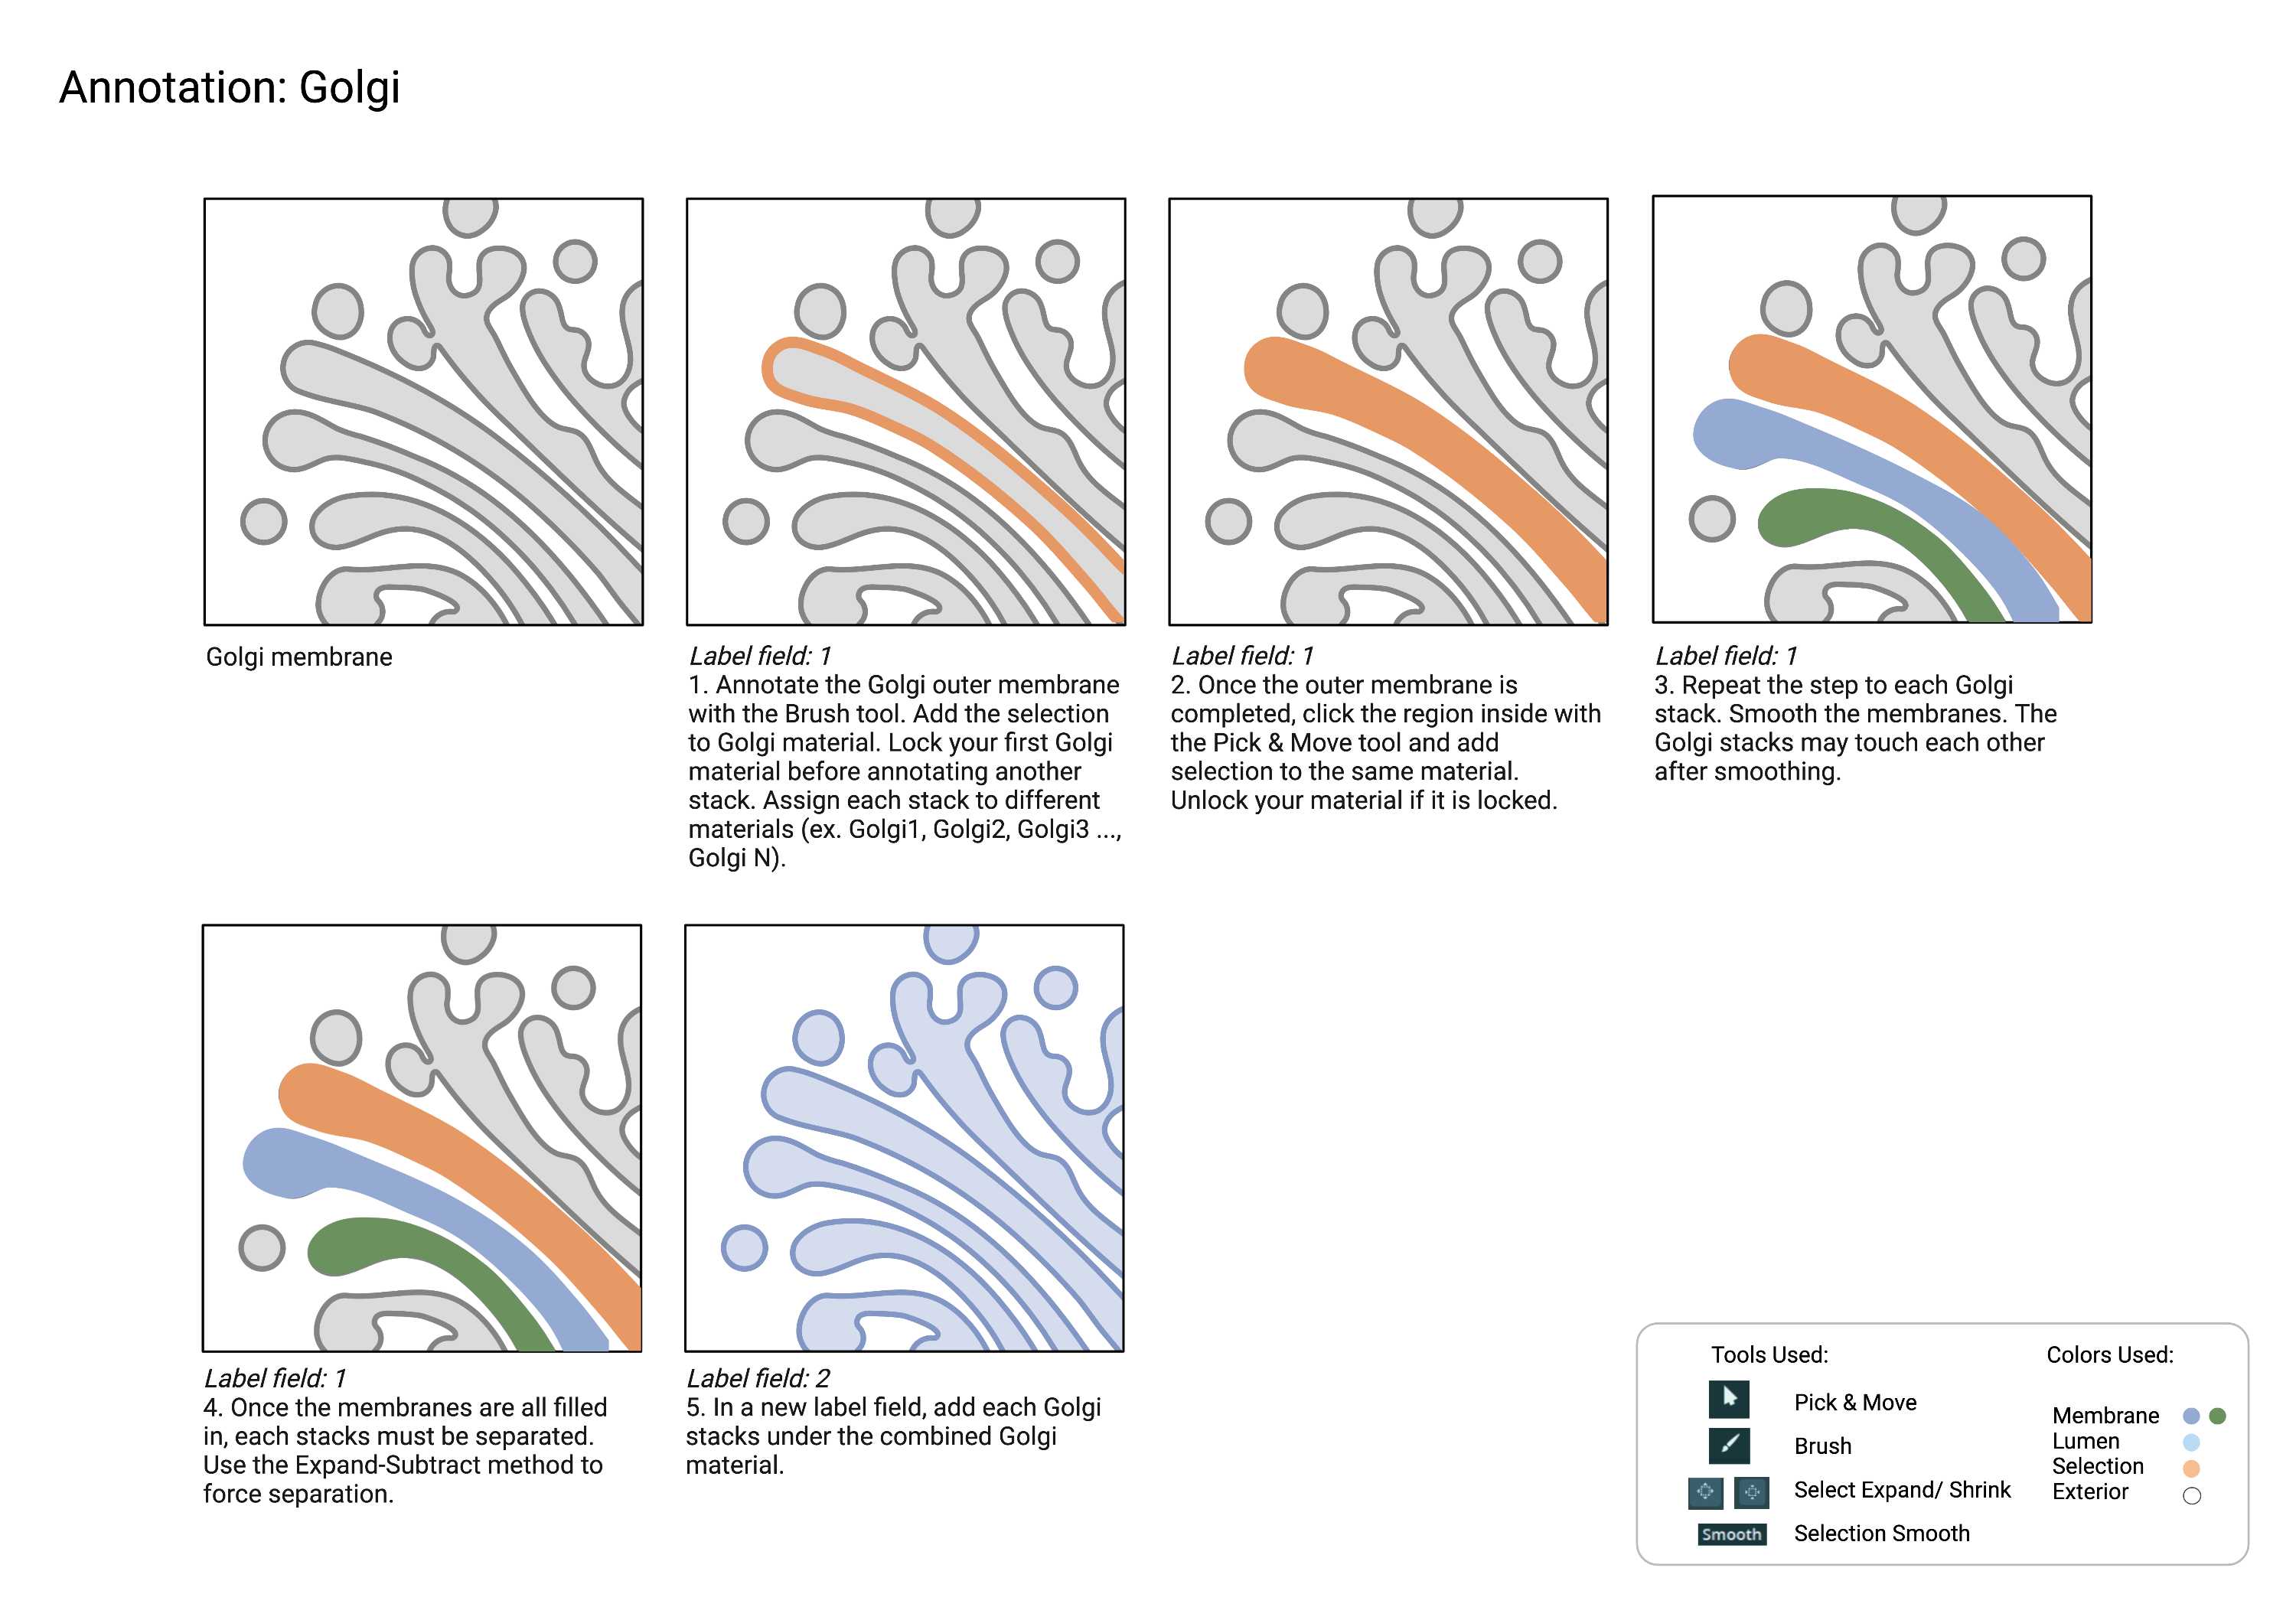
Golgi consists of multiple stacks that may or may not connect at one point.
-
Since the stacks are close to one another, it is recommended that you treat each stack as a different material until the last step to ensure they stay separated. Once every stack is defined and annotated, any connection points can be annotated in an additional label field and merged with the rest of the structure.
Checklist
- Each Golgi stack is completely separated.
- If there is a merging point between the Golgi stacks, connect the stacks.
Plasma Membrane
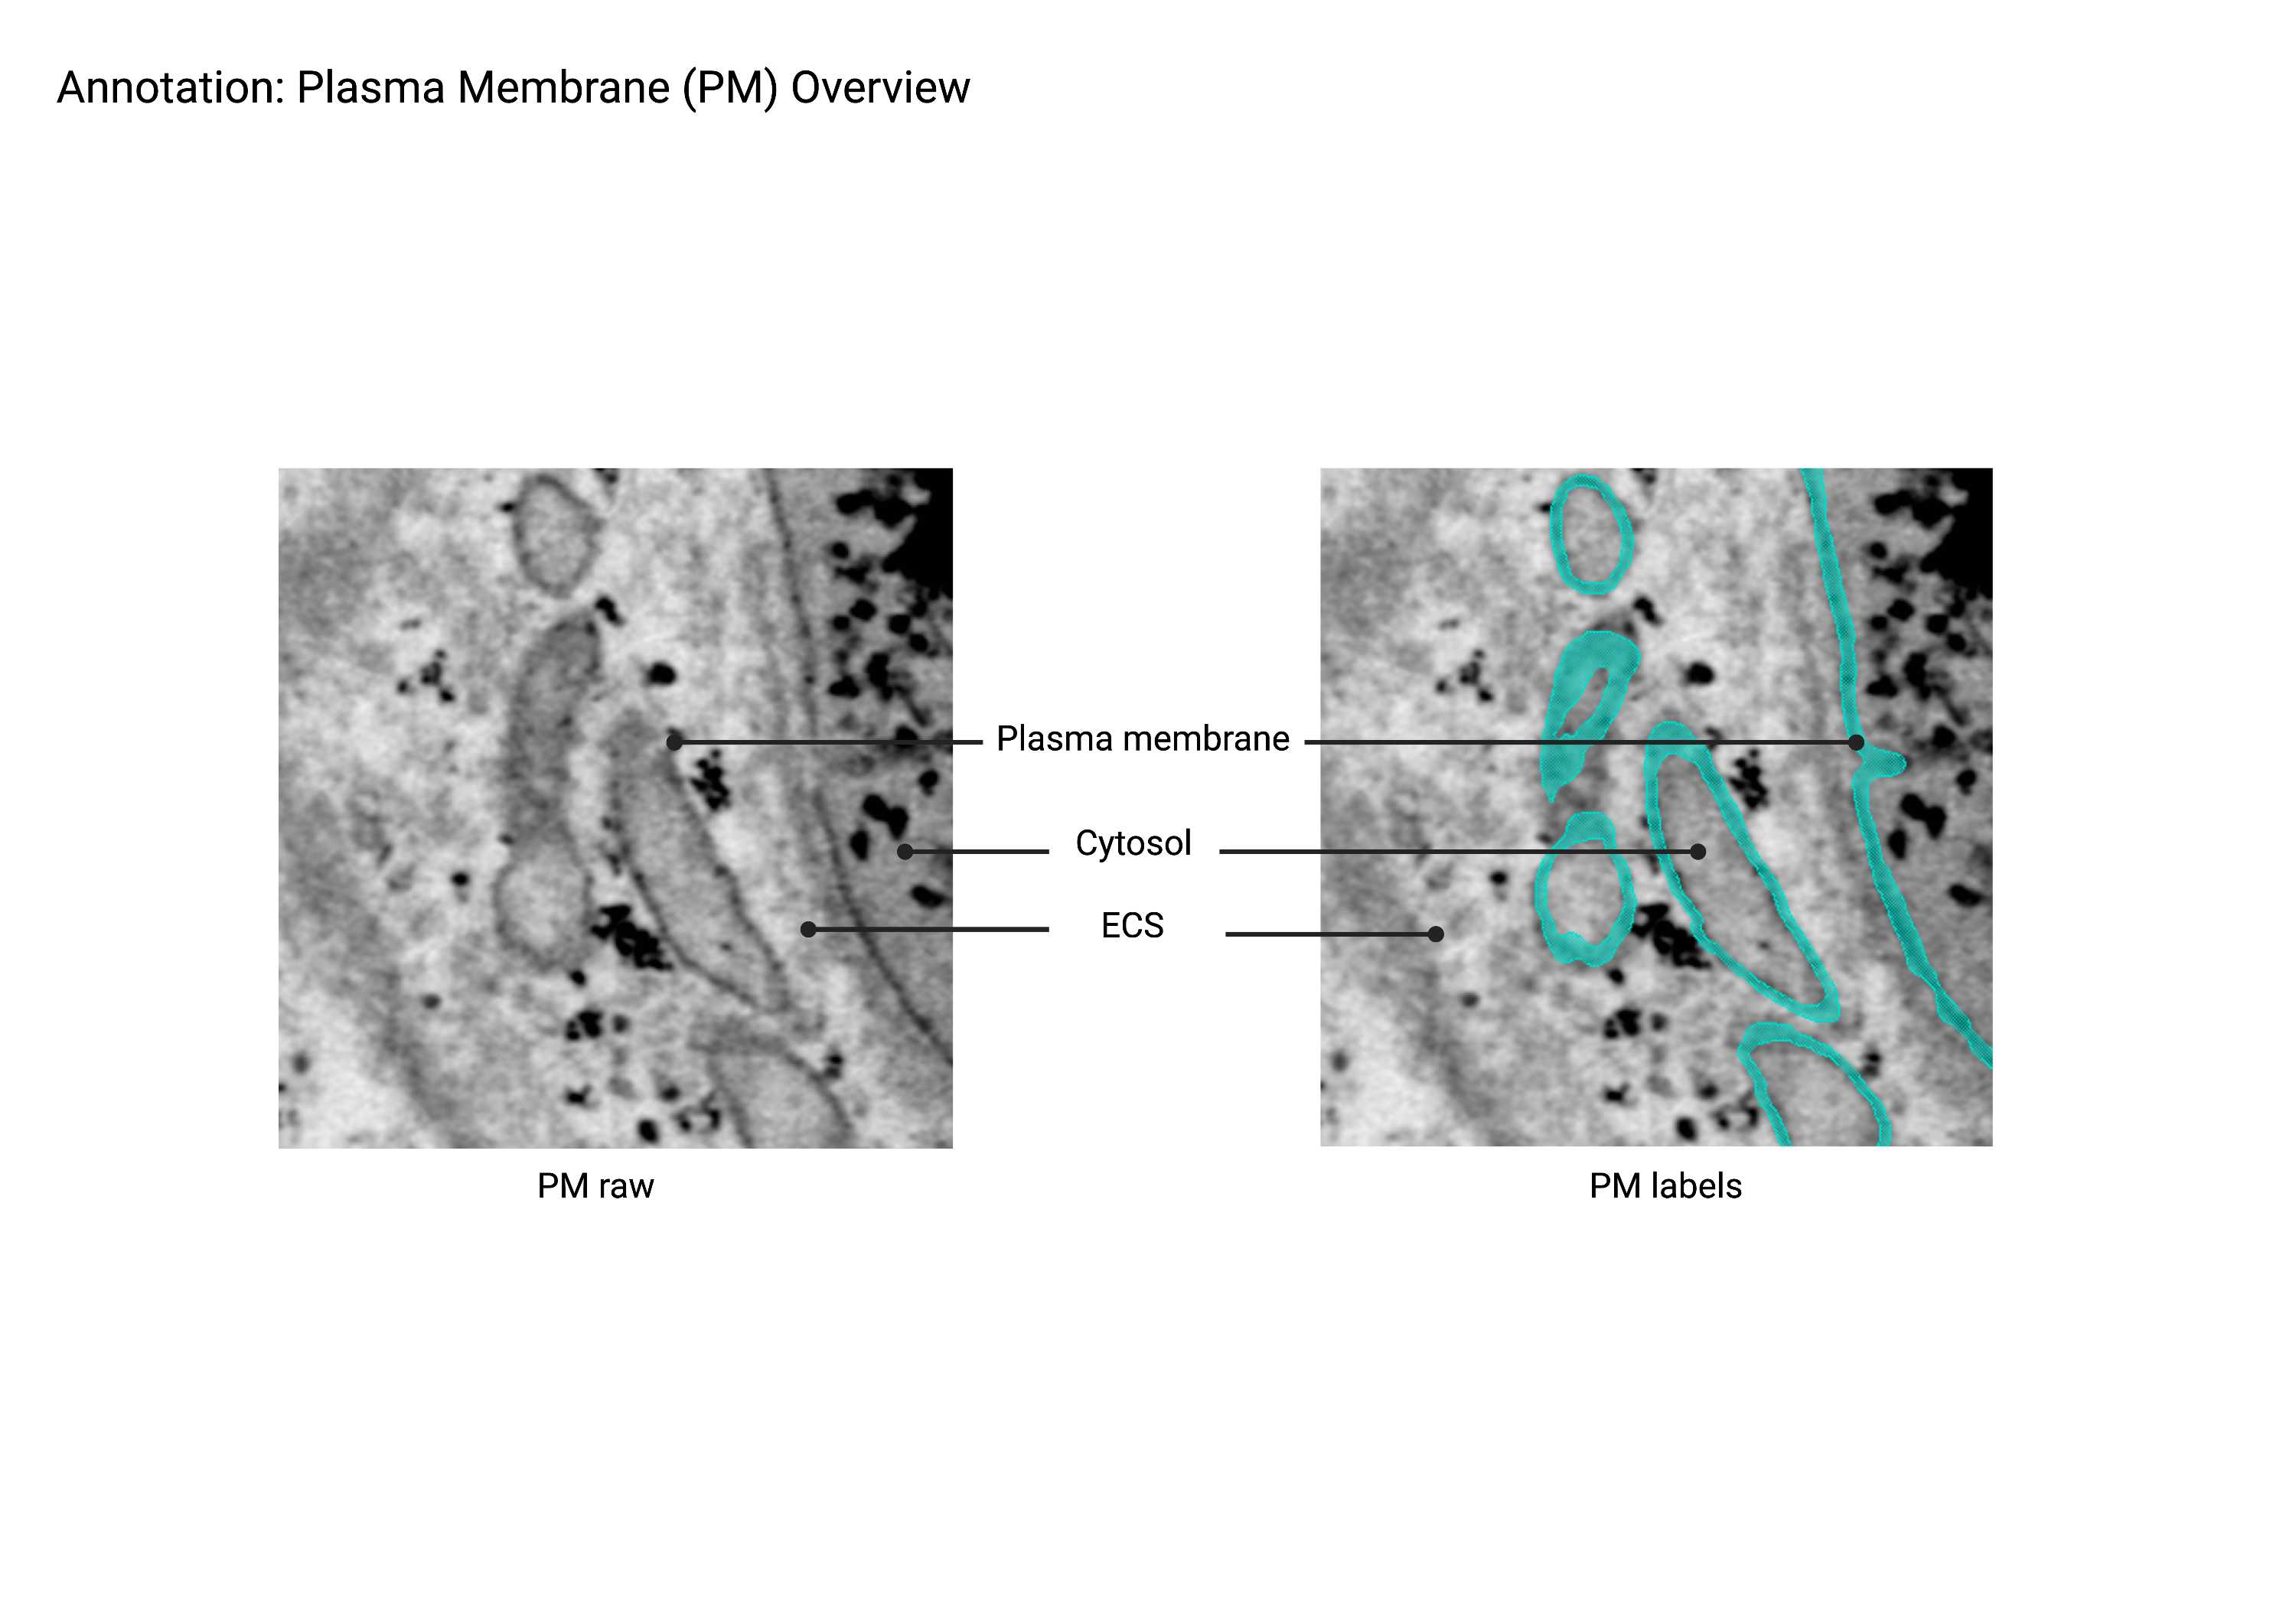
Plasma Membrane
Summary
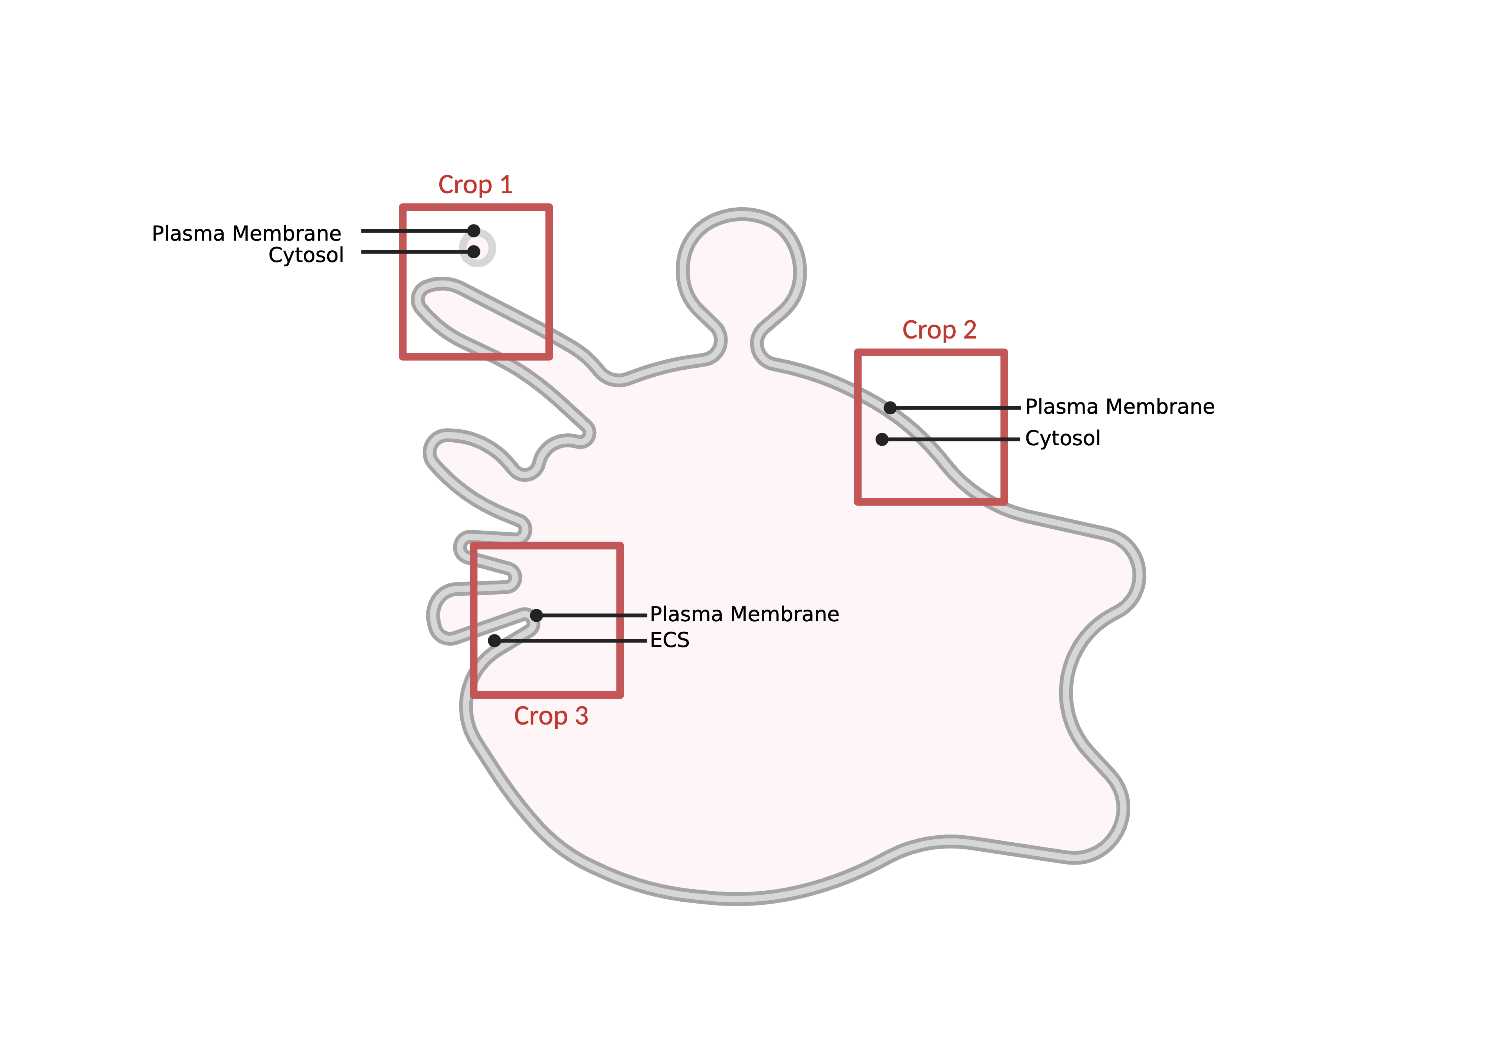
- A thin, extensive lipid bilayer that surrounds the cell and separates extracellular space from the cytosol. To be classified as plasma membrane, the membrane must always connect back to itself. Otherwise, the membrane is most likely part of the endosomal network (Endo).
Description
- Surrounds the cell, separates ECS from cytosol.
- Always connects back to itself.
- If disconnected, then it’s an MVB.
Recommended Annotation Steps
-
The plasma membrane separates the interior of the cell from the extracellular space. Since it is an enormous structure, the morphology might differ between each cell and tissue type depending on how the raw images were cropped.
-
Build the structure by working on a small section at a time. Utilize the 3D viewer to double-check the membrane.
-
Sometimes, the crop will contain a plasma membrane region that folds into finger-like projections. In this case, use multiple materials to annotate each side of the plasma membrane finger. This will ensure that the neighboring membranes are separated.
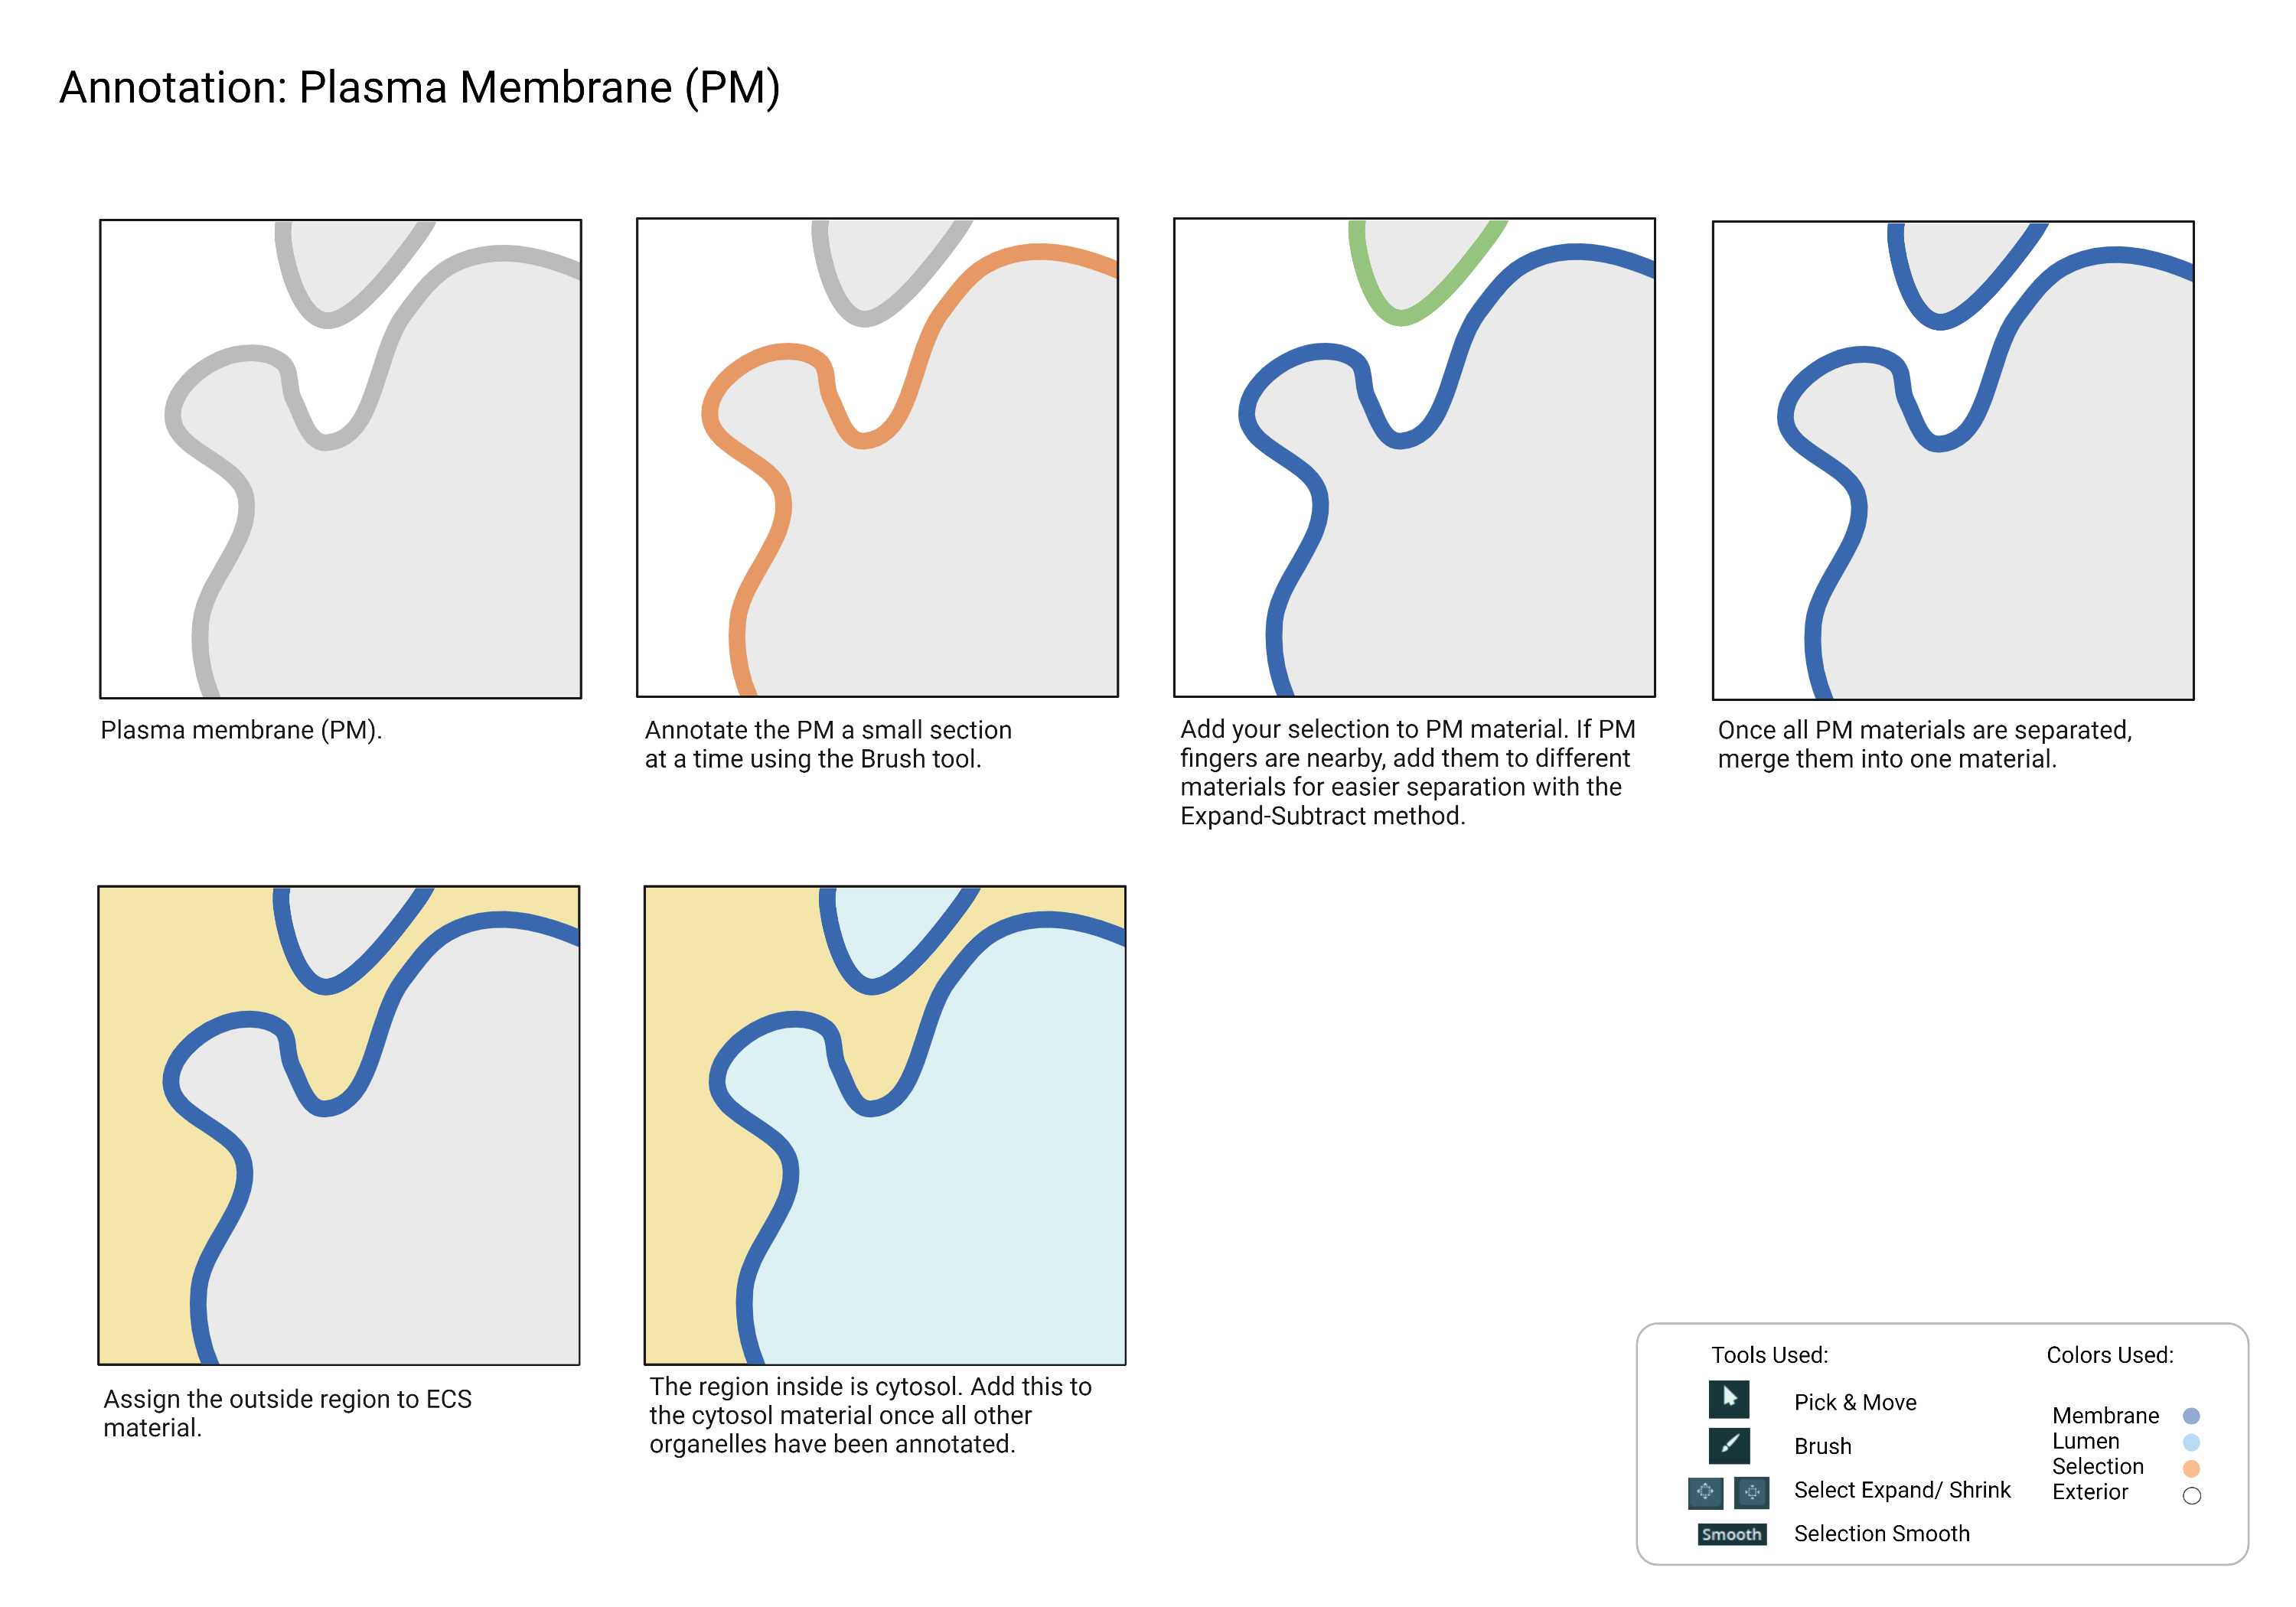
Fig 7.2.1 Plasma Membrane Annotation
Checklist
- Plasma membrane fingers/folds are annotated.
- There is cytosol inside the folded-in, fingerlike projections of the plasma membrane.
- Membrane thickness matches the actual organelle in the raw image.
Endosomes
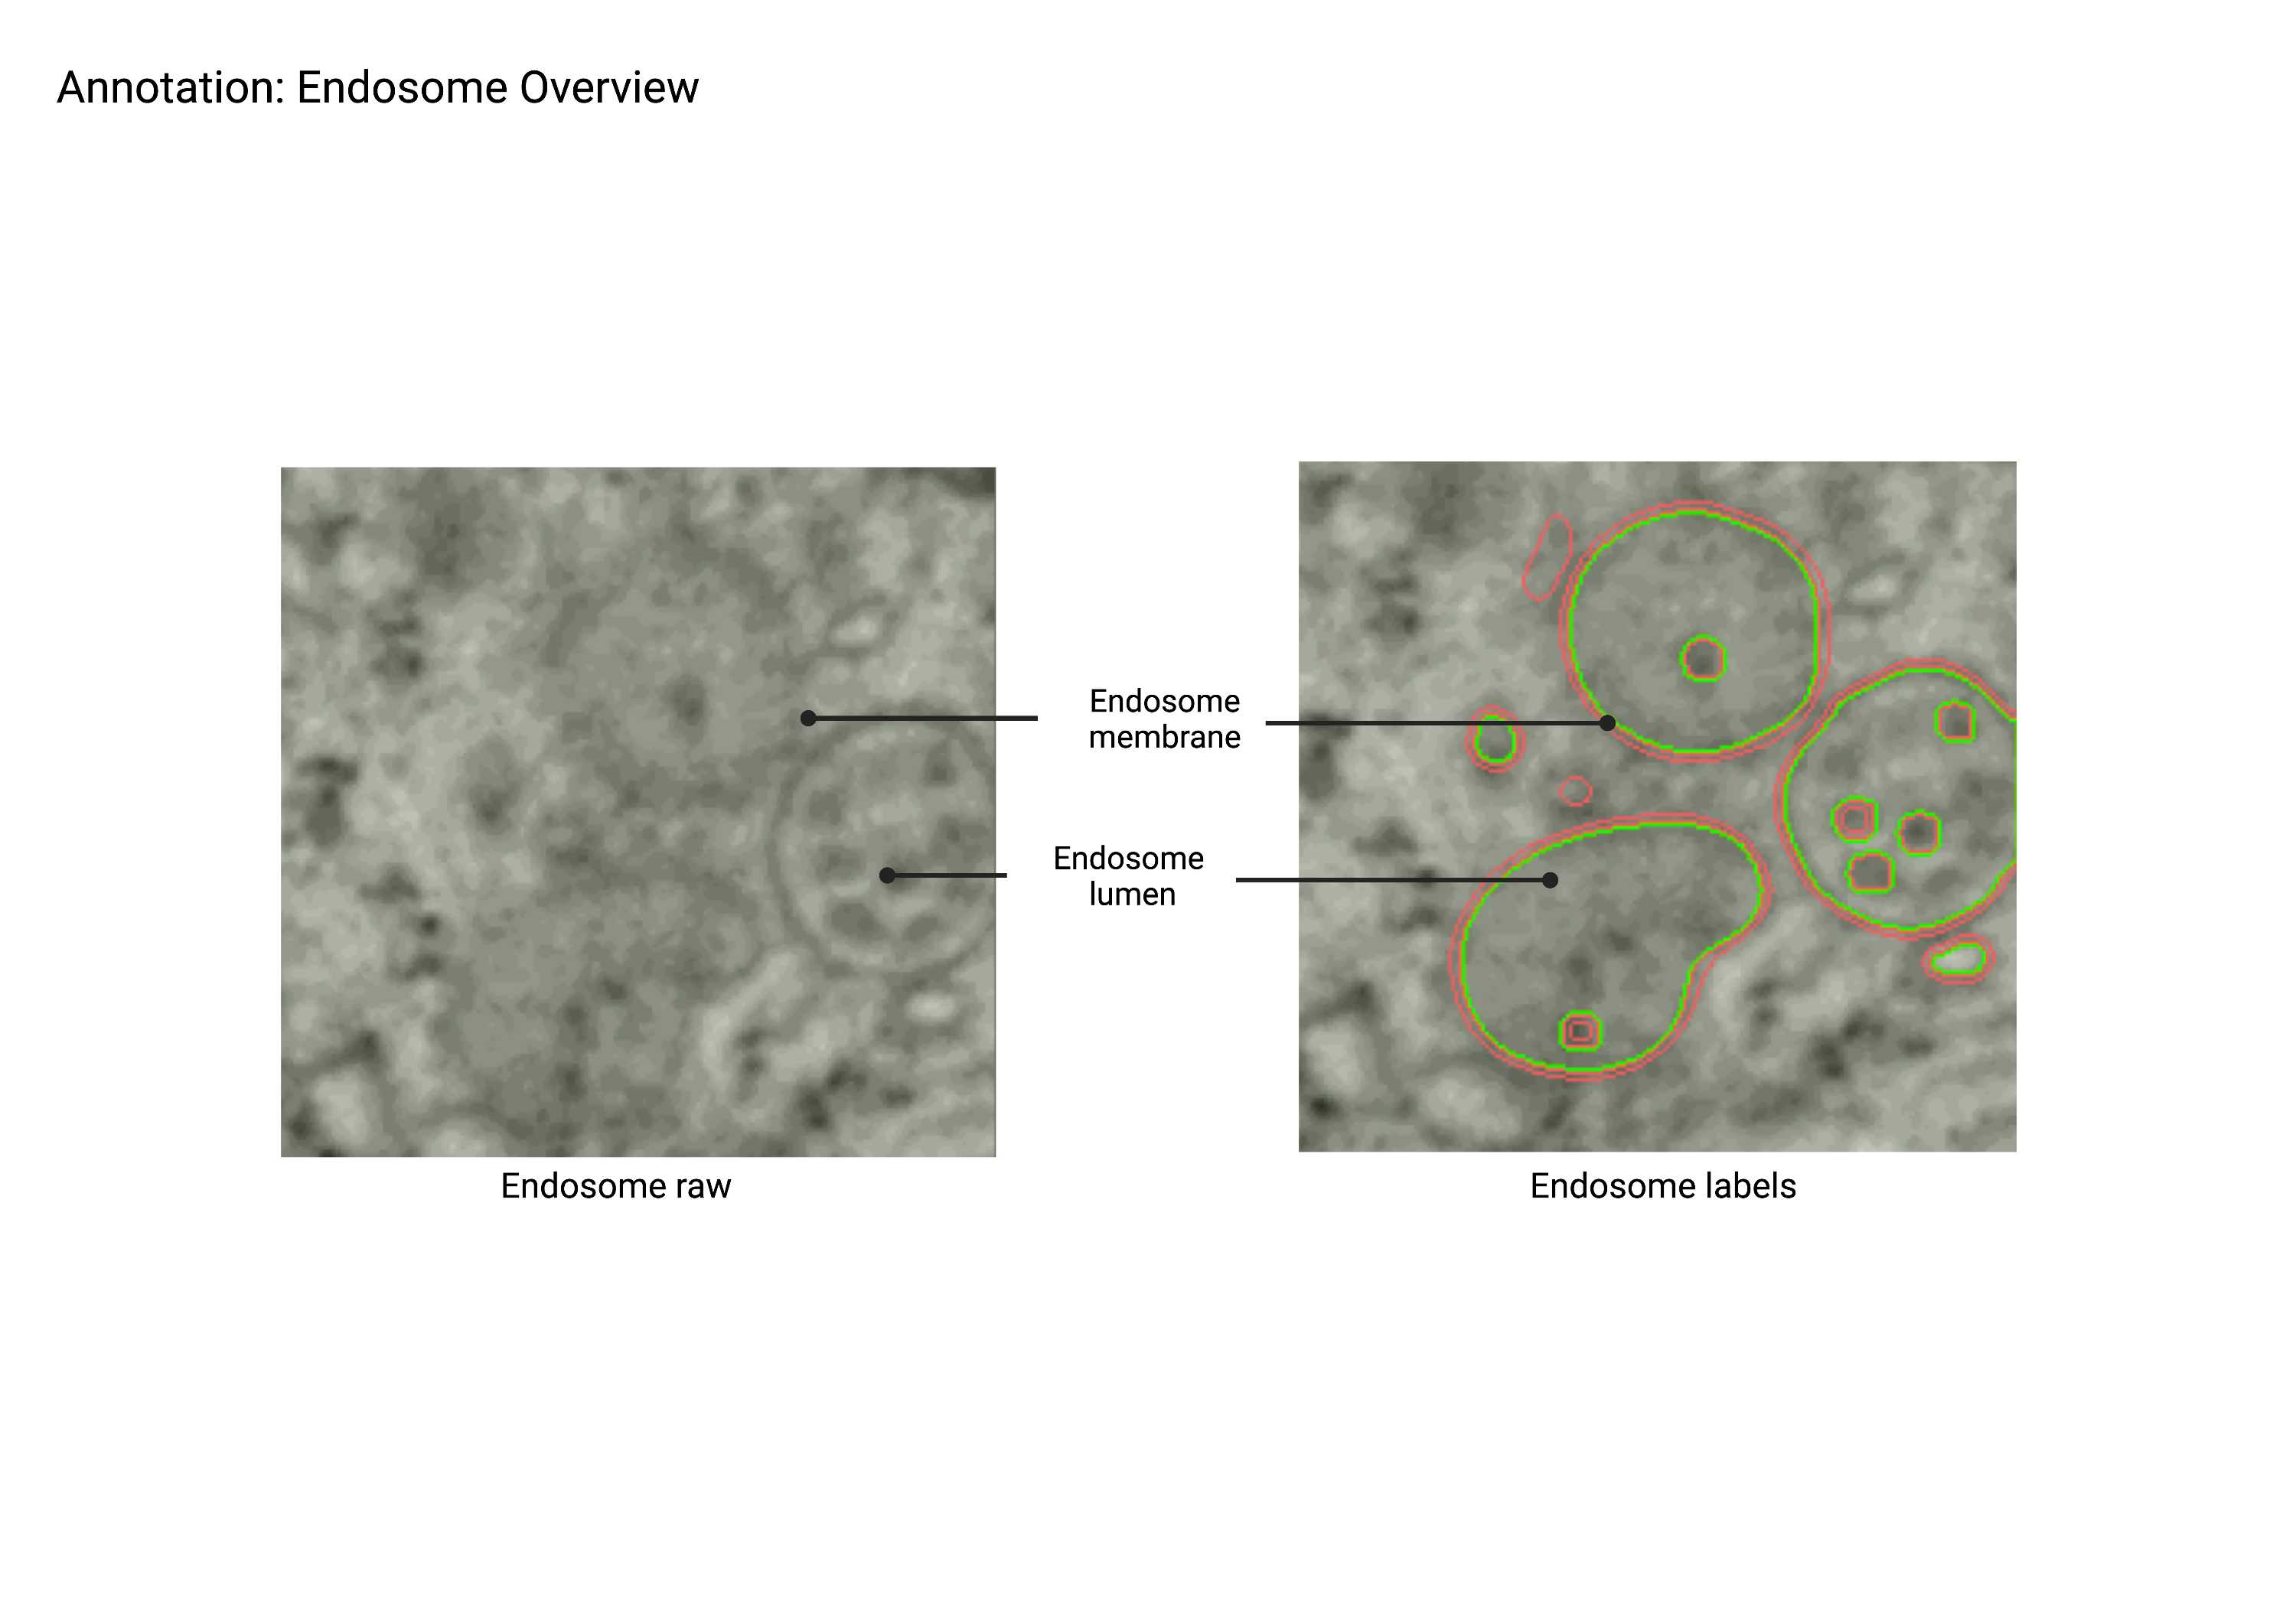
Endosomes (MVBs, Lysosomes, Vesicles)
MVBs
Multi-Vascular Bodies (MVB)
Summary
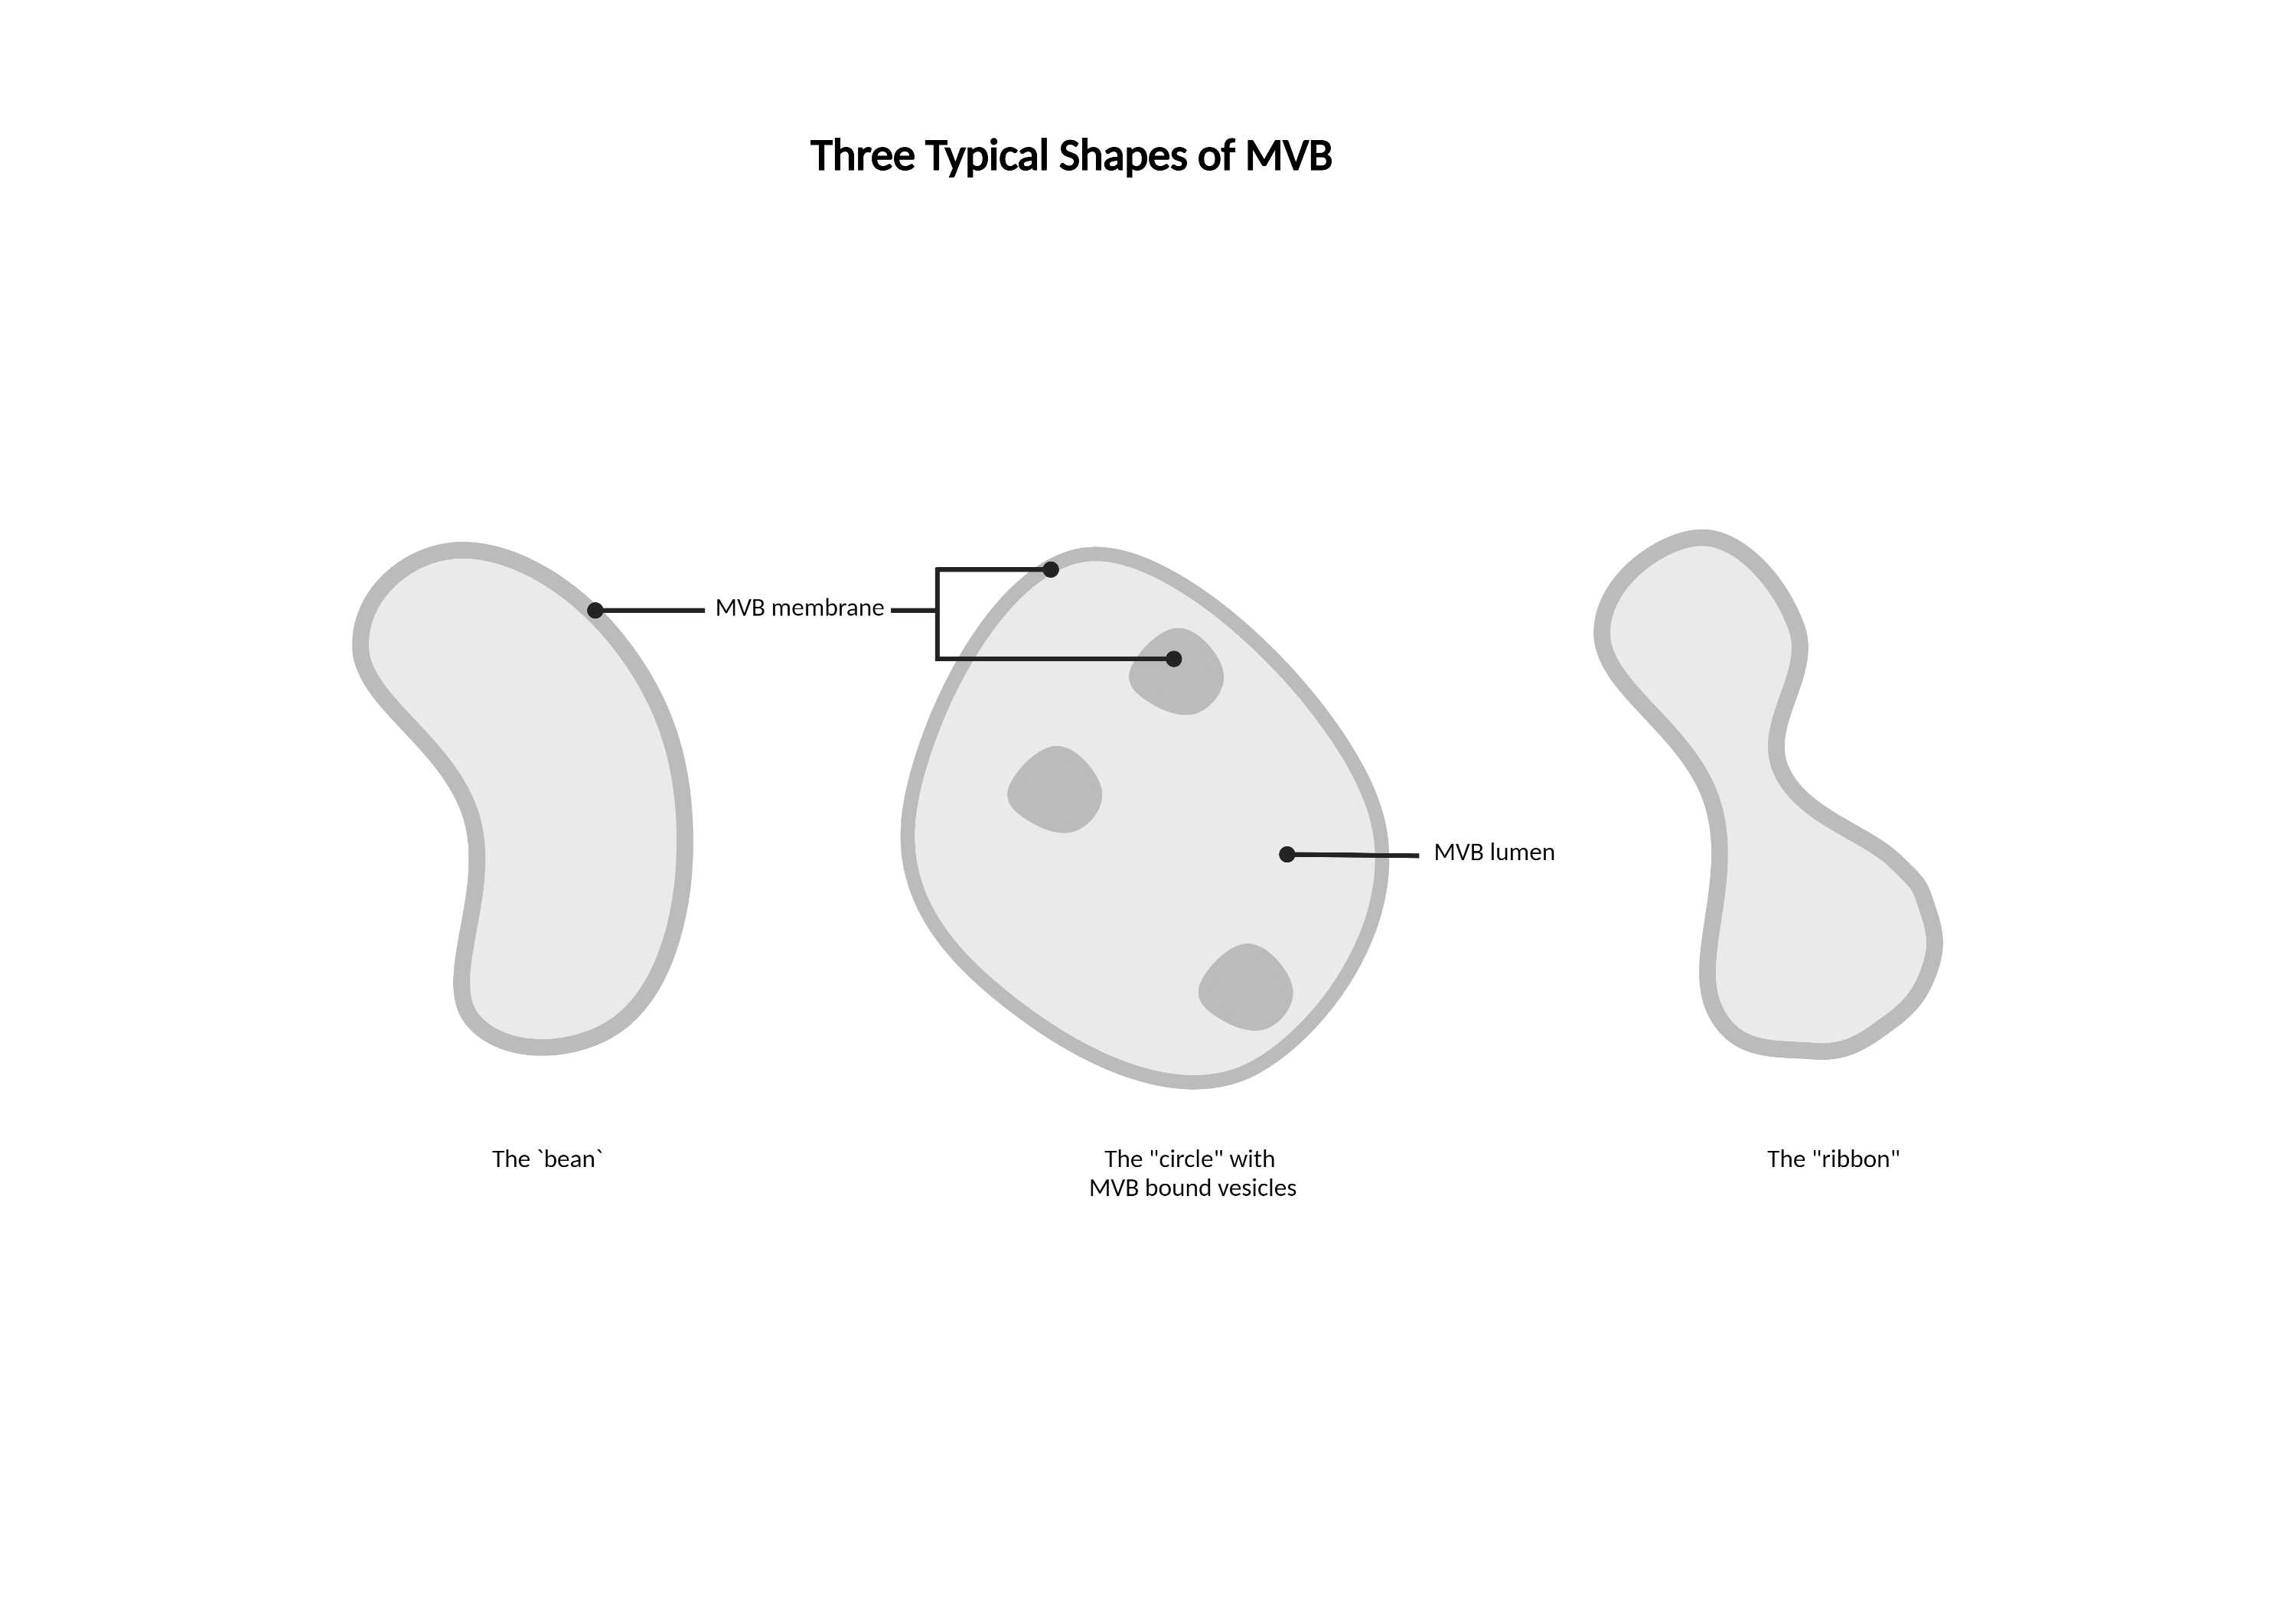
- Light lumen organelles that constitute the endosomal network. These structures have a few characteristic morphologies, including ‘ribbon’ structures and spheres with multiple membrane invaginations. The endosomal network class includes autophagosomes, endosomes, multivesicular bodies (MVBs), and peroxisomes as EM staining alone is not sufficient for differentiation.
Description
- Light lumen “round” organelles that are larger than vesicles.
- Some MVBs have a 'ribbon' shape.
- Can have multiple membranes.
- Includes: MVBs, autophagosomes, endosomal network, and peroxisomes.
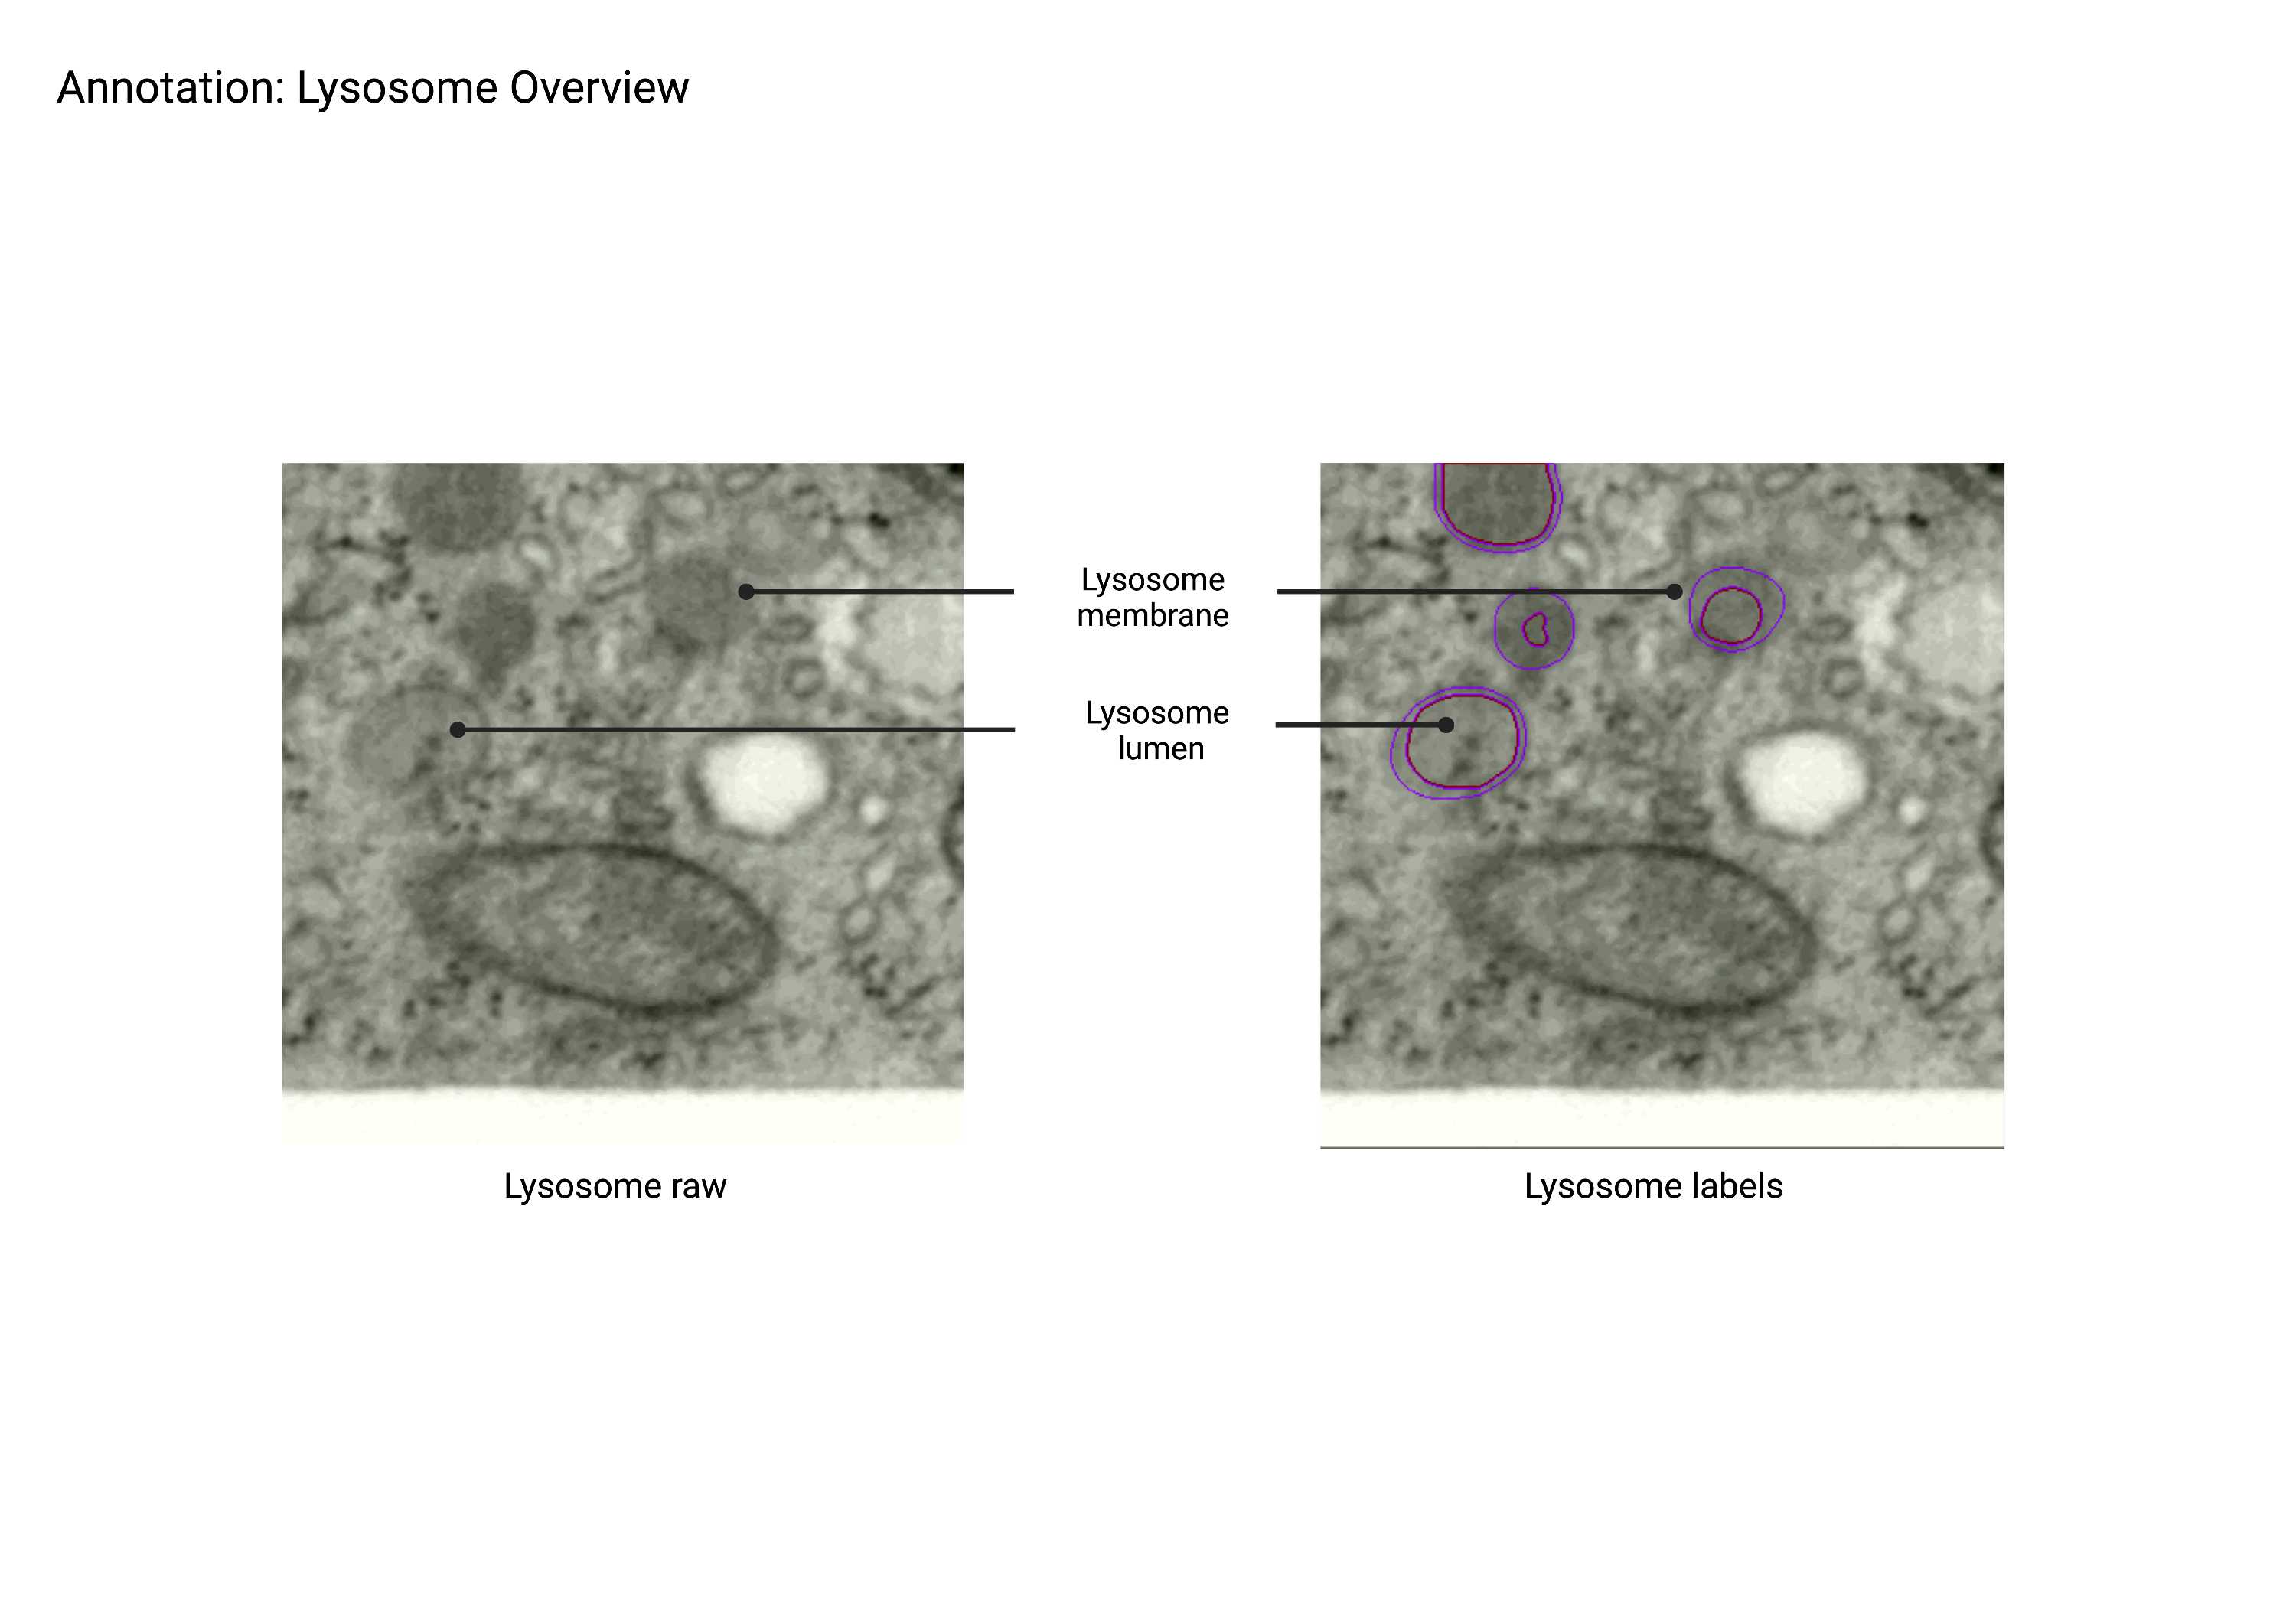
Lysosome
Summary
- Spherical, dark lumen organelles that constitute the late endosomal network. Lysosomes can have multiple membranes; the lysosome class also includes autophagosomes, multi-vascular bodies (MVBs), endosomes, and peroxisomes as EM staining alone is not sufficient for differentiation.
Description
- Dark lumen “round’ organelles
- Can have multiple membranes
- The lysosome class can also include MVBs, autophagosomes, endosomal network, peroxisomes, and lysosomes.
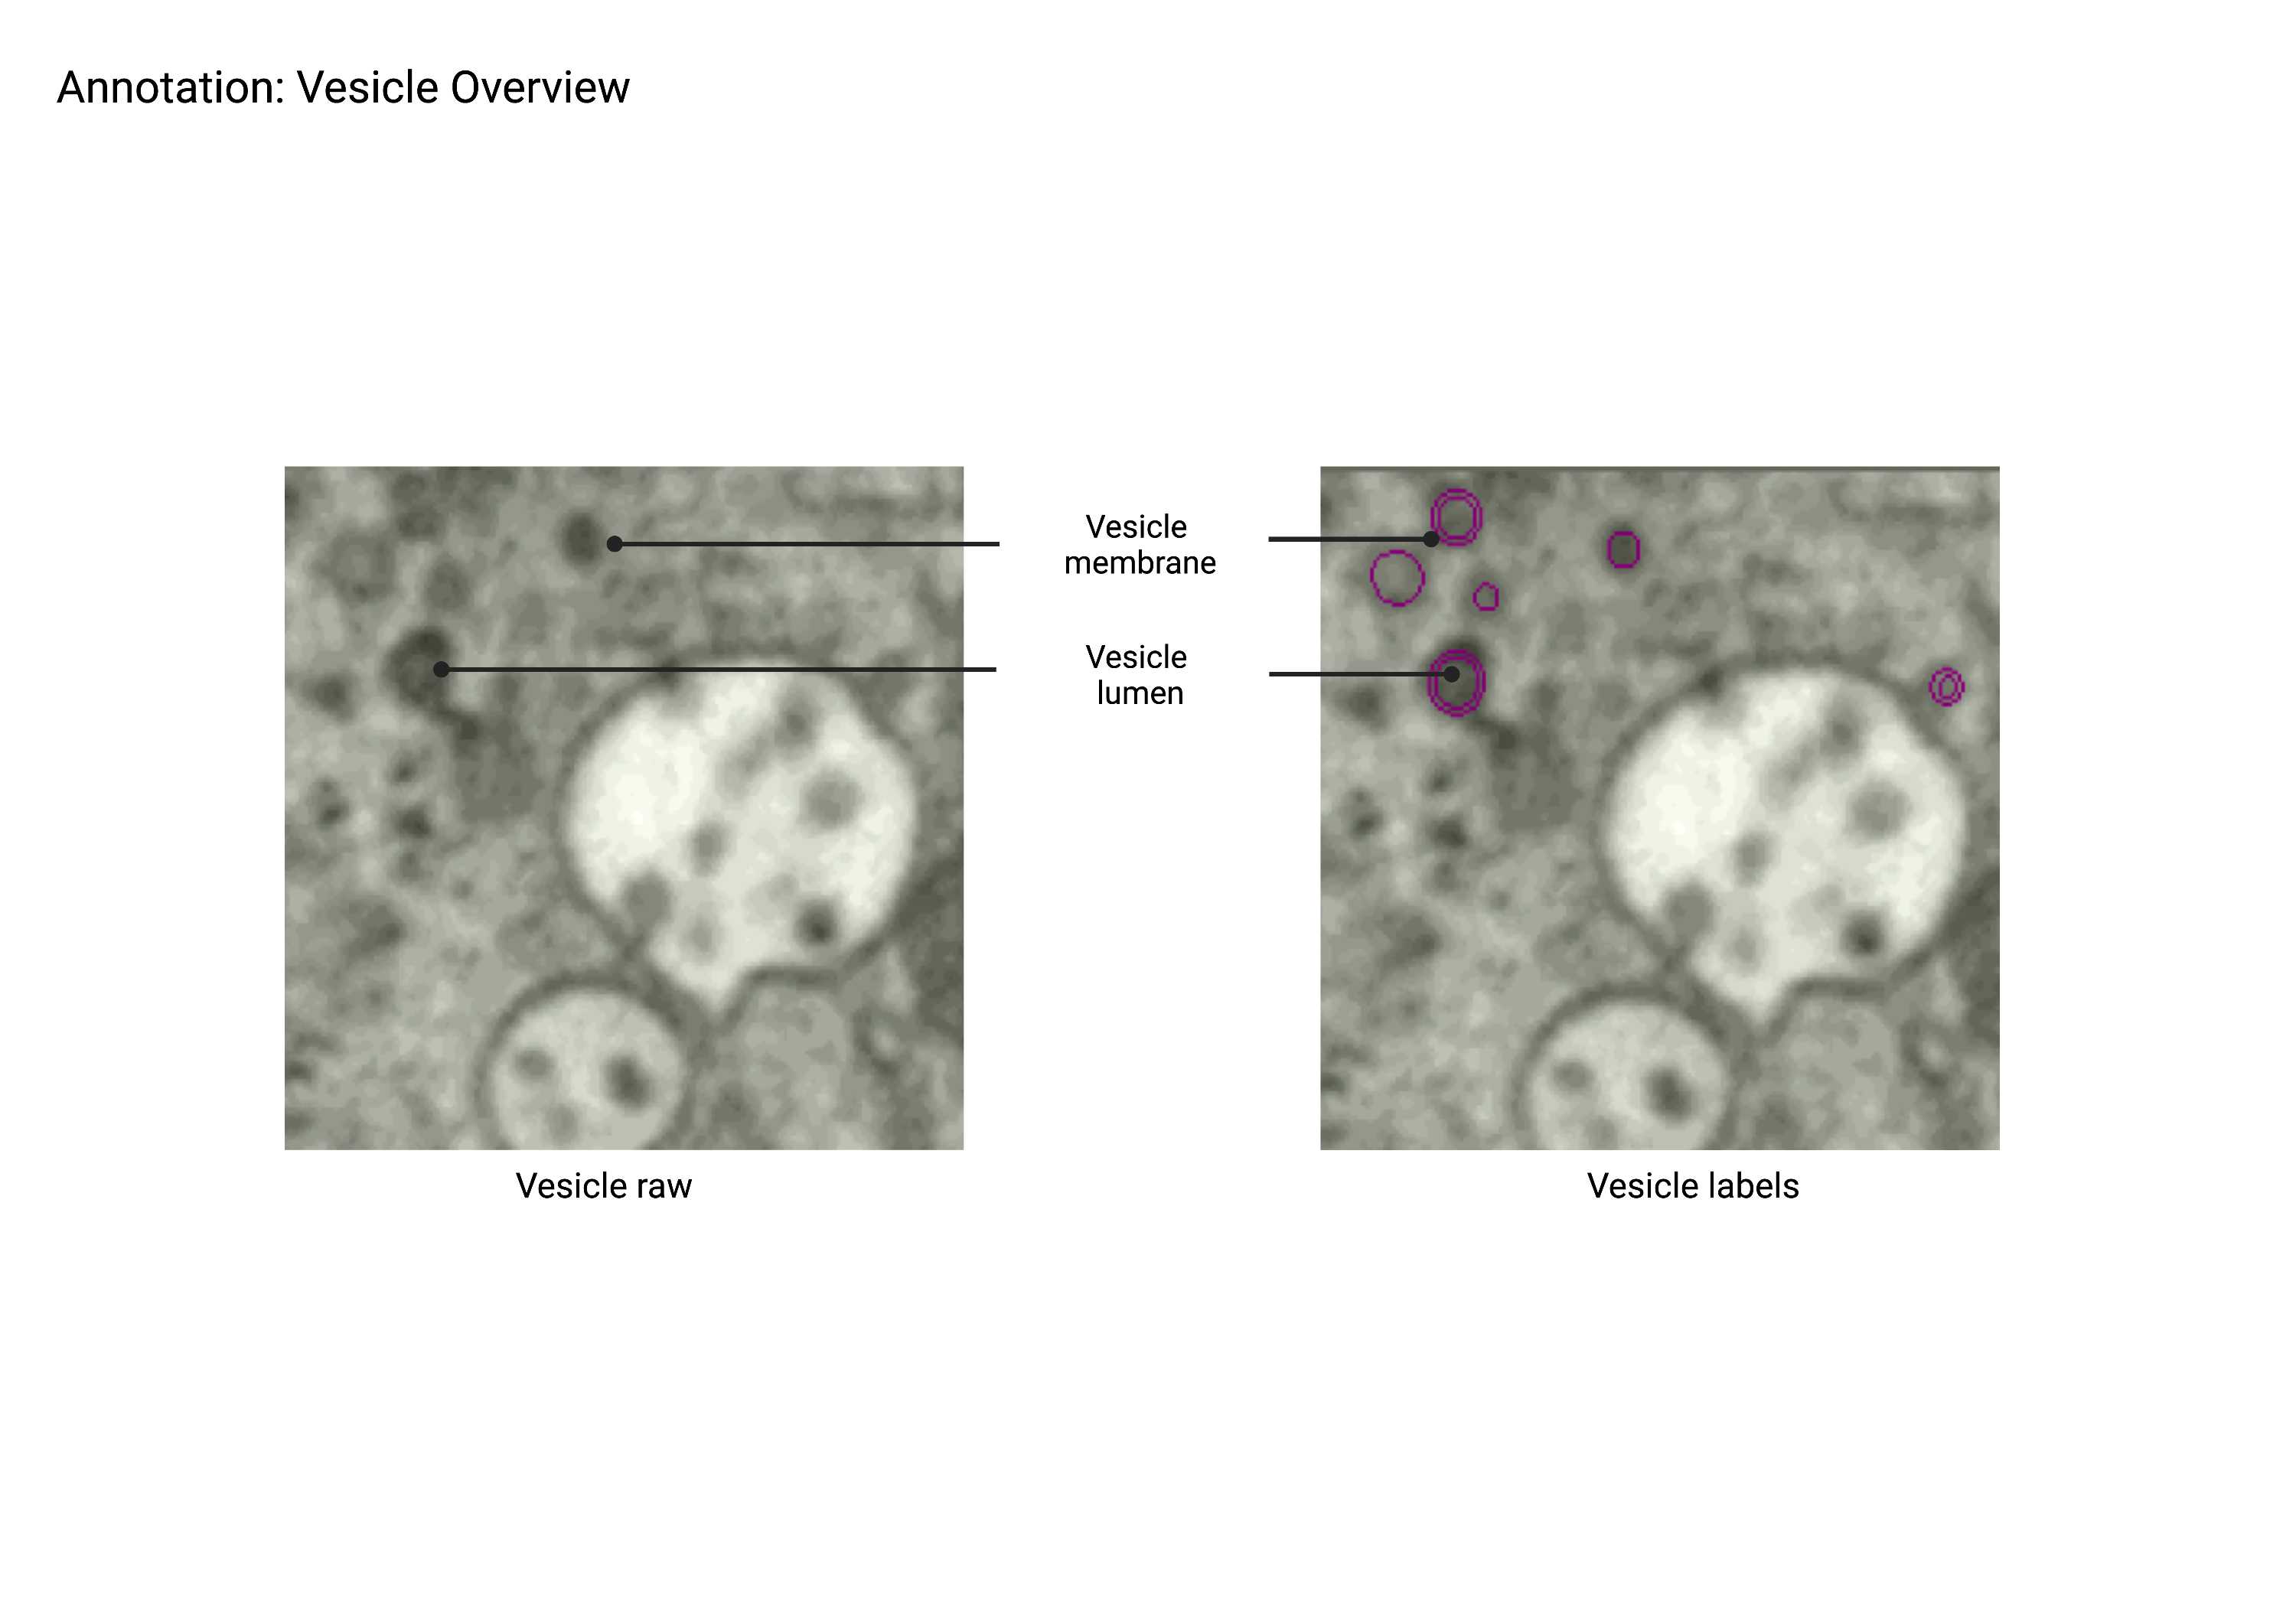
Vesicle
Summary
- Small, spherical organelles less than 100 nm in diameter with lumen varying in color depending on protein content. Vesicles are often found in clusters surrounding Golgi and ER.
Description
- Small round objects that are less than 100 nm in diameter.
Recommended Annotation Steps
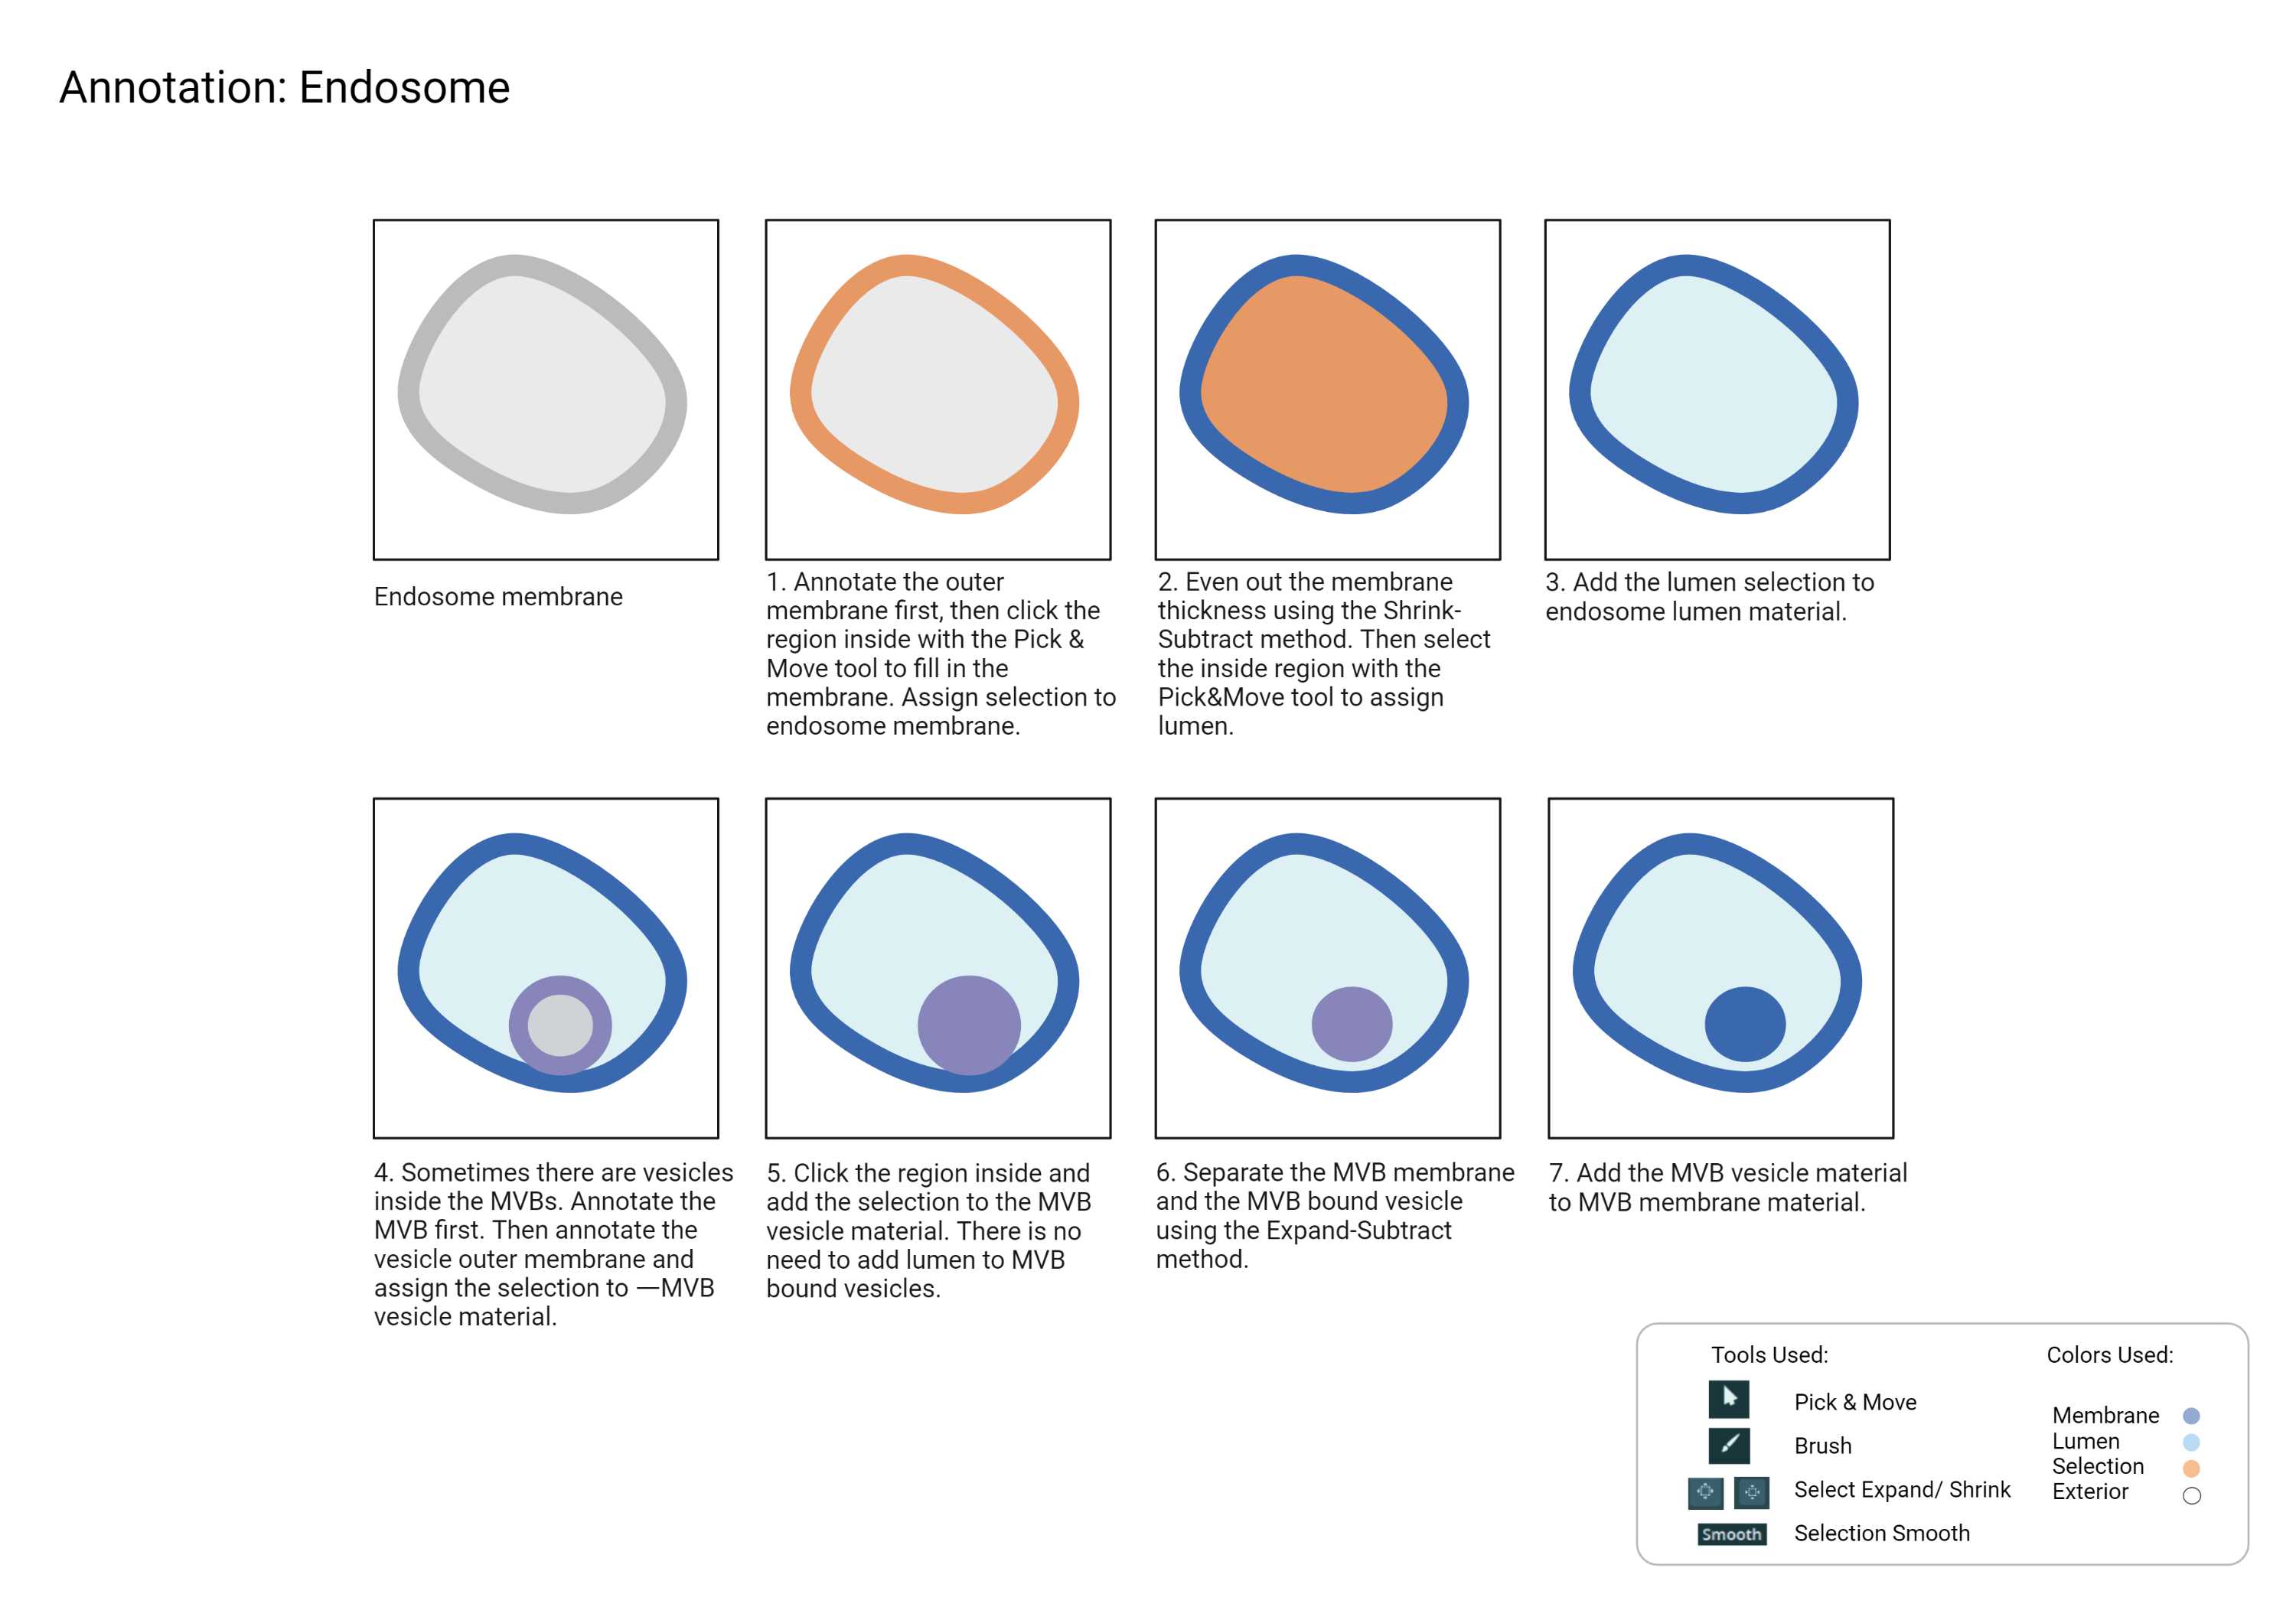
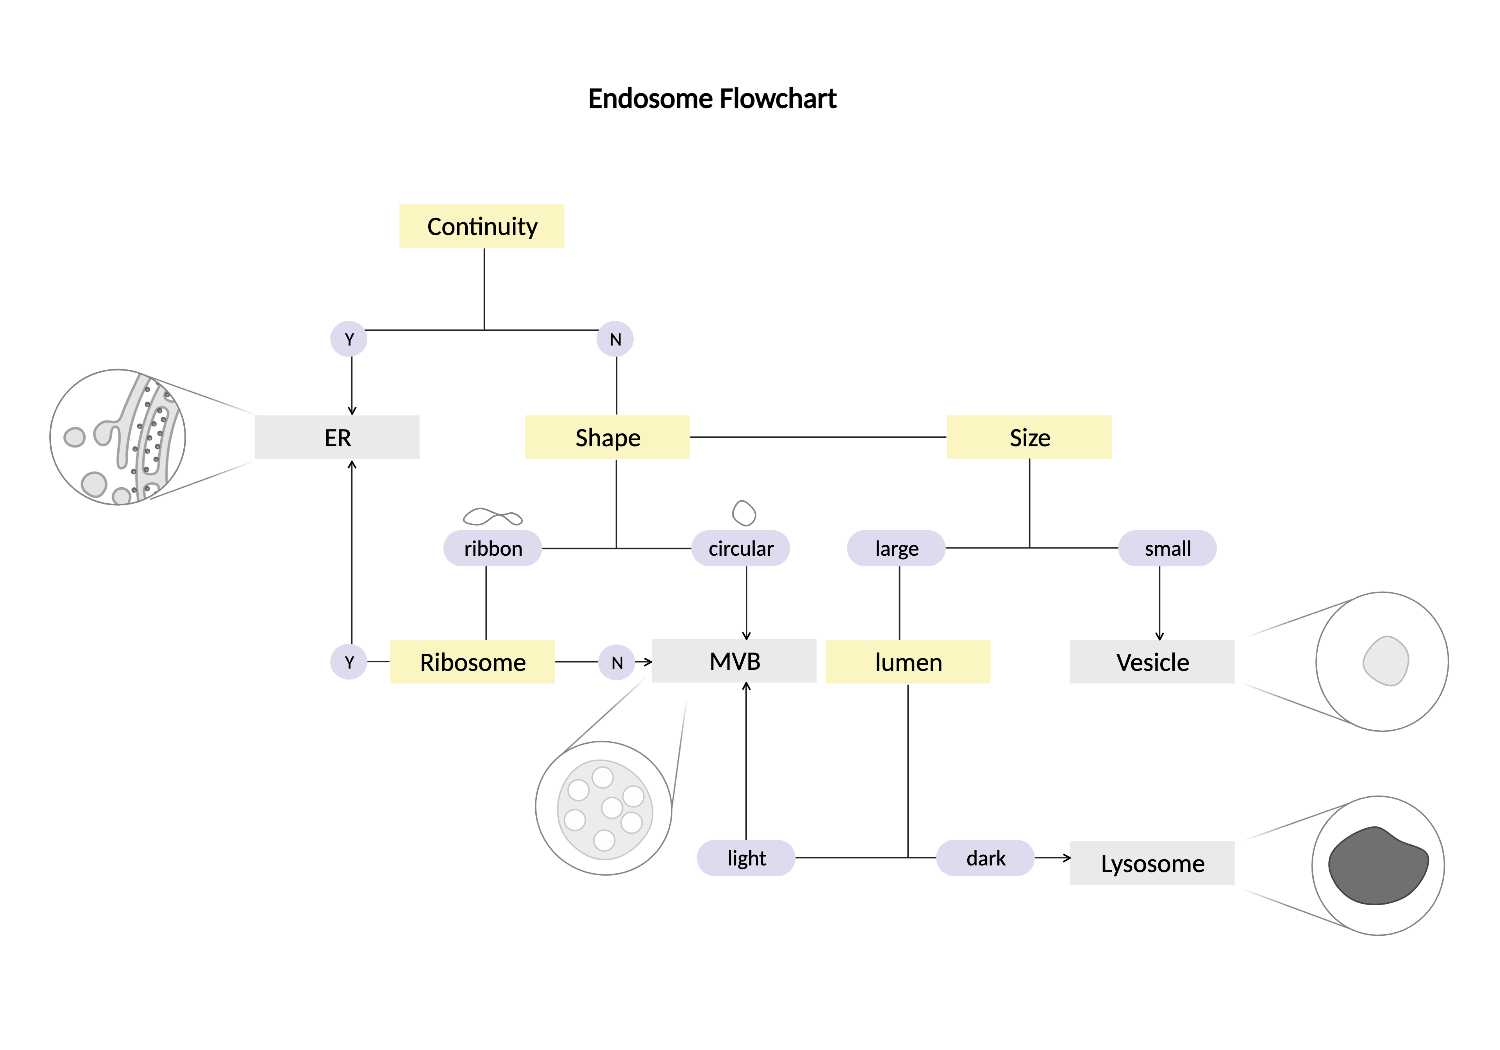
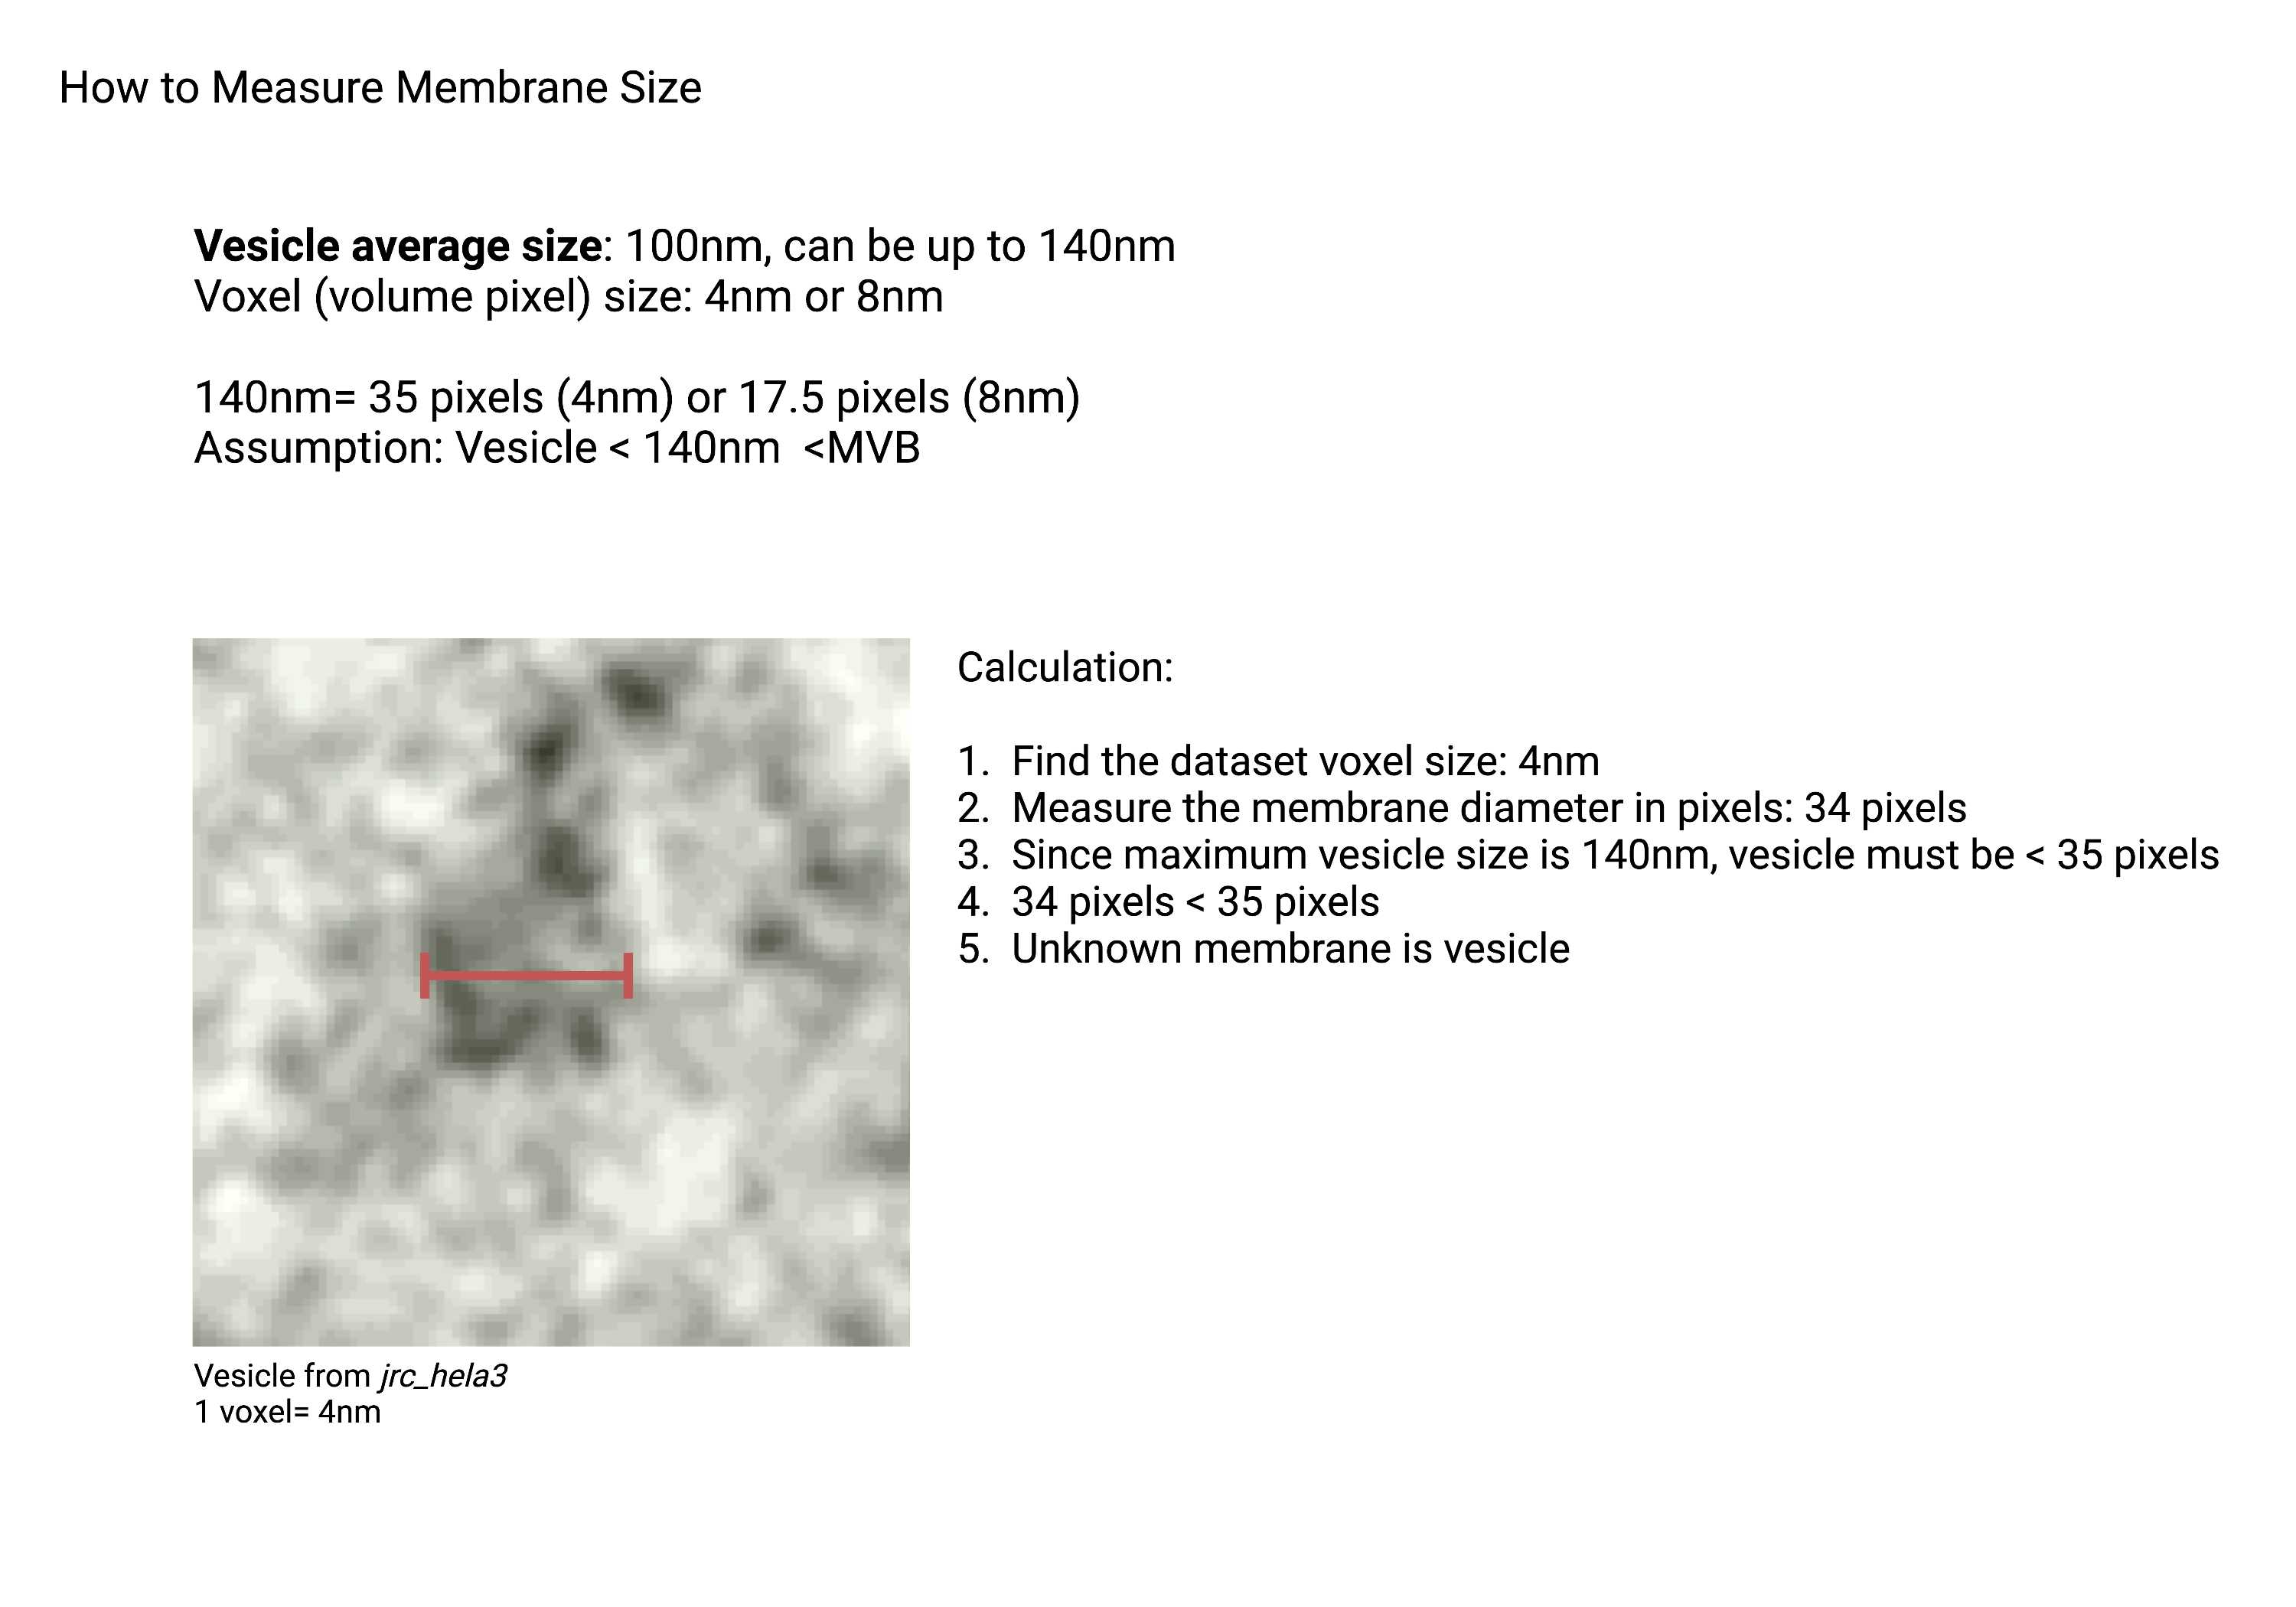
- Identifying the endosomes can be tricky when there are multiple similar-sized membranes. Follow the flow chart from Fig 8.1 and the checklist below to use the process of elimination to identify the unknown membrane.
- Use other organelles in the crop to get a sense of the magnification of the raw data.
- Observe how the organelle looks outside of the mask.
- Label what you are most confident with first, then use that as an indicator to label the remaining organelles.
- Count the number of pixels and calculate the membrane diameter size to identify the unknown organelles.
Checklist
- All membranes are annotated, including small ones on the crop edges.
- All membranes are correctly labeled.
Nucleus
Nucleus (NE, NE pores, Chromatins)
Nuclear Envelope (NE)
Summary
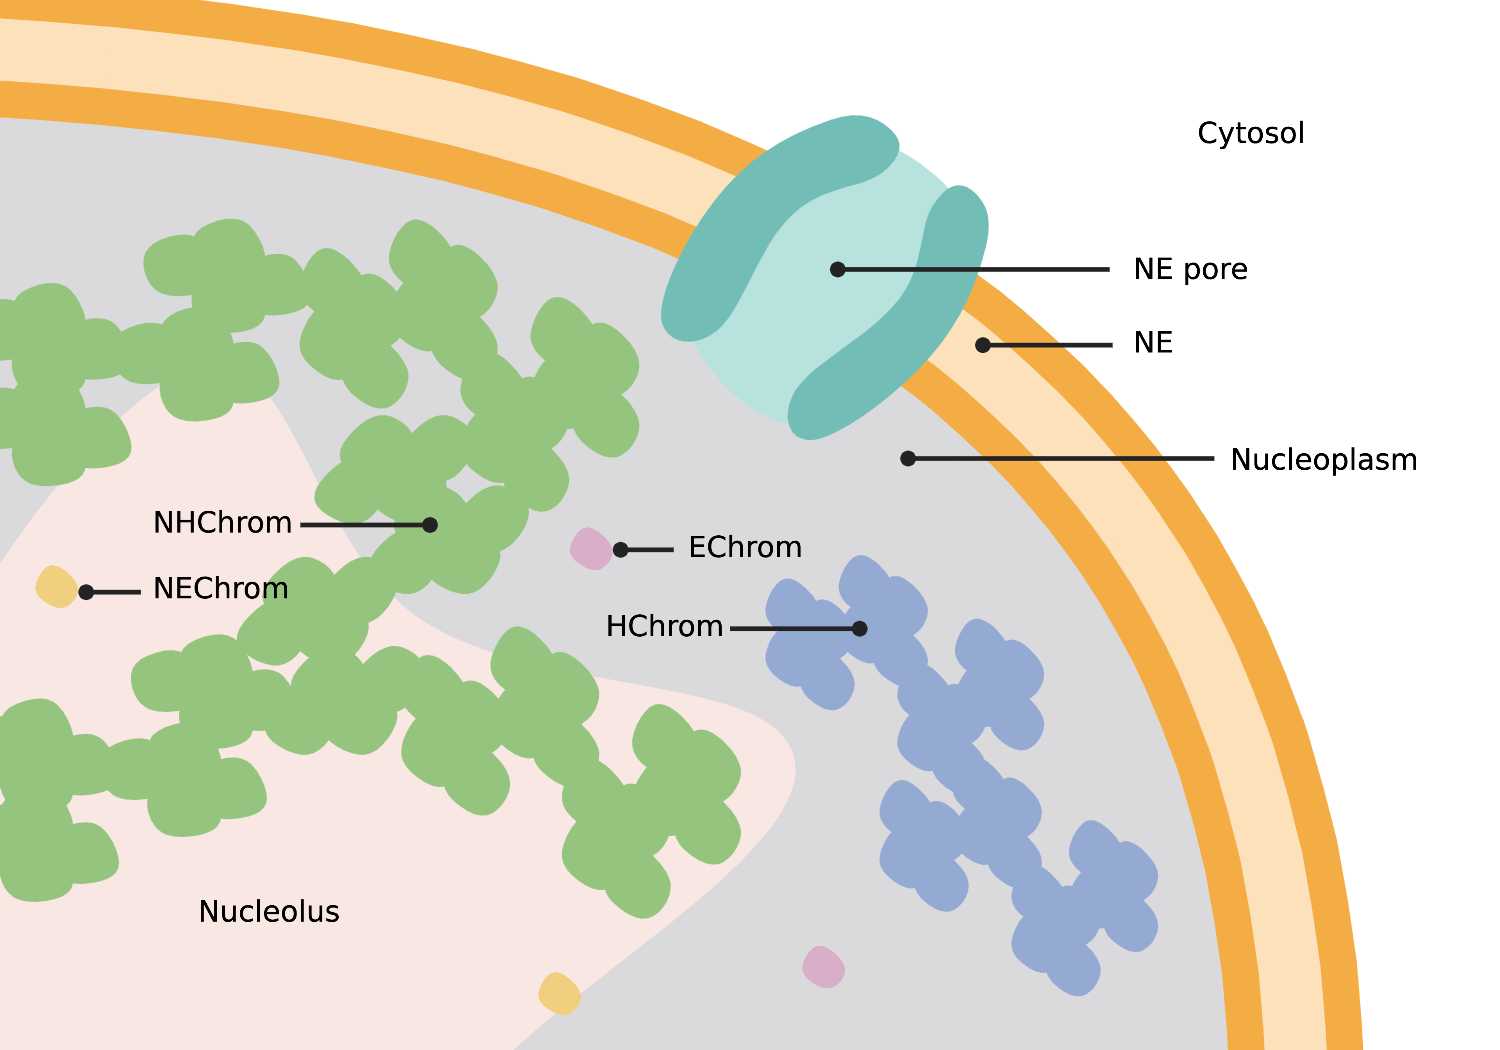
- An extensive membrane-like structure identified by the presence of two lipid bilayers often studded with ribosomes. The nuclear envelope connects back to itself and is continuous with ER networks. The double membrane structure is perforated with nuclear pores (NP) and establishes a boundary between chromatin (Chrom) and the cytosol.
Description
- Continuous with ER.
- Studded with ribosomes.
- Perforated with nuclear pores.
- Surrounds chromatin.
Nuclear Pores (NE pore in + NE pore out)
Summary
- Circular, 120 nm pores in the nuclear envelope. When viewing a cross-section of the nucleus, nuclear pores appear as breaks or gaps in envelope connectivity. Nuclear pores span both bilayers of the nuclear envelope (NE).
Description
- Symmetrically round pore through the NE with a size of ~120nm.
Nucleolus
Summary
- A dark, dense spherical structure within the nucleus containing heterochromatin (NHChrom) and euchromatin (NEChrom).
Description
- Spherical region inside the nucleus.
- Darker stained (denser) than rest of nucleus.
Heterochromatin (Hchrom)
Summary
- Dark clusters of chromatin within the nucleus. Heterochromatin stain is darker and more compact than euchromatin. Nucleolus heterochromatin (NHChrom) is not associated with or connected to heterochromatin (HChrom) outside the nucleolus.
Description
- Clusters of chromatin within the nucleus.
- Not connected to chromatin associated with the nucleolus.
Euchromatin (Echrom)
Summary
- Light, single chromatin within the nucleus. Euchromatin stain is lighter and less compact than heterochromatin. Nucleolus euchromatin (NEChrom) is not associated with or connected to euchromatin (EChrom) outside the nucleolus.
Description
- Single chromatin within the nucleus.
- Outside of nucleolus region.
Recommended Annotation Steps
- There are multiple membranes included within the NE membrane.
- To fix one membrane without affecting others, keep them under separate label fields until the end.
- Check whether the material is locked/unlocked when merging them onto one final label field.
Checklist
- Annotating each organelle in a different label field is recommended for easy modification. Follow this recommended order when merging multiple label field in the end: 1. NE membrane and lumen 2. Nucleoplasm 3. Chromatins 4. NE pores 5. Nucleolus.
- NE pores out are taller than the NE membrane.
- NE pore out sticks out above NE membrane in 3D viewer.
- The membrane transition between the frames is "natural." All membrane should gradually move around the plane without any sudden or abrupt movement.
- All chromatins are annotated.
Microtubules
Microtubules
Summary
- Cylindrical, cytoskeletal polymers characterized by restricted curvature and a 25nm diameter. Microtubules often run parallel to each other, do not branch, and may appear to pierce through other organelles, especially ER.
Description
- Cytoskeletal element.
- Restricted curvature.
- No branching.
- Cylindrical shape.
- Can pierce through other organelles ex. ER.
- 25nm in diameter.
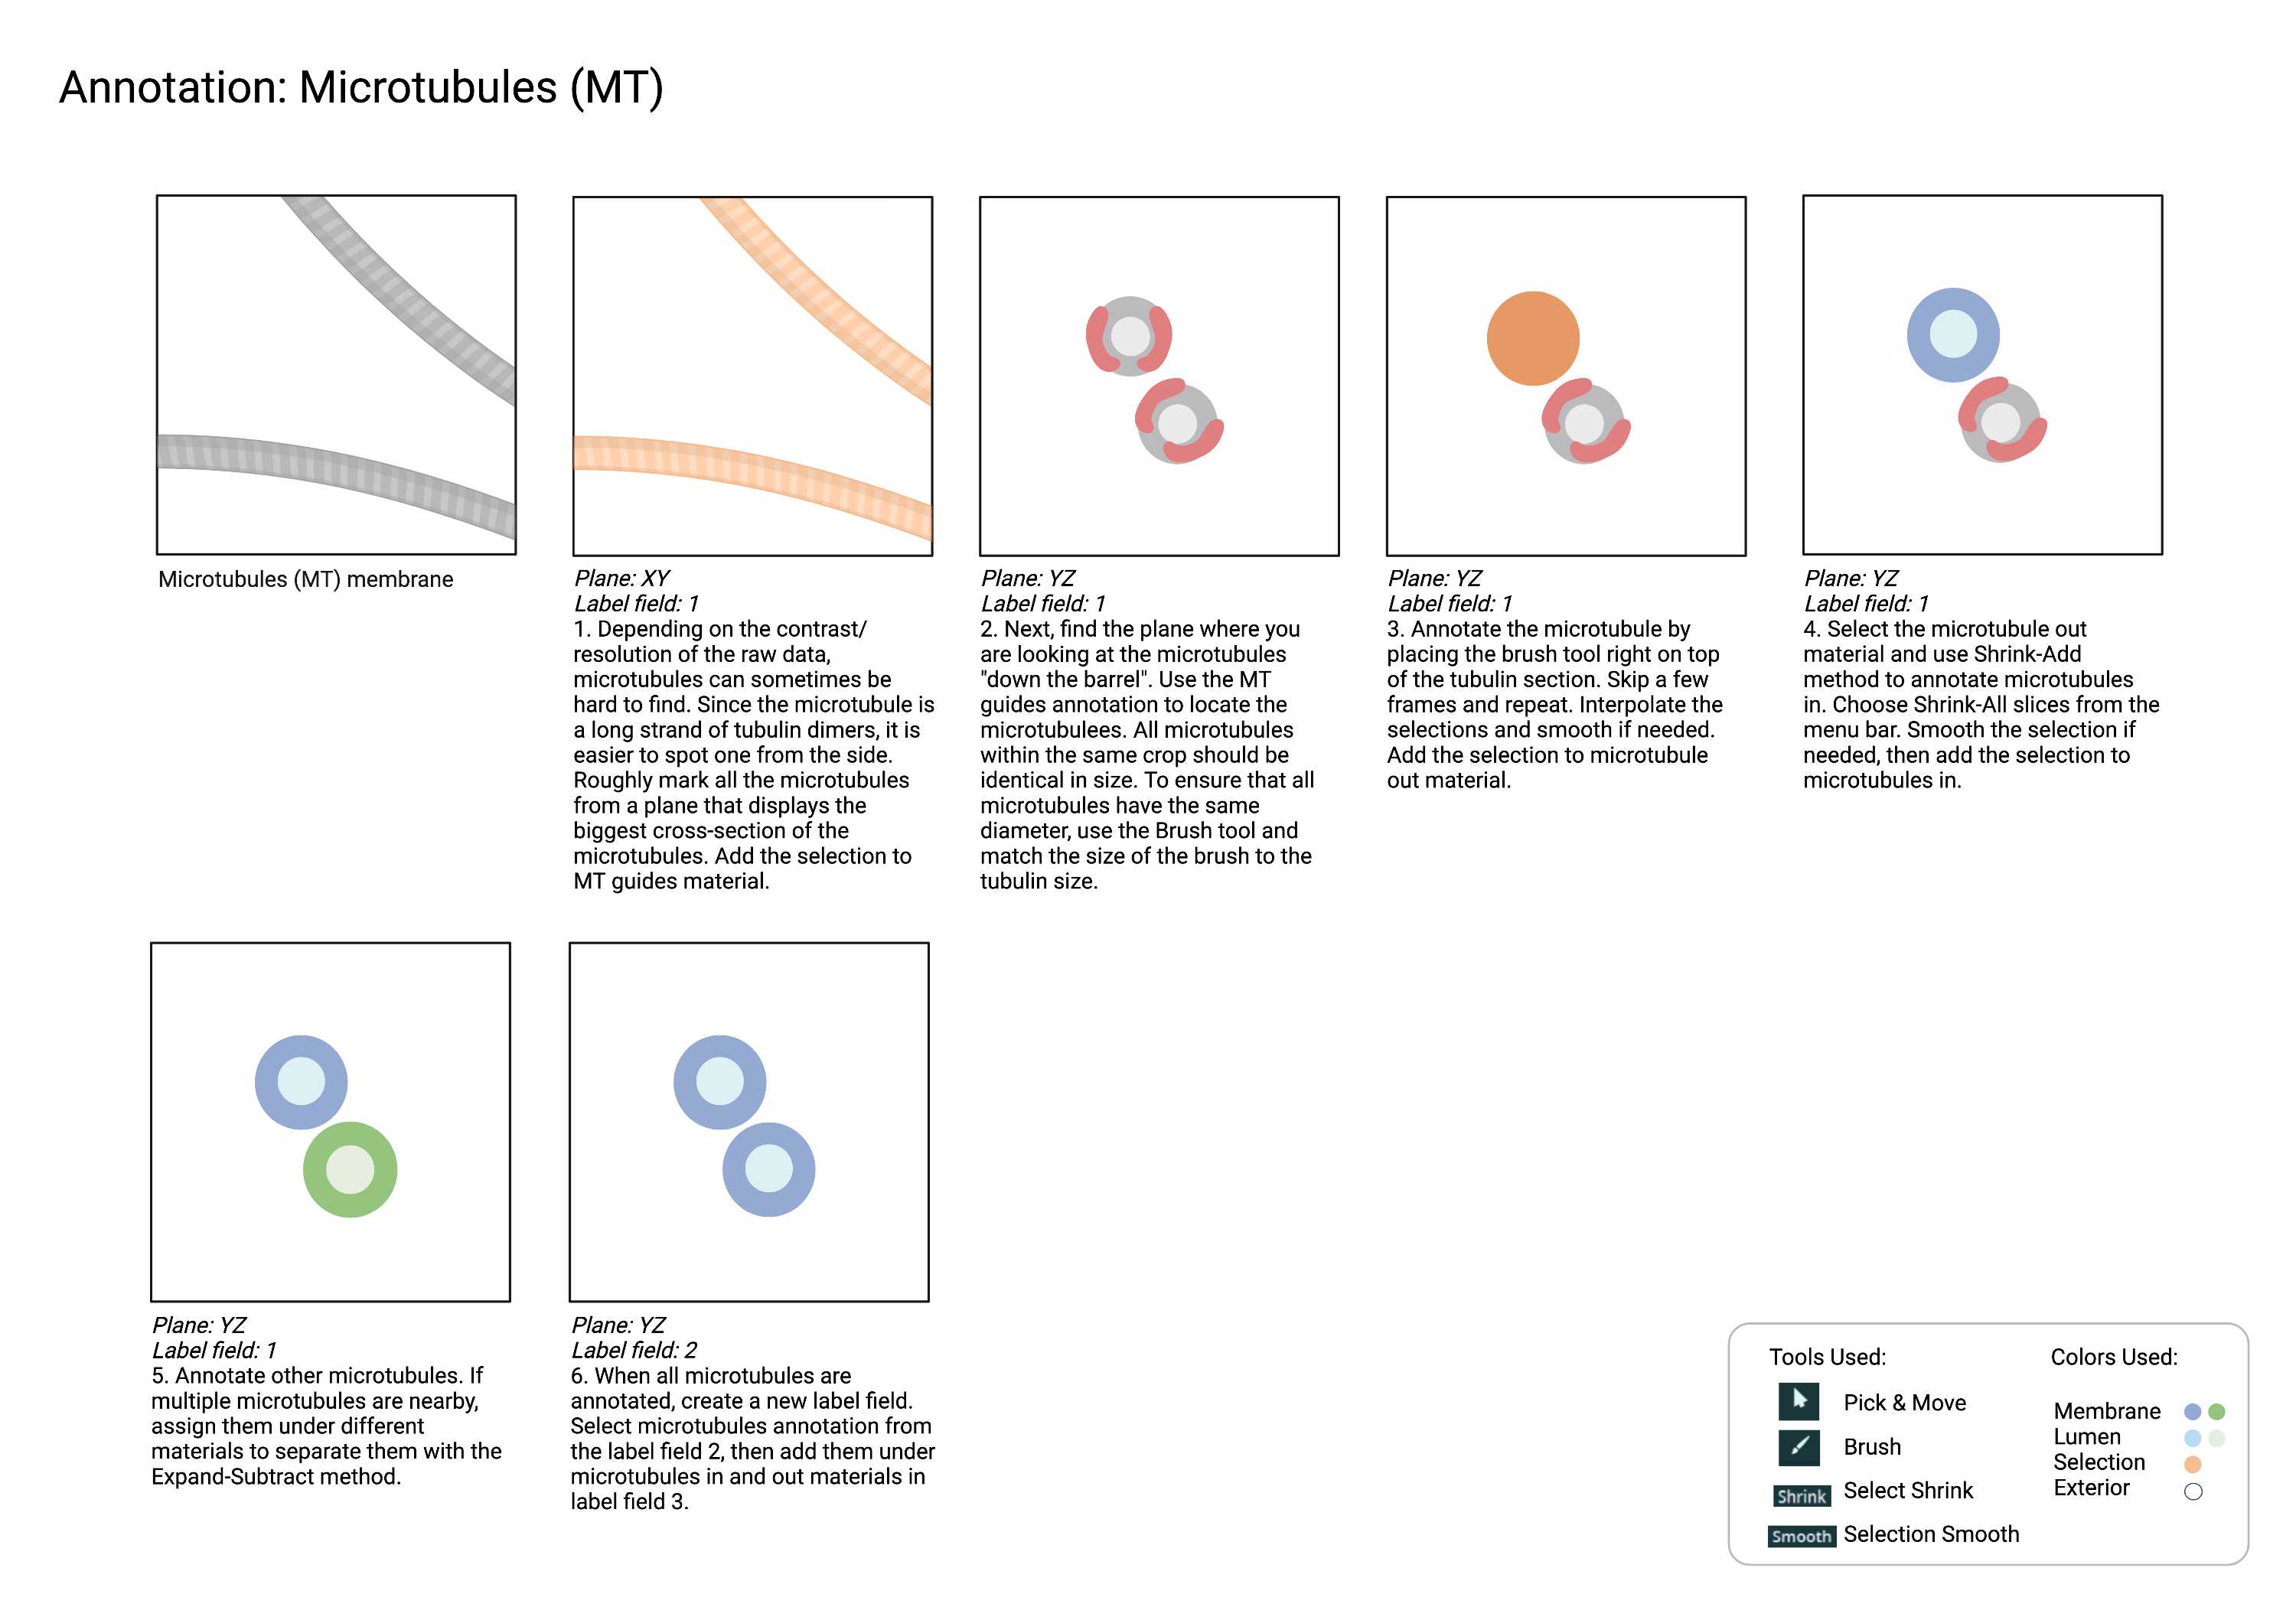
Recommended Annotation Steps
Checklist
- The microtubule is straight and continuous. It can have a subtle curve, but should not be crooked.
- Microtubules in are enclosed by microtubules out.
- All microtubules out within the crop should be identical in size.
- All microtubules in within the crop should be identical in size.
- No actins are mislabelled as microtubules. Actins form clusters, whereas microtubules do not. Microtubules also "travel" through the plane without shifting, but the actin clusters do not have a uniform trajectory.
Lipid Droplets
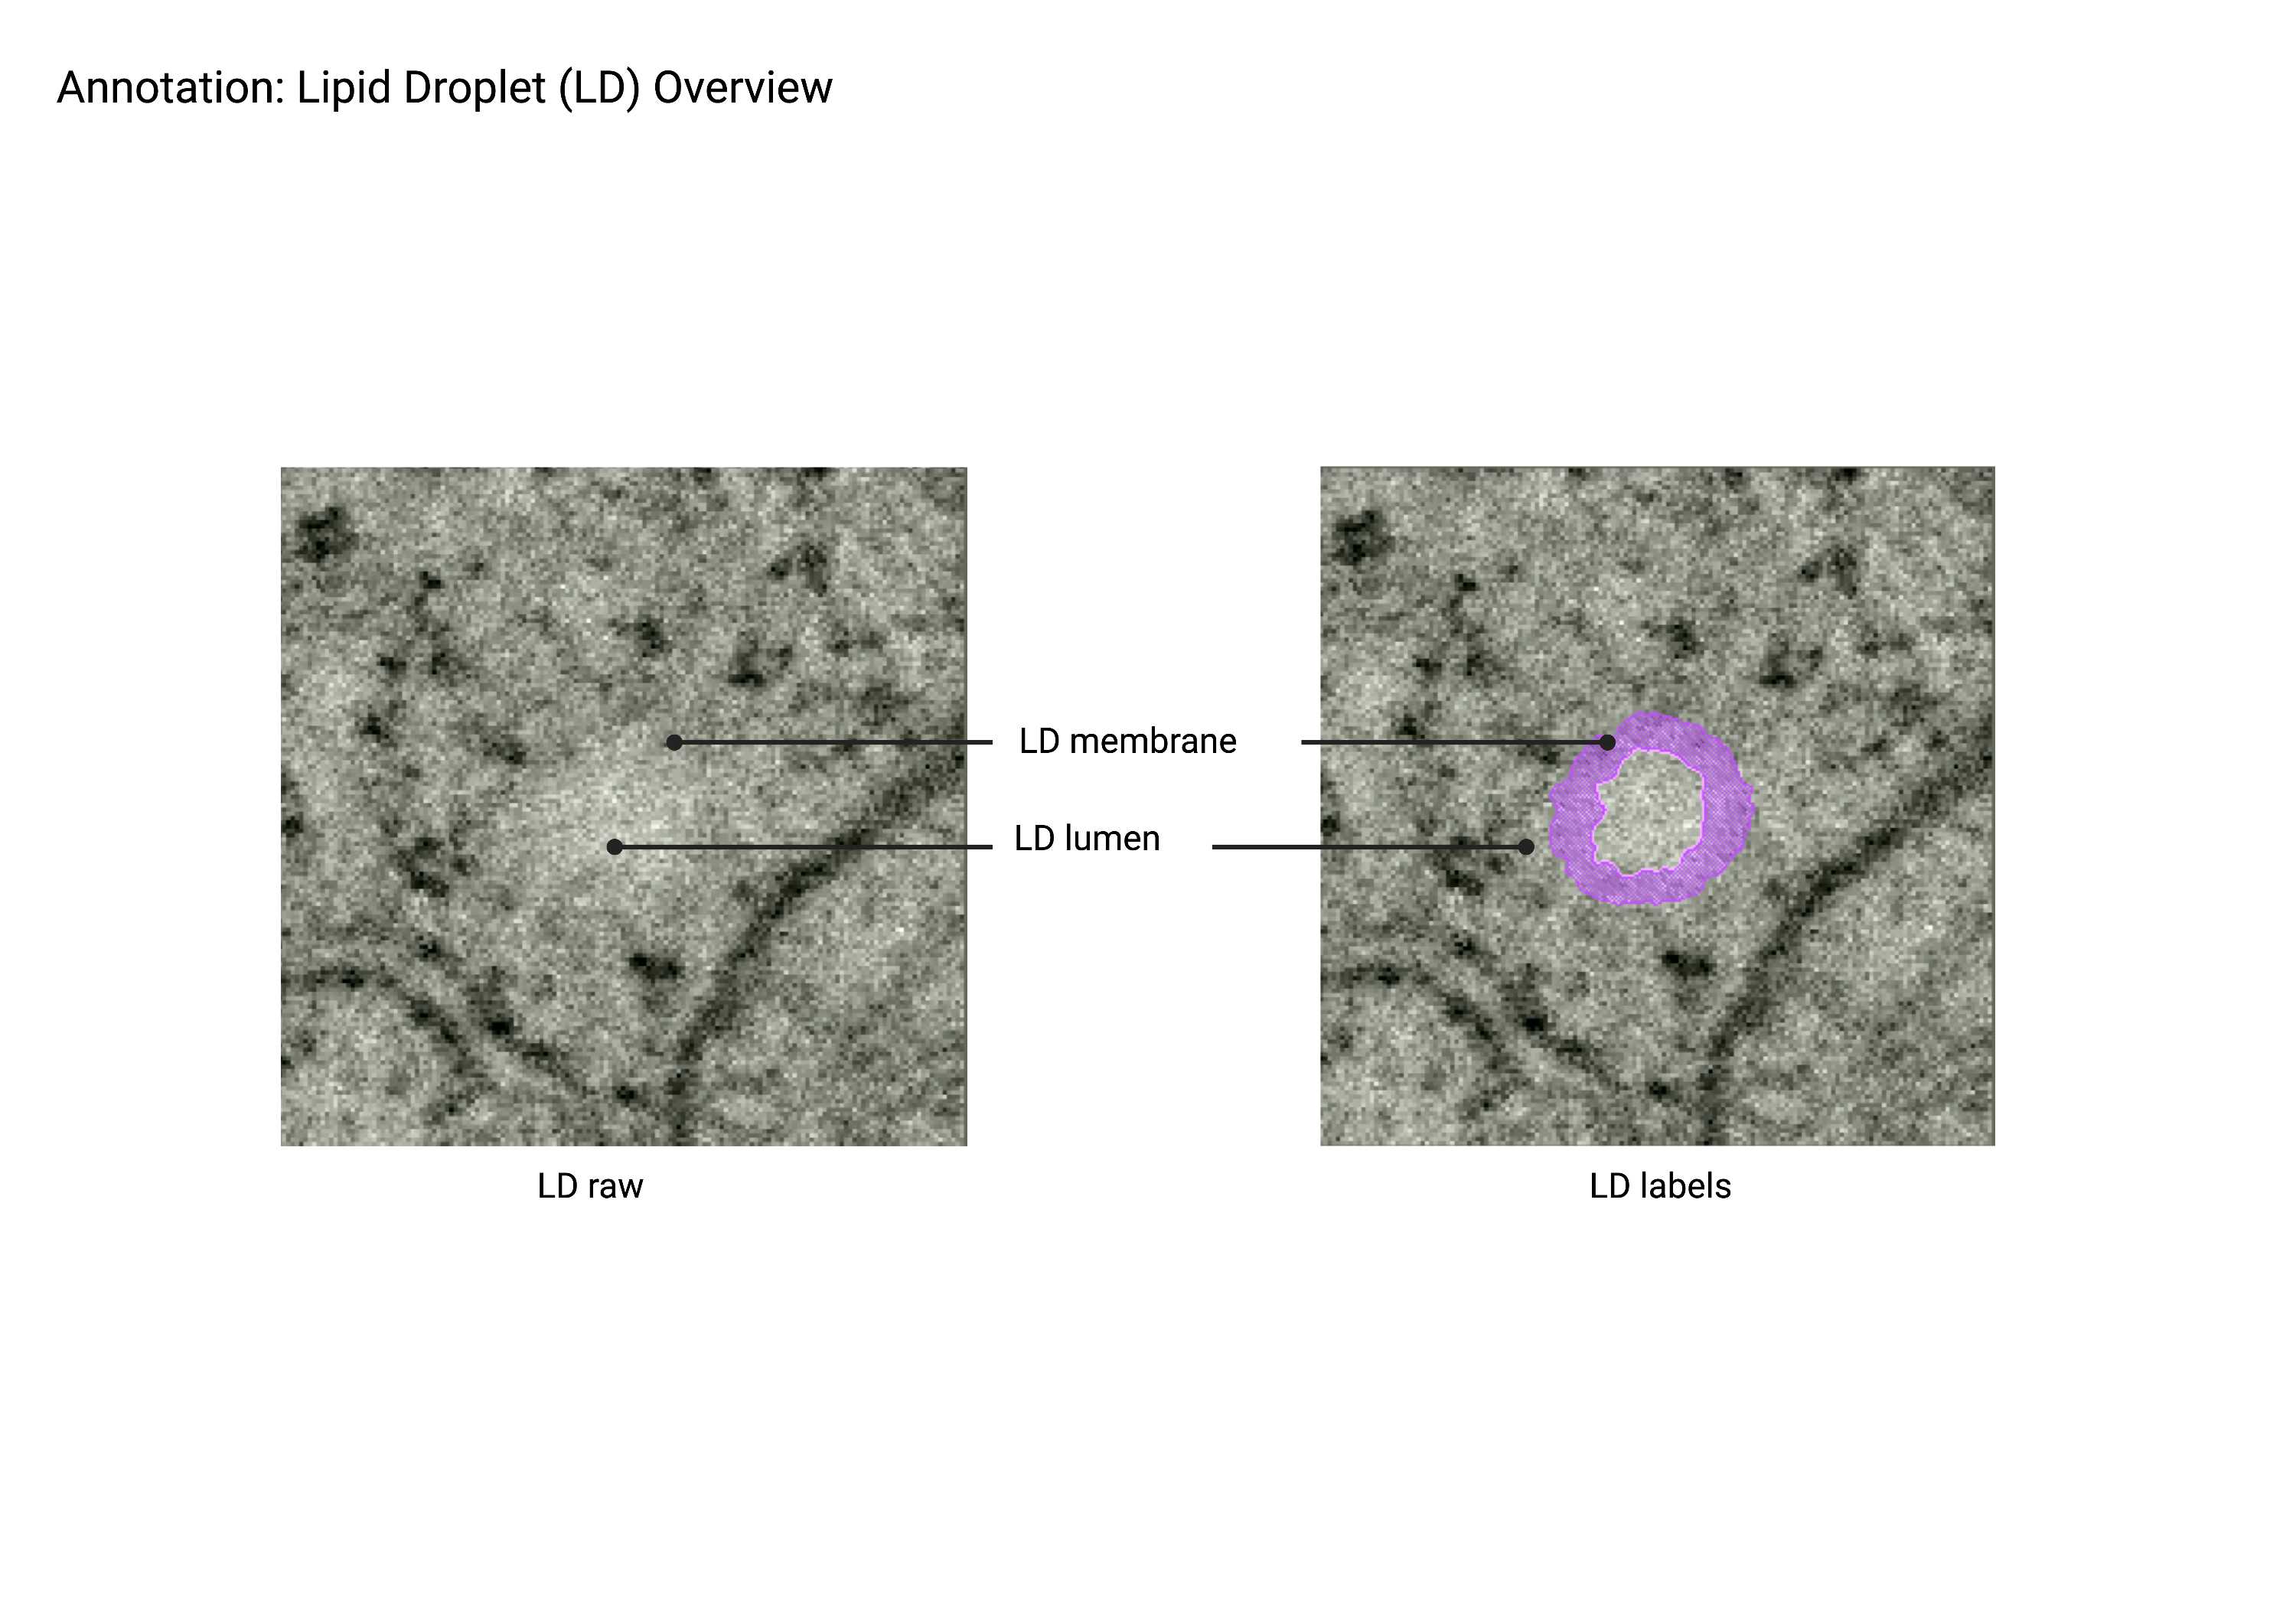
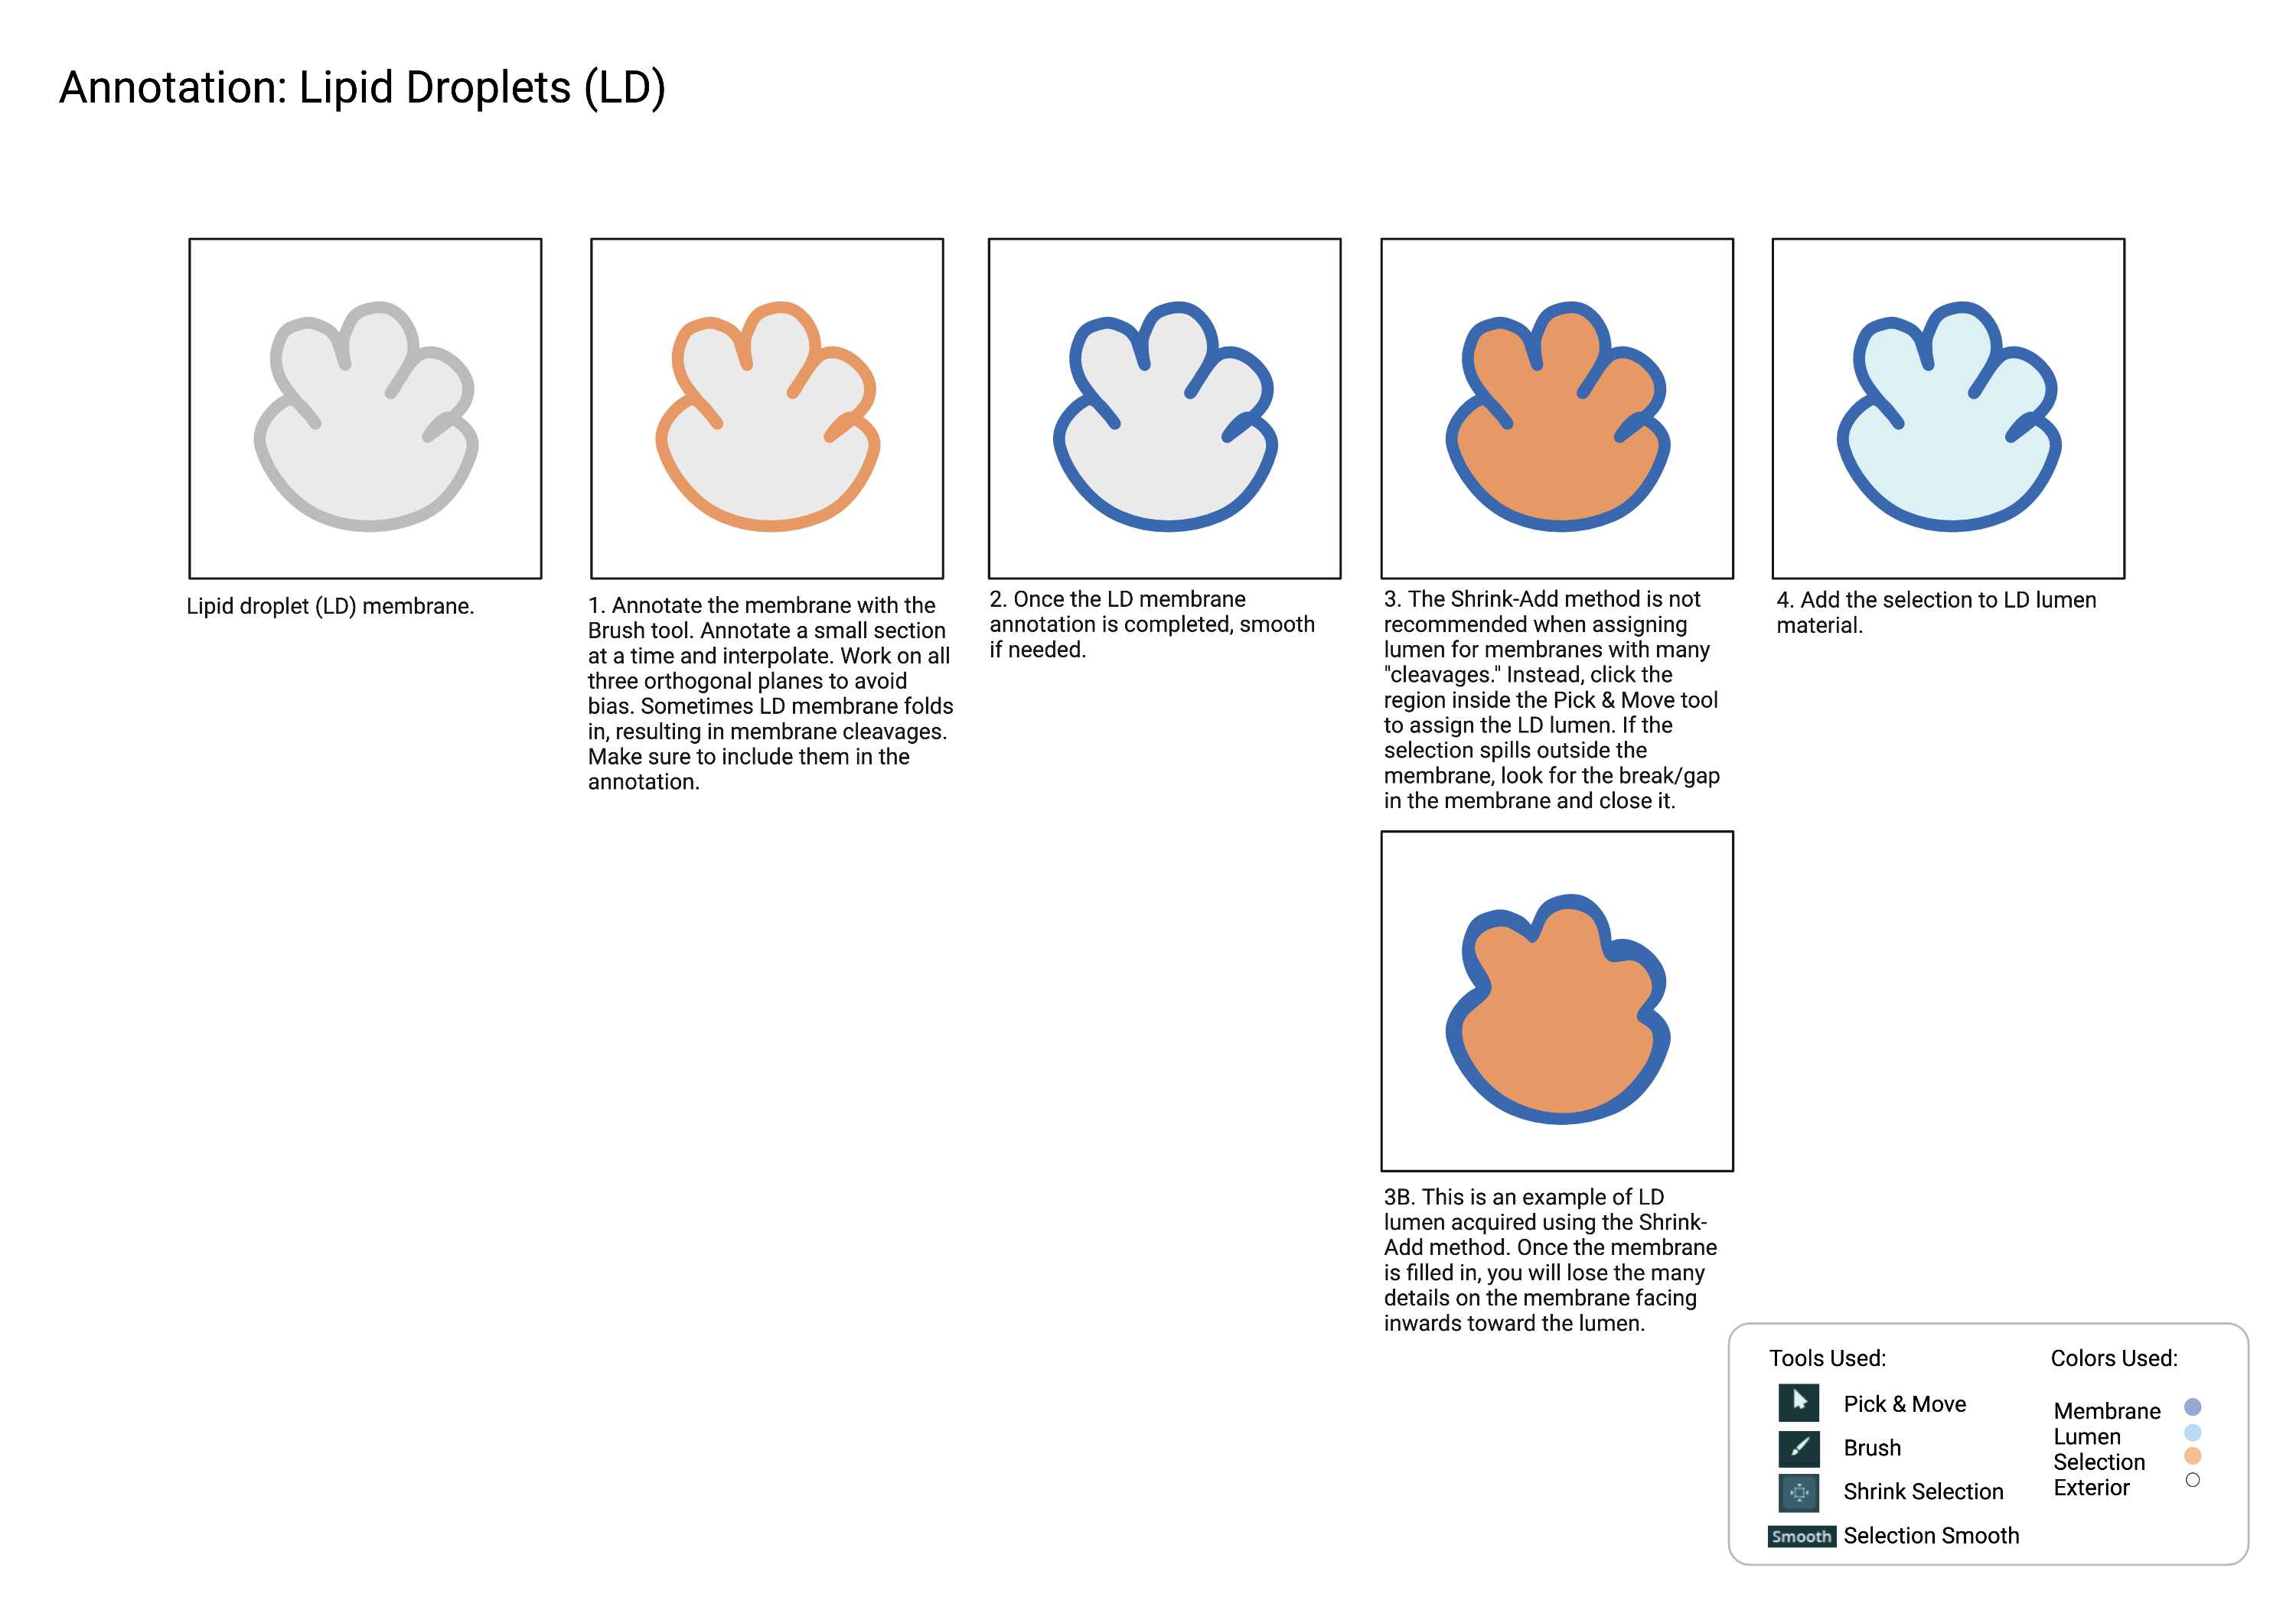
Lipid droplets (LD)
Summary
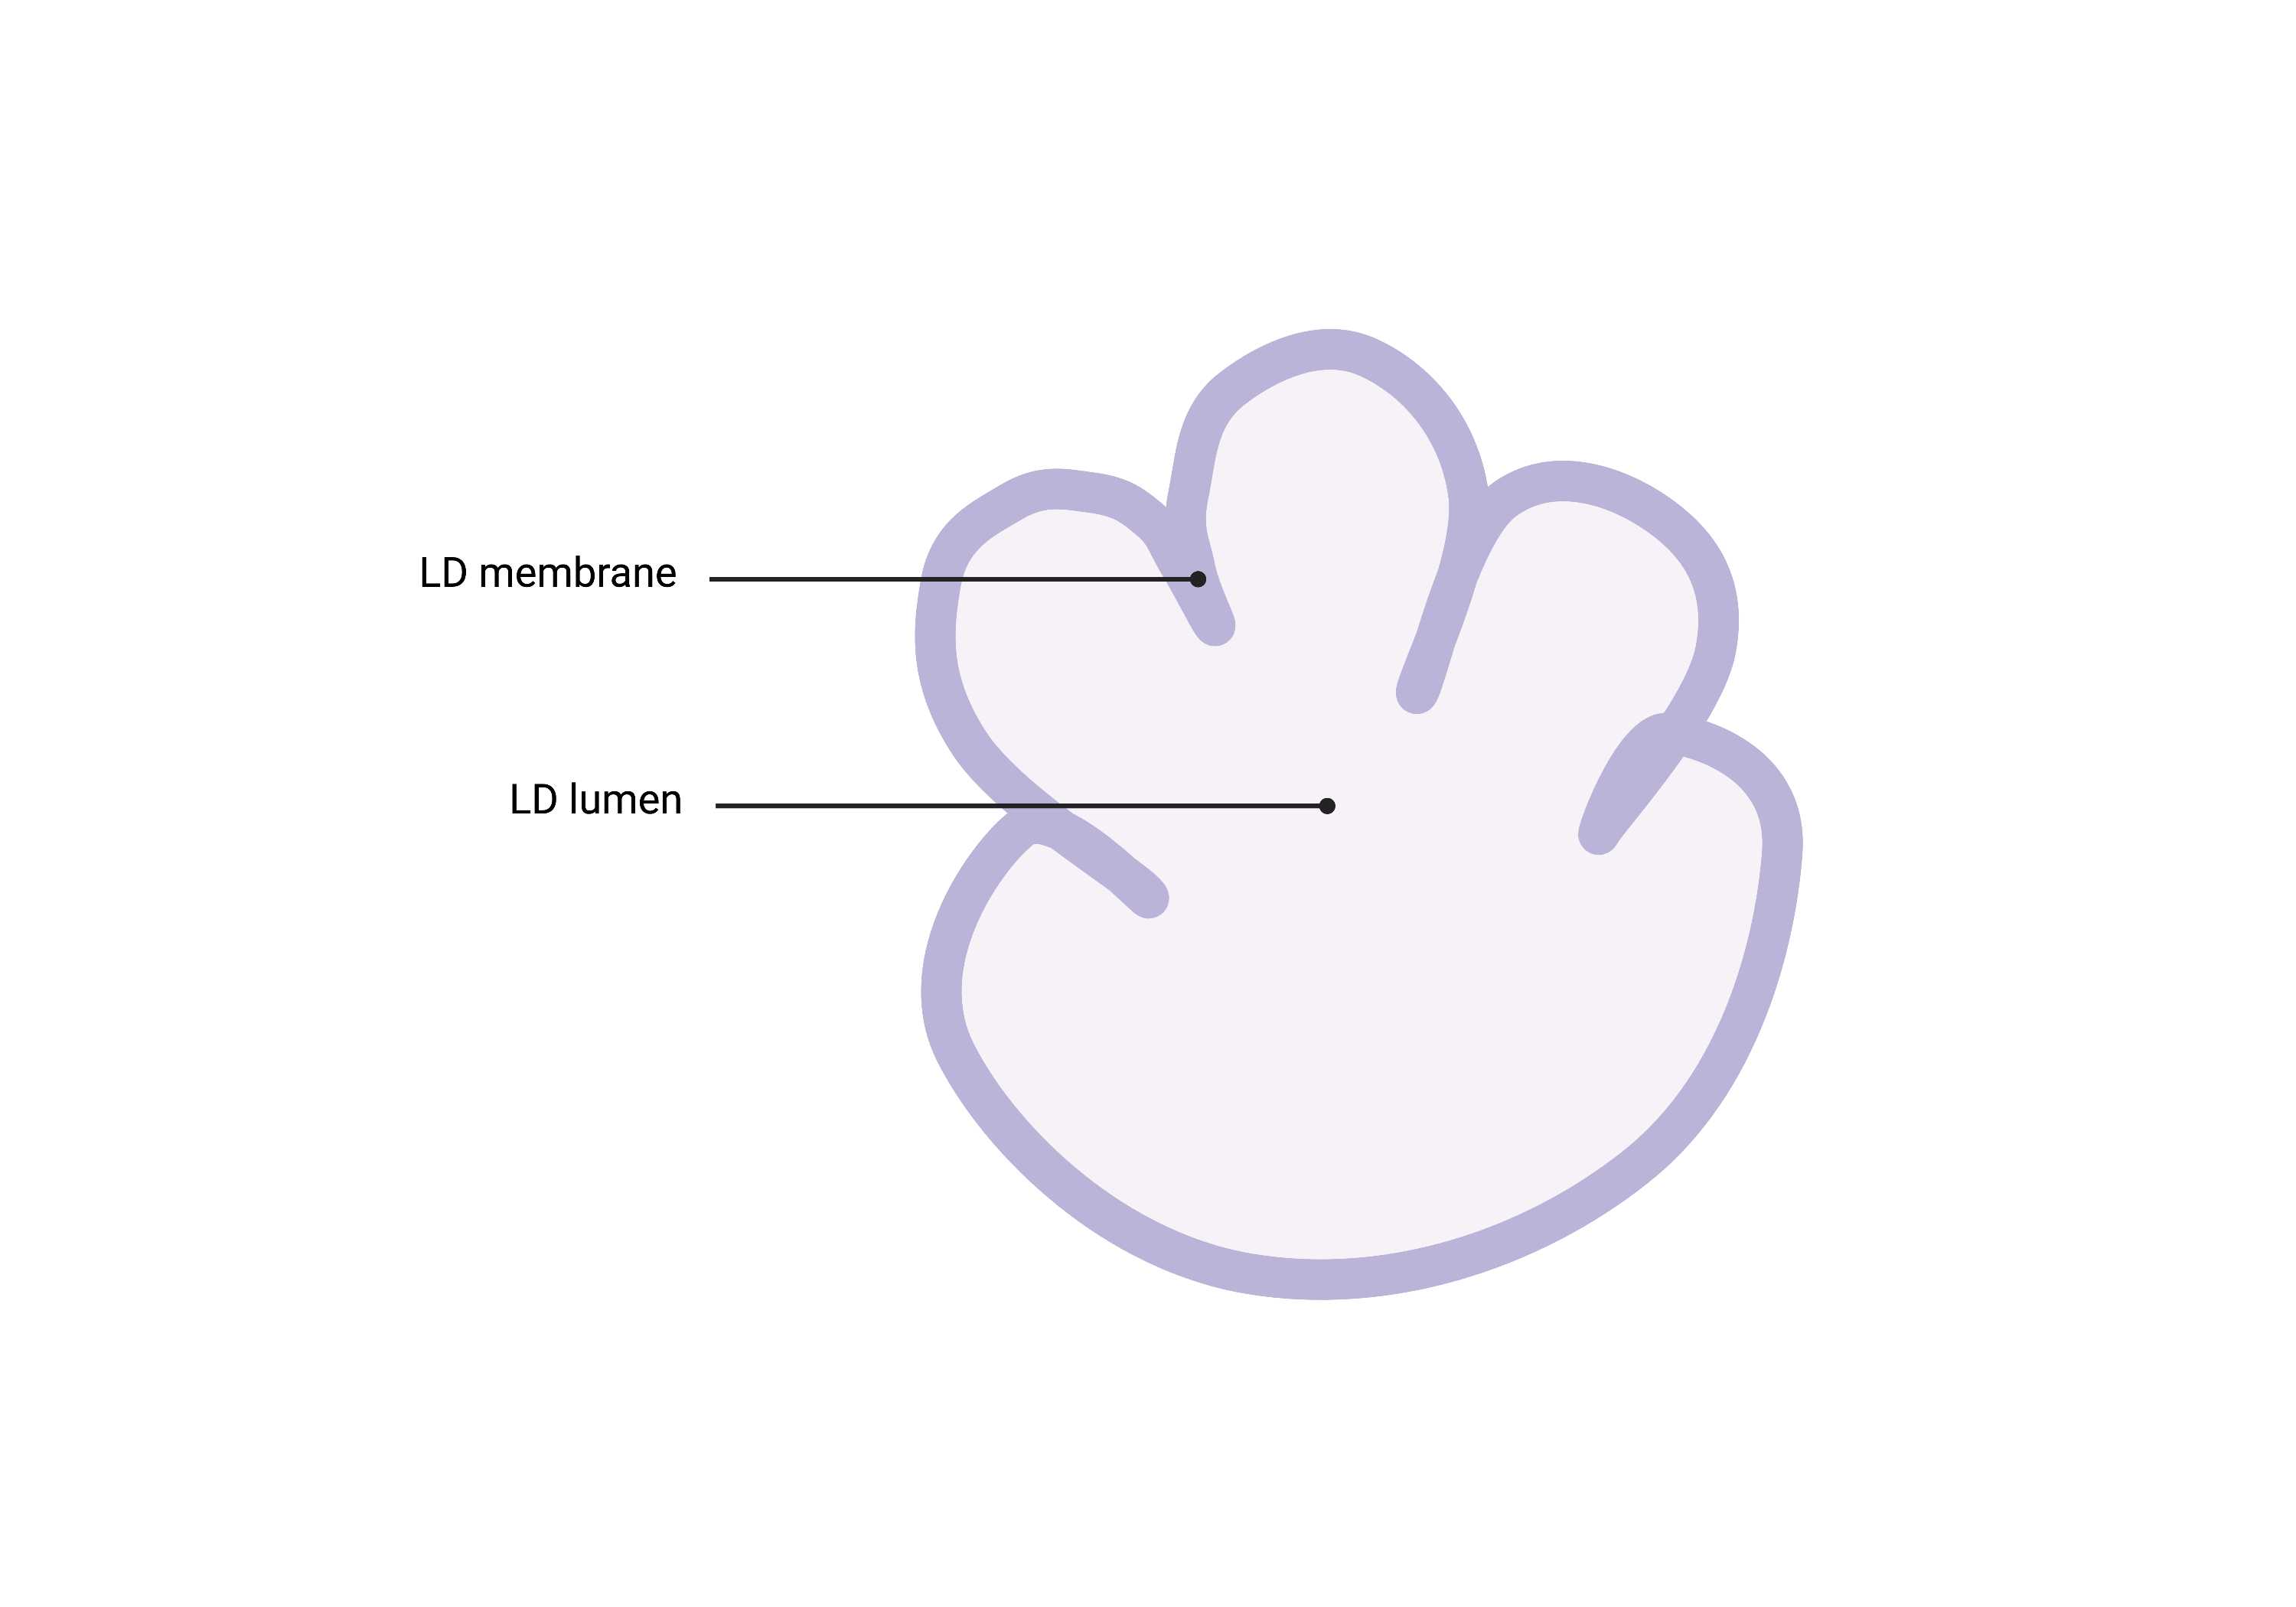
- Spherical organelles enclosed by a lipid monolayer and characterized by a shriveled, ‘lumpy’ morphology due to general staining. Lipid droplets (LD) are generally lighter than surrounding cytosol and have subtle membrane staining.
Description
- Single membrane organelle (monolayer).
- Due to the certain sample preparation artifacts, Lipid Droplets can appear "lumpy."
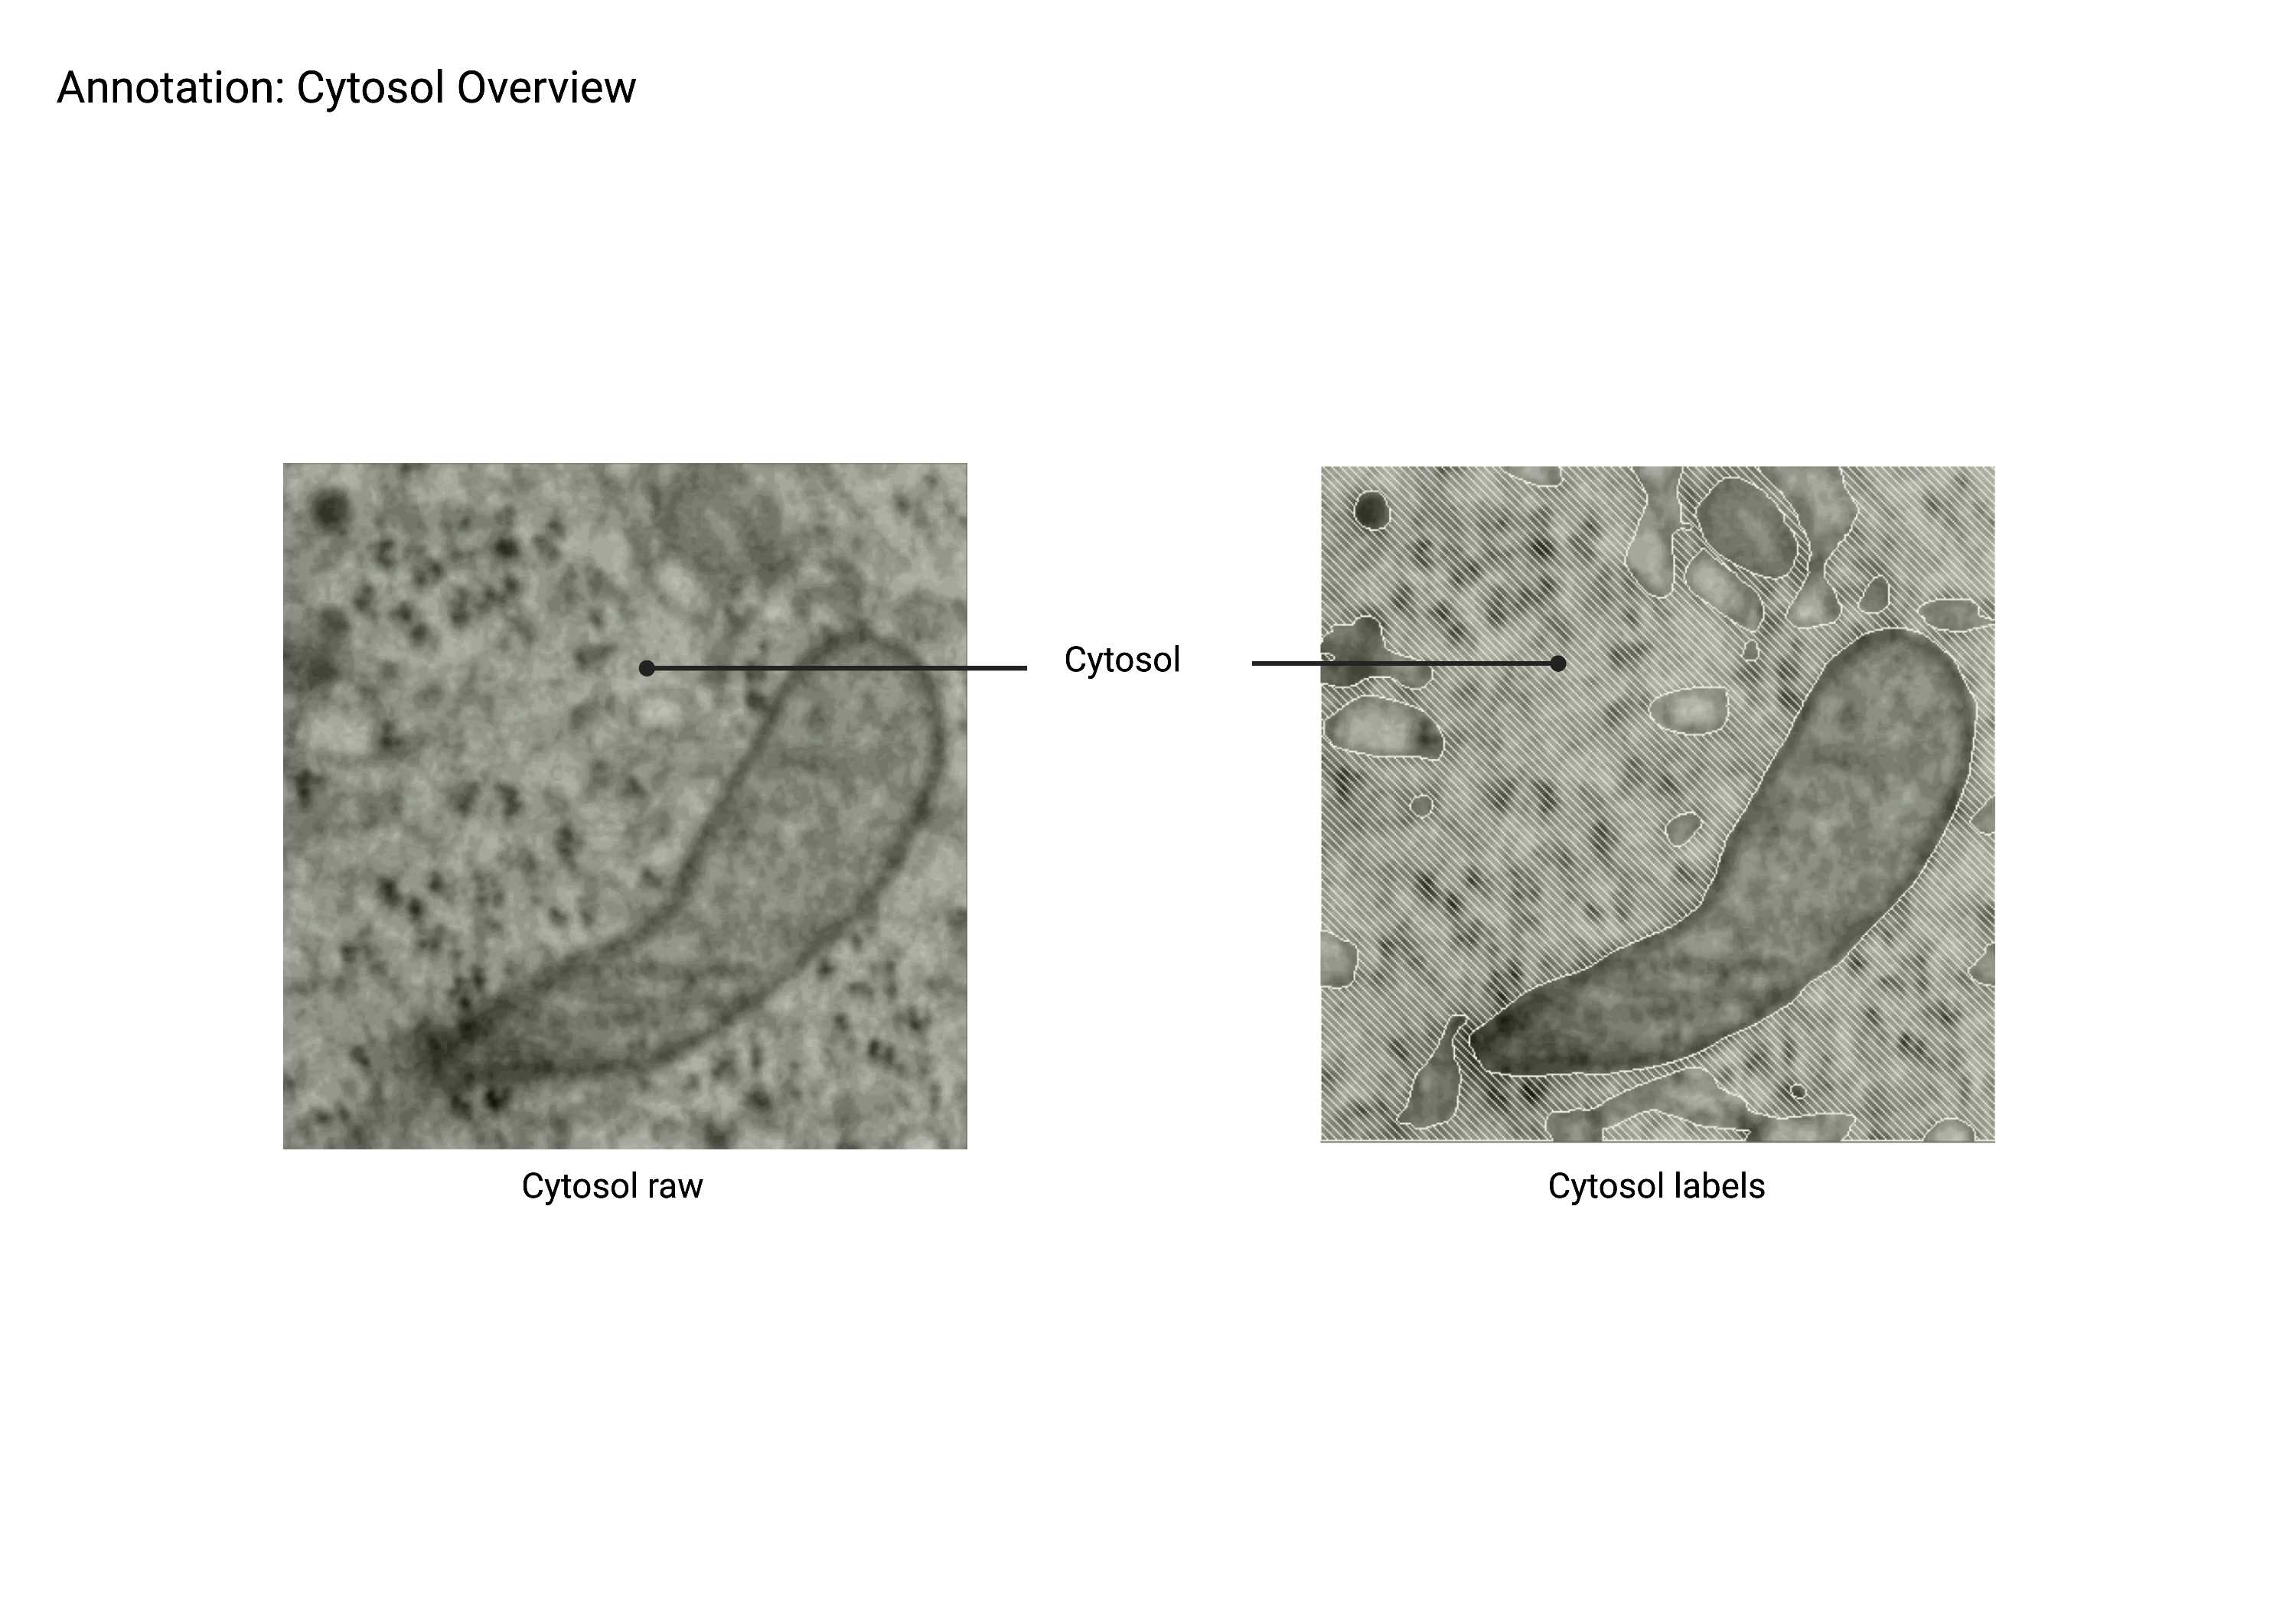
Cytosol
Cytosol
Summary
- Defined as any volume enclosed by a plasma membrane that is not categorized within an organelle or molecule class. The cytosol is often identified as the negative space within a cell surrounding relatively strongly stained organelles, proteins, and other molecules. The cytosol is not used as a training class, but rather as a negative example for all other training classes.
Description
- Negative space in the cell.
- Contains even distribution of ribosomes.
- Enclosed by the plasma membrane.
Recommended Annotation Steps
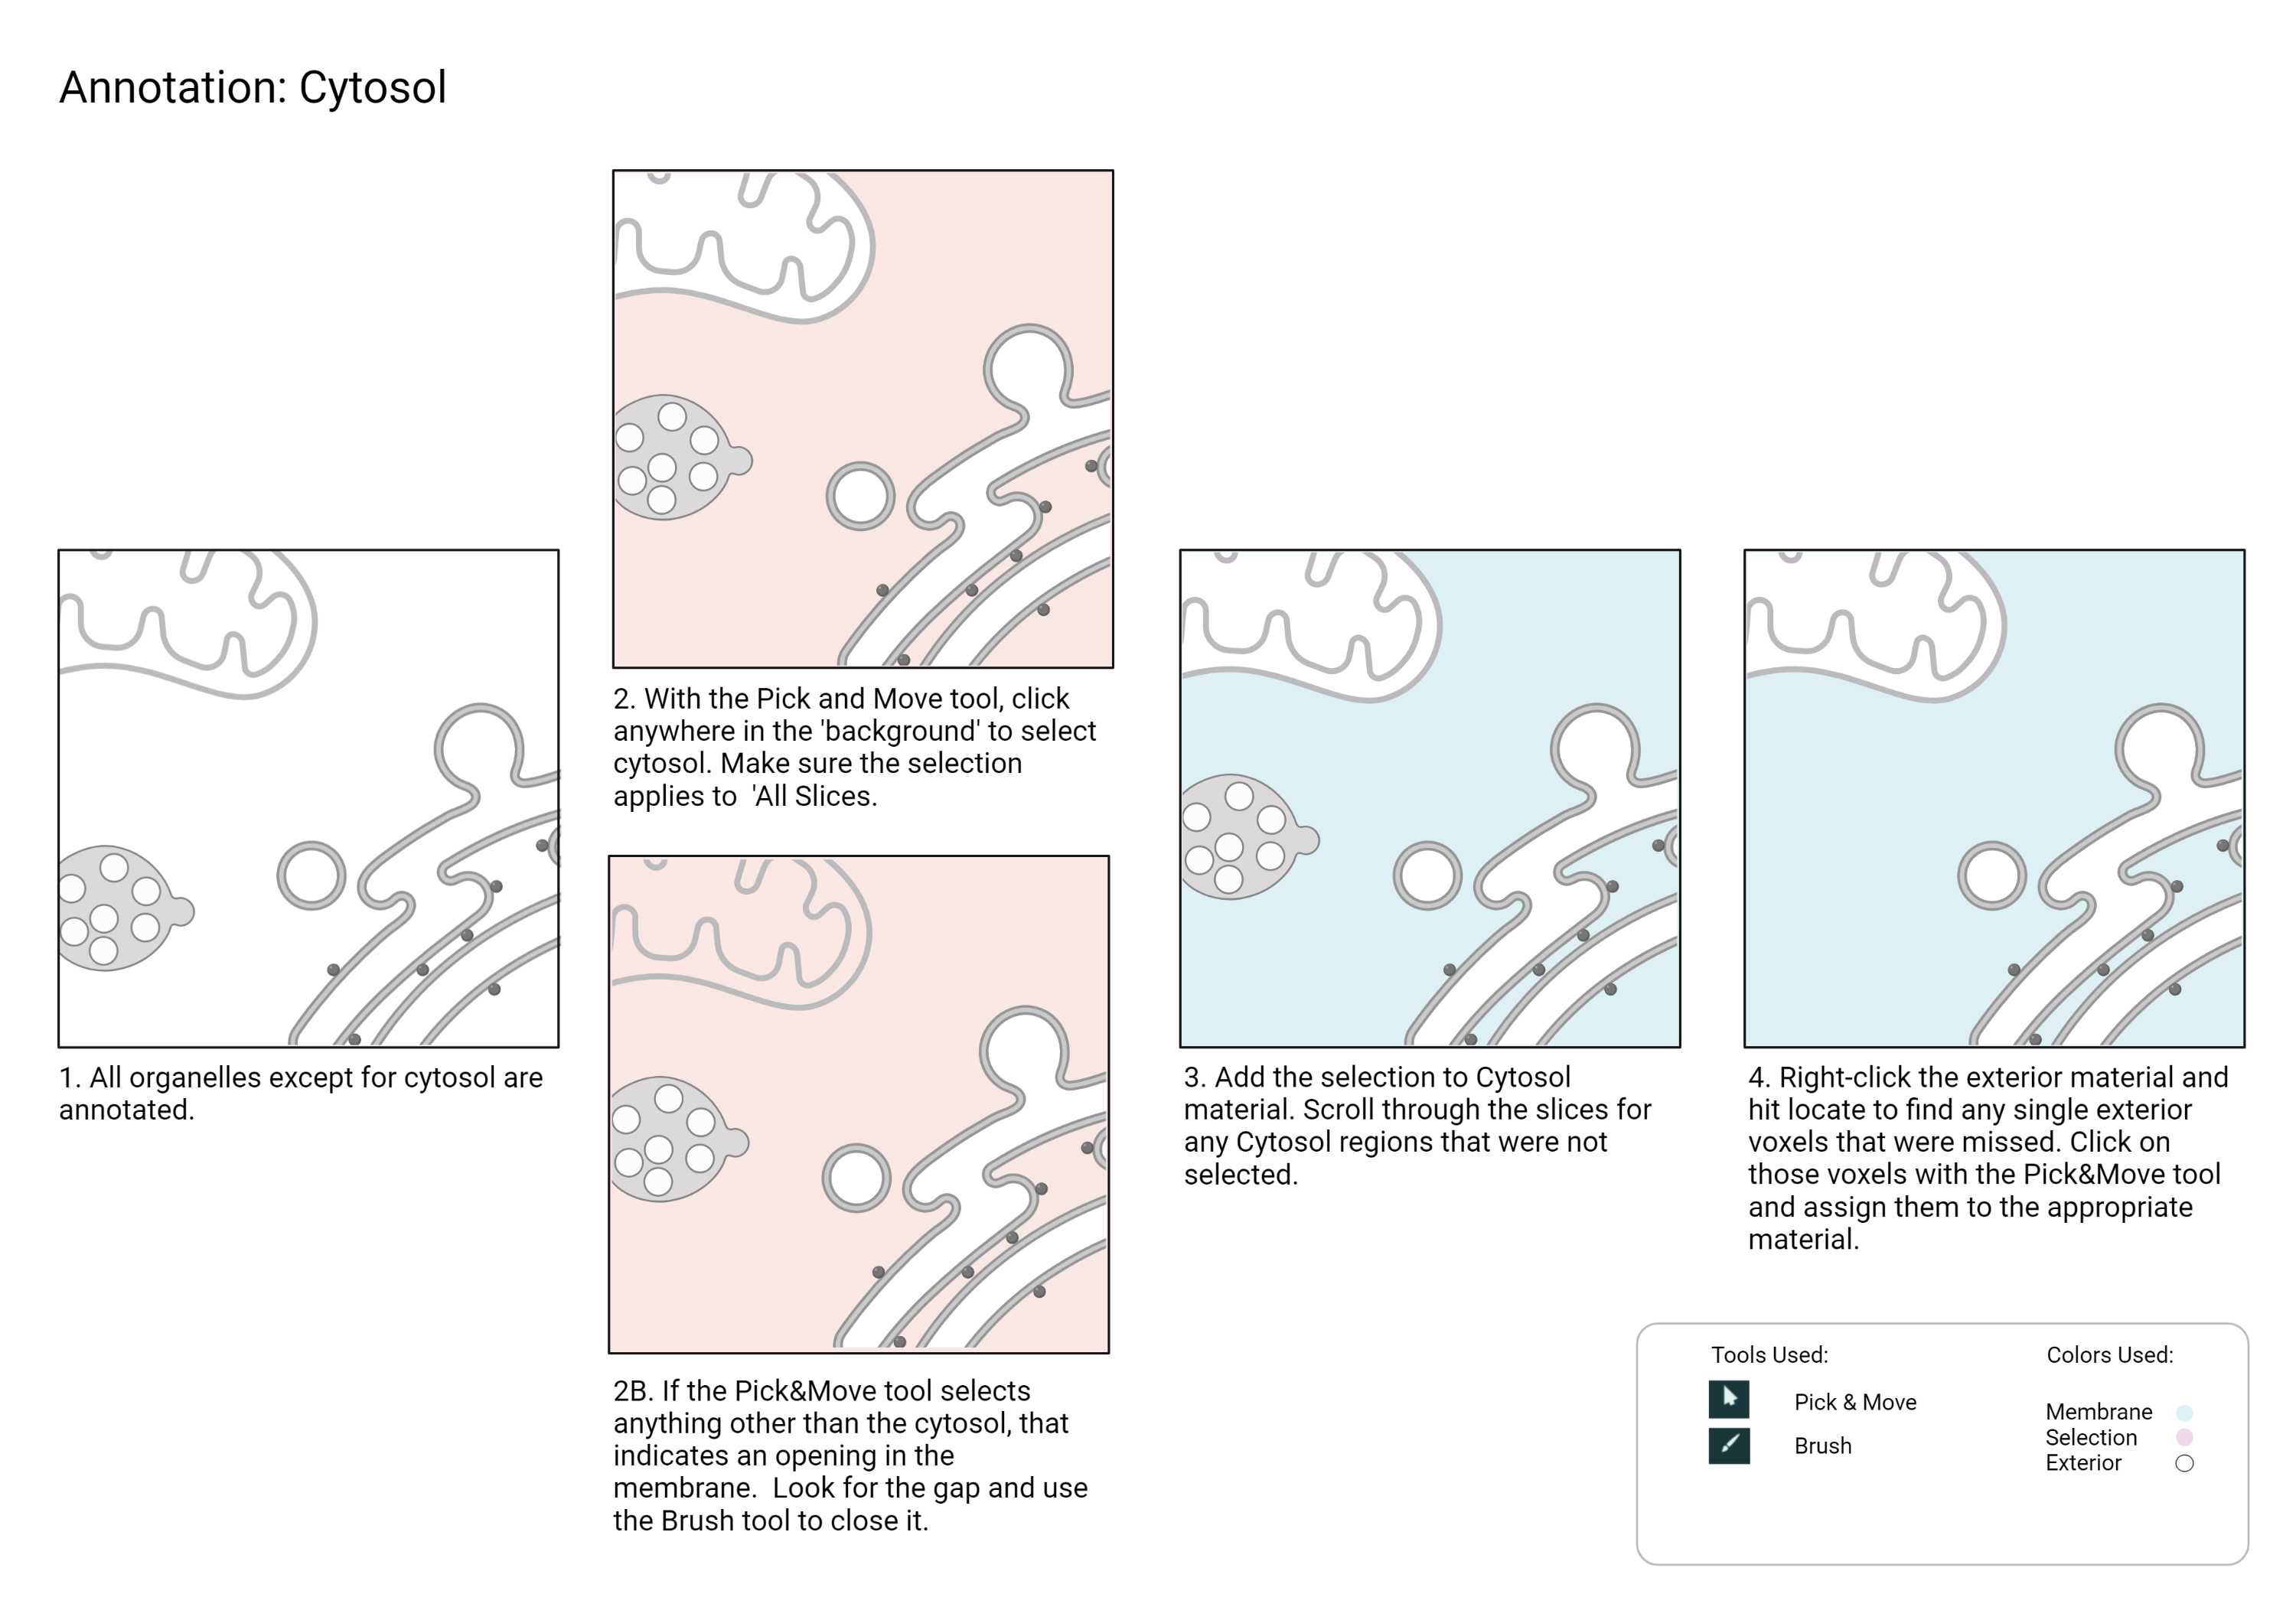
Checklist
- Do not add cytosol until you are ready to export your label field.
- Every voxel in the crop must be assigned to a material, leaving no exterior voxel behind.
- Once the cytosol is added, right-click on the exterior material and hit locate.
- Once you are re-directed to a frame containing an exterior voxel, select the material and expand until you can locate the voxel in the frame.
- Zoom in and re-assign the exterior voxel to the appropriate material.
- Repeat this step until there is no exterior voxel remaining.
Completion
Completion
-
Create a 'final_labels' label field.
-
Create a list of 36 materials based on Classifiers & Hierarchy
NoteClassifiers and Hierarchy 1: ECS2: plasma membrane3: mito membrane4: mito lumen5: mito DNA6: golgi membrane7: golgi lumen8: vesicle membrane9: vesicle lumen10: MVB membrane11: MVB lumen12: lysosome membrane13: lysosome lumen14: LD membrane15: LD lumen16: er membrane17: er lumen18: ERES membrane19: ERES lumen20: NE membrane21: NE lumen22: nuclear pore out23: nuclear pore in24: HChrom25: NHChrom26: EChrom27: NEChrom28: nucleoplasm29: nucleolus30: microtubules out31: centrosome32: distal appendages33: subdistal appendages34: ribosomes35: cytosol36: microtubules in -
Select and add corresponding materials from multiple label fields to 'final_labels'.
-
Capitalize the materials of classes that are present in the crop.
-
Check for any touching materials.
-
Separate them if needed.
-
Select the background and add it to the cytosol material.
-
Check for any remaining exterior materials. All voxels in the crop should be annotated. No exterior (unassigned) voxels should be left unannotated.
-
Save the Amira project.
-
Export the final label field as a 3D tif file.

