Wastewater QC workflow in GalaxyTrakr (SSQuAWK4)
Ruth Timme, Maria Balkey, Tunc Kayikcioglu, Jasmine Amirzadegan, hugh.rand
Disclaimer
Please note that this protocol is public domain, which supersedes the CC-BY license default used by protocols.io.
Abstract
PURPOSE:
Step-by-step instructions for checking sequence quality for SARS-CoV-2 wastewater samples using SSQuAWK: S ARS - CoV - 2 S equence Qu ality A ssurance W orkflow and K ontraption. The SSQuAWK workflow, implemented in CFSAN's custom Galaxy instance (GalaxyTrakr) will produce quality assessments for raw reads (Illumina MiSeq paired-end fastq files).
SCOPE: This protocol covers the following tasks:
-
Set up an account in GalaxyTrakr
-
Create a new history
-
Upload data and reference files
-
Execute the SSQuAWK workflow
-
Interpret the results
Protocol and SSQuAWK workflow version history:
- Protocol V8 SSQuAWK version 4: Protocol version 8 has minor text corrections. The SSQuAWK version 4 workflow required minor edits on an updated backend system of GalaxyTrakr, and thus is now labeled as "SSQuAWK4.0.2" in GalaxyTrakr. All SSQuAWK4 protocol steps listed in this guide are applicable to SSQuAWK4.0.2.
- Protocol V7 SSQuAWK version 4: Protocol now includes a QC determination guidance table. The SSQuAWK version 4 workflow required minor bug edits on the backend, thus is now labeled as "SSQuAWK4.0.1" in GalaxyTrakr. All SSQuAWK4 protocol steps listed in this guide are applicable to SSQuAWK4.0.1.
- Protocol V6 SSQuAWK version 4: Best practice guidance on fastq.gz file uploads and new QC metric.
- Protocol V5 SSQuAWK version 3: Previous protocol version had broken links for FASTA and BED files, this version fixes the links.
- Protocol V4 SSQuAWK version 3: Metrics now reported with fewer softwares, fewer underlying GalaxyTrakr jobs, and about 50% fewer underlying GalaxyTrakr steps. Cleaner output table formats now include QC placeholder columns for SRA metadata template.
- Protocol V3, SSQuAWK version 2: Addition of 5 new genome mapping metrics
- Protocol V2, SSQuAWK version 1: Addition of a detailed 12 minute video tutorial
- Protocol V1, SSQuAWK version 1: Basic protocol steps with screenshots
Participation was supported by the:
- Research Participation Program at the U.S. Food and Drug Administration administered by the Oak Ridge Institute for Science and Education (ORISE) through an interagency agreement between the U.S. Department of Energy and the U.S. Food and Drug Administration.
- Joint Institute for Food Safety and Applied Nutrition (JIFSAN), University of Maryland by the Food and Drug Administration (FDA) of the U.S. Department of Health and Human Services (HHS).
- The American Rescue Plan Act of 2021, Congress provided temporary funding for FDA to develop the capacity to sequence SARS-CoV-2 RNA from wastewater samples and to conduct a sampling and sequencing project through 2022.
Before start
Steps
Account set up
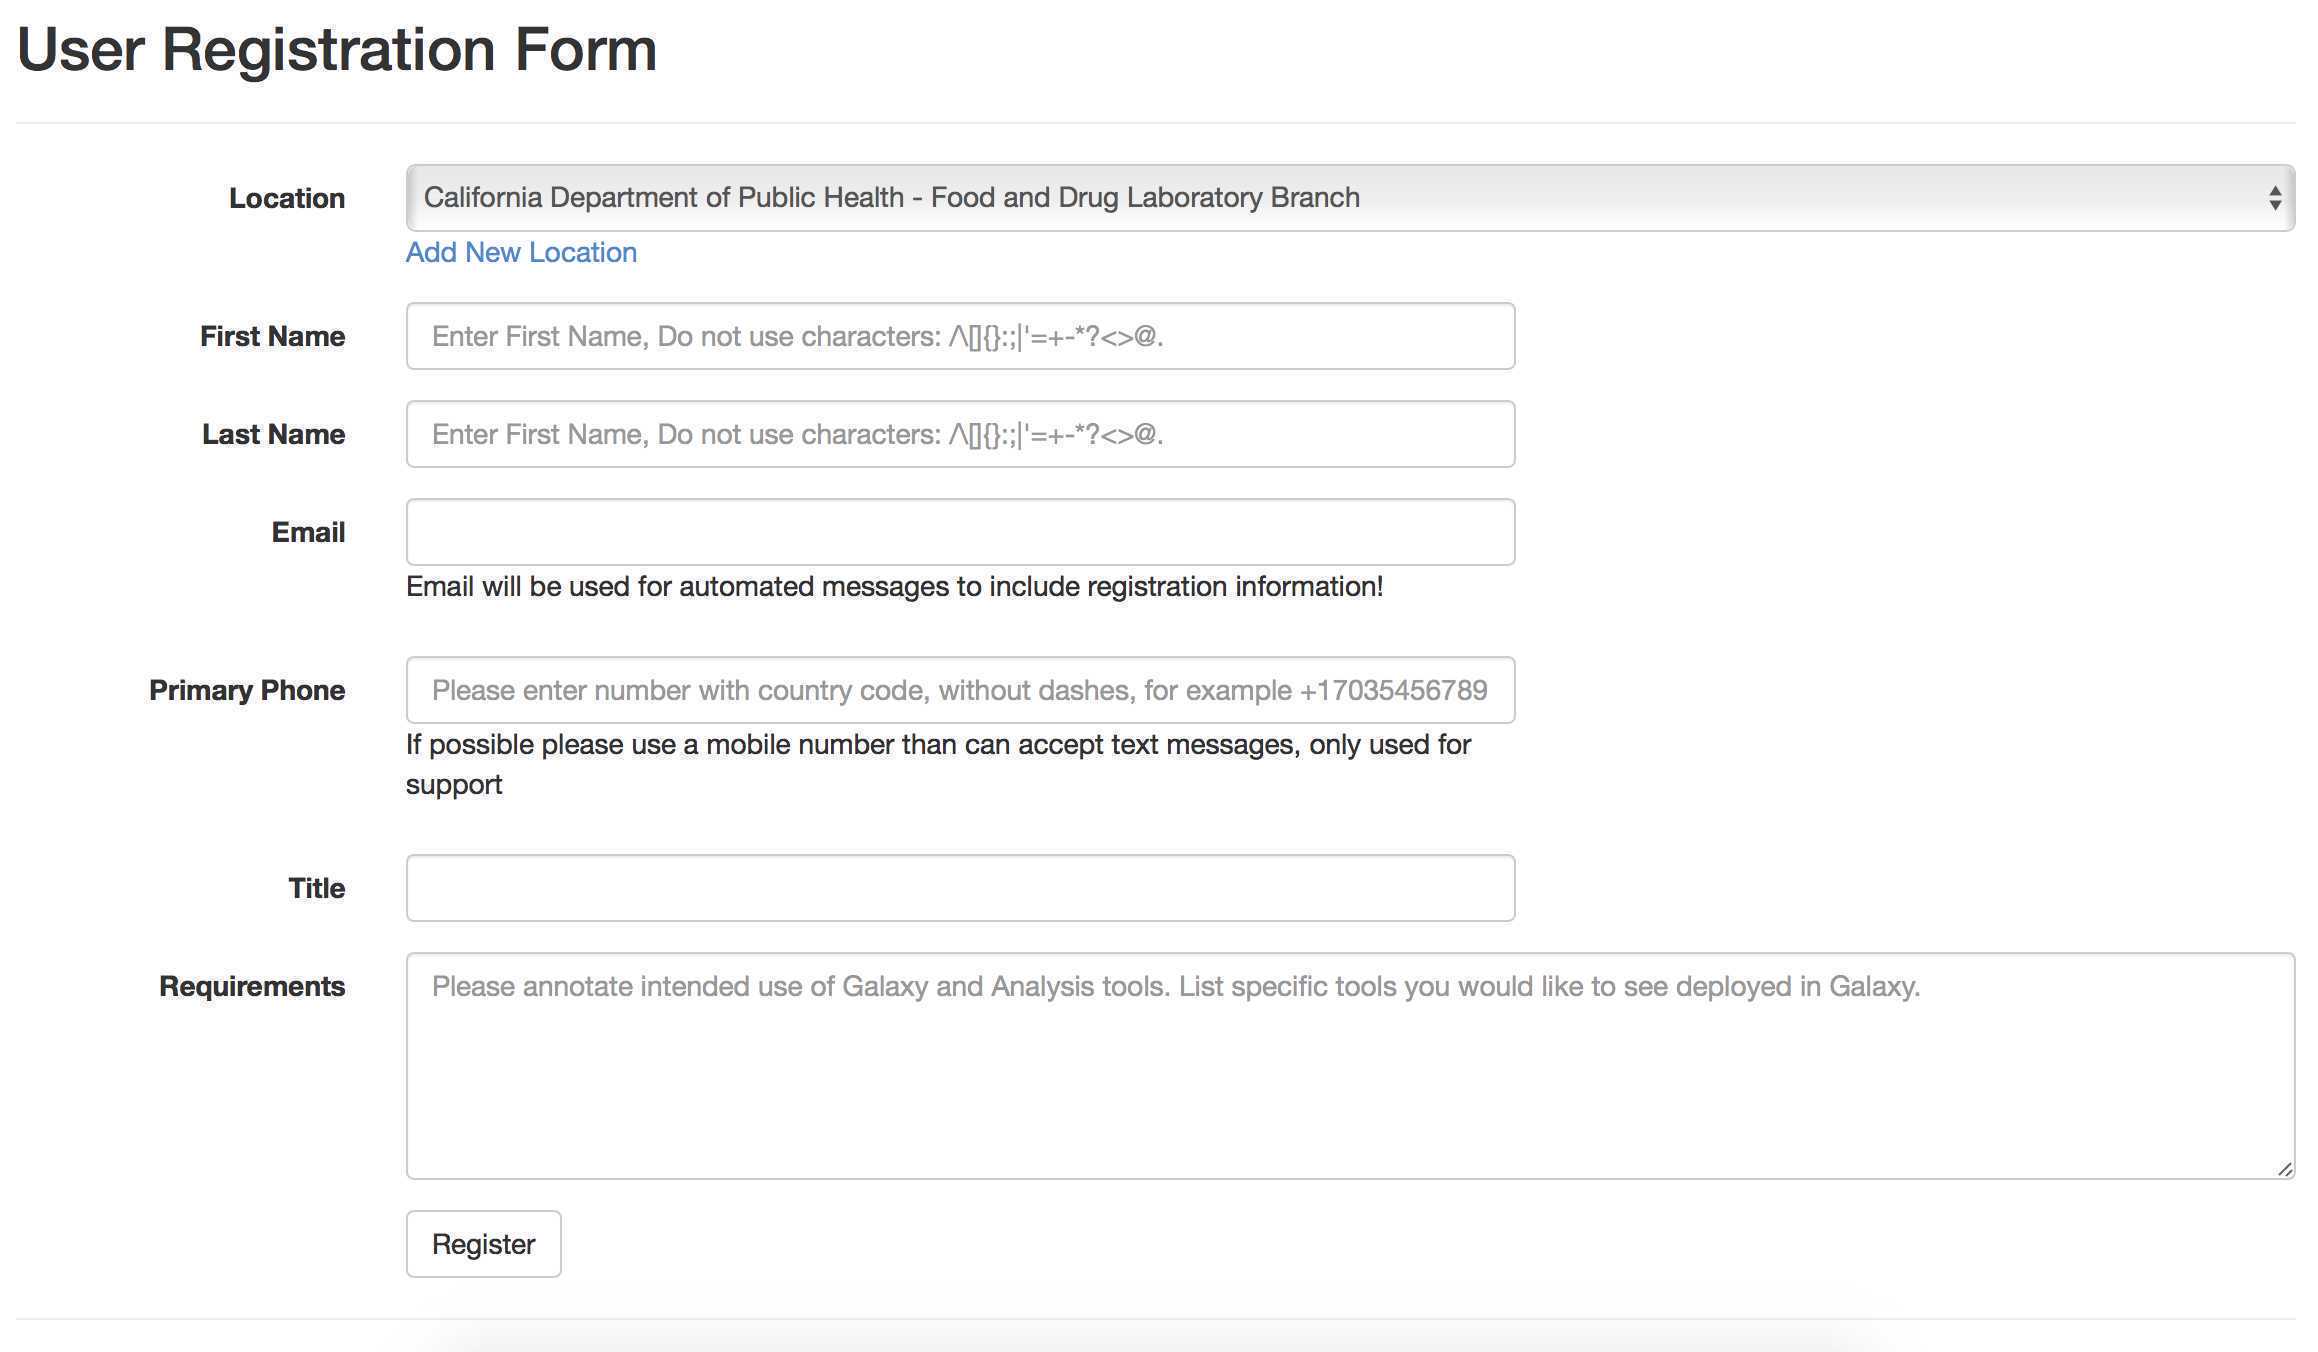
Create a GalaxyTrakr account here: https://account.galaxytrakr.org/Account/Register
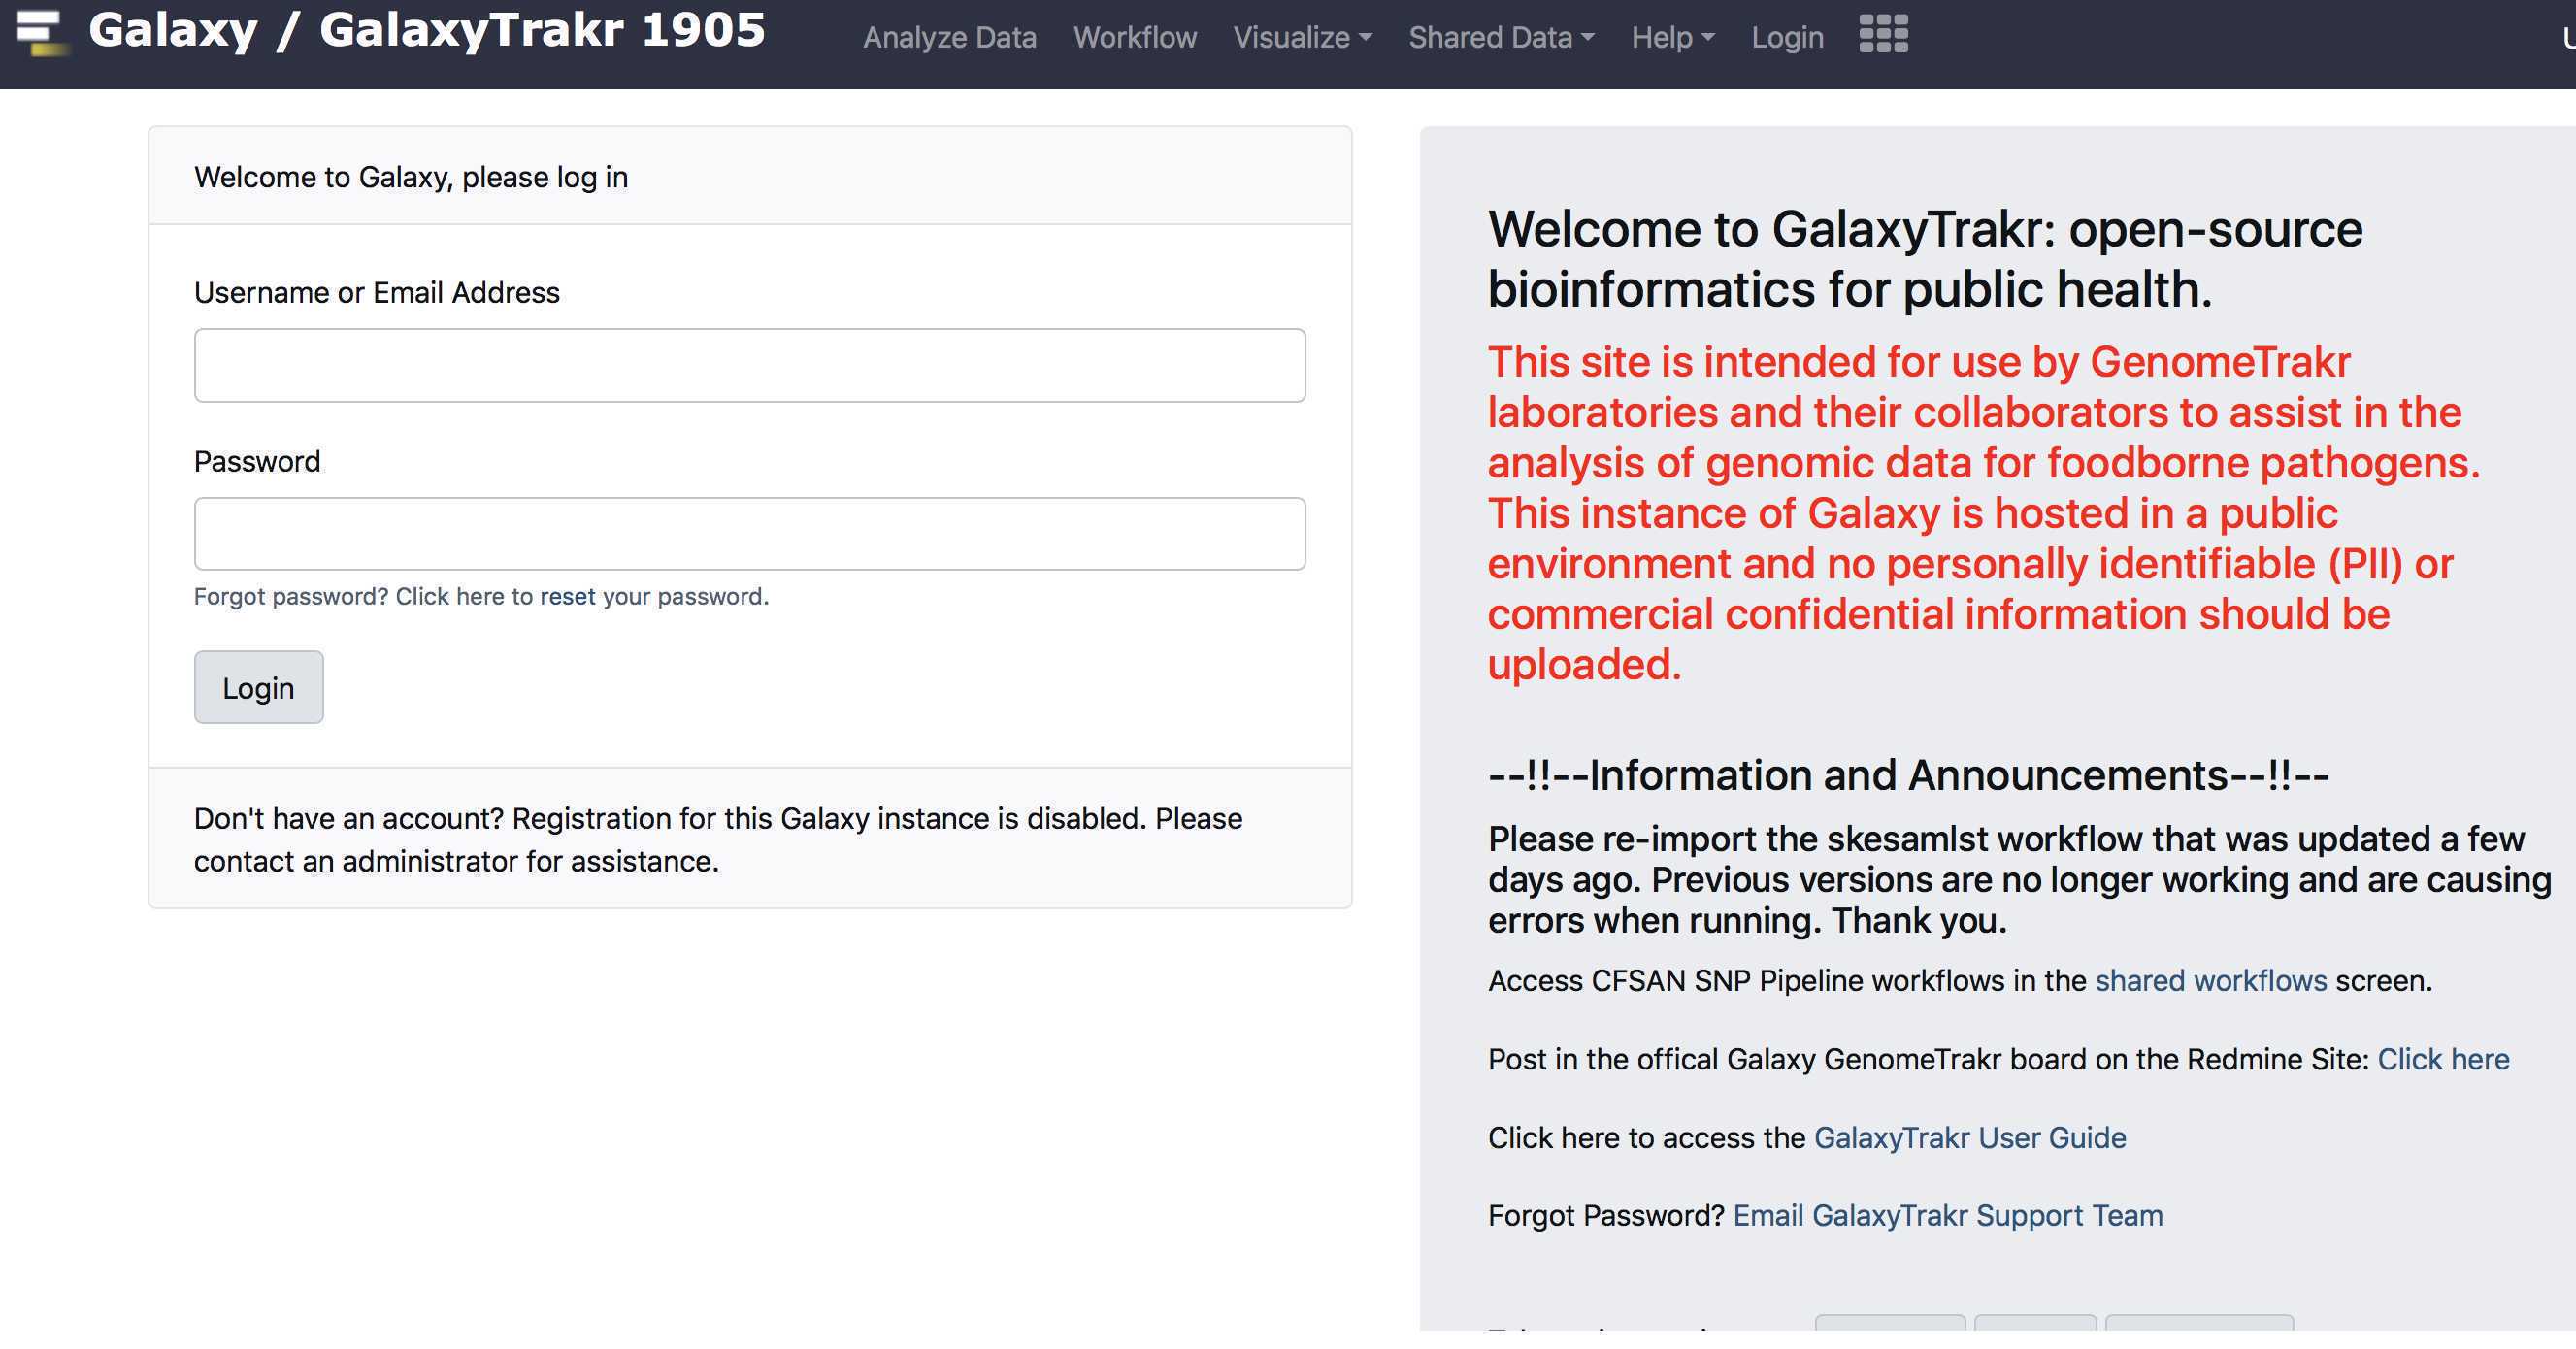
Log into your GalaxyTrakr account: https://galaxytrakr.org
Create a new history
Create a new history.
We recommend creating a new history for each new MiSeq sequence set with details and date in the history name.
Save your SSQuAWK output here with any other relevant analyses.
After all the analysis output from this run is saved to your internal data network or computer, older history's should be purged/deleted so as not to occupy the limited storage space in your account.
In some cases it may be useful to save, for a limited time, multiple histories or to run analyses concurrently in multiple histories.
In these cases you need to pay attention to your % usage bar (shows % used of allocated storage space) in the upper right corner of the GalaxyTrakr page.
If you need additional space you can contact galaxytrakrsupport@fda.hhs.gov and request additional storage.
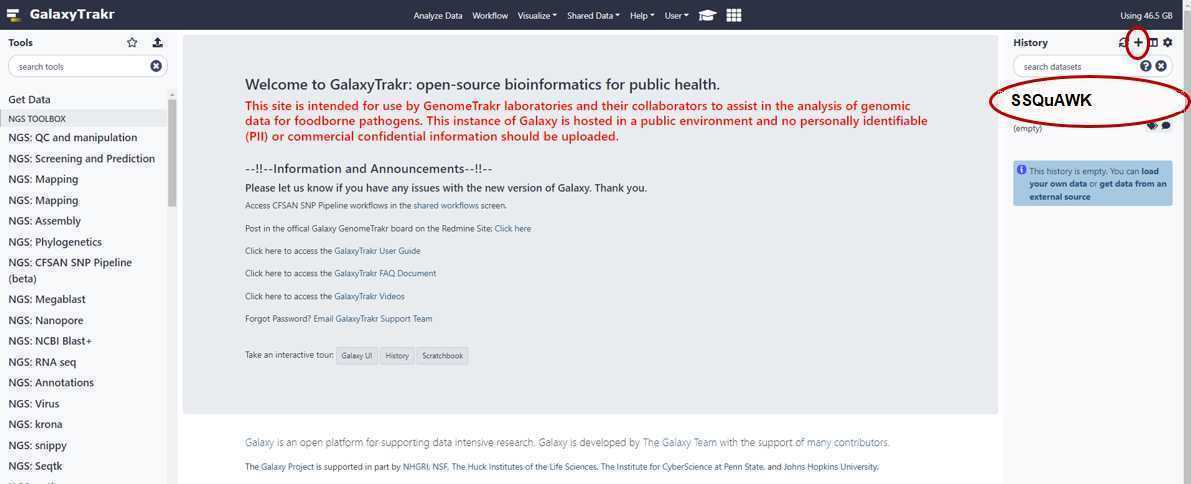
Create a new history with the "+" symbol in the upper right hand corner. Name your history and press "enter" on your keyboard to save the name.
Upload Sequence Data
This section will describe the process for uploading raw fastq files into your active History panel. After the files have been uploaded they will stay in your account until they are deleted.
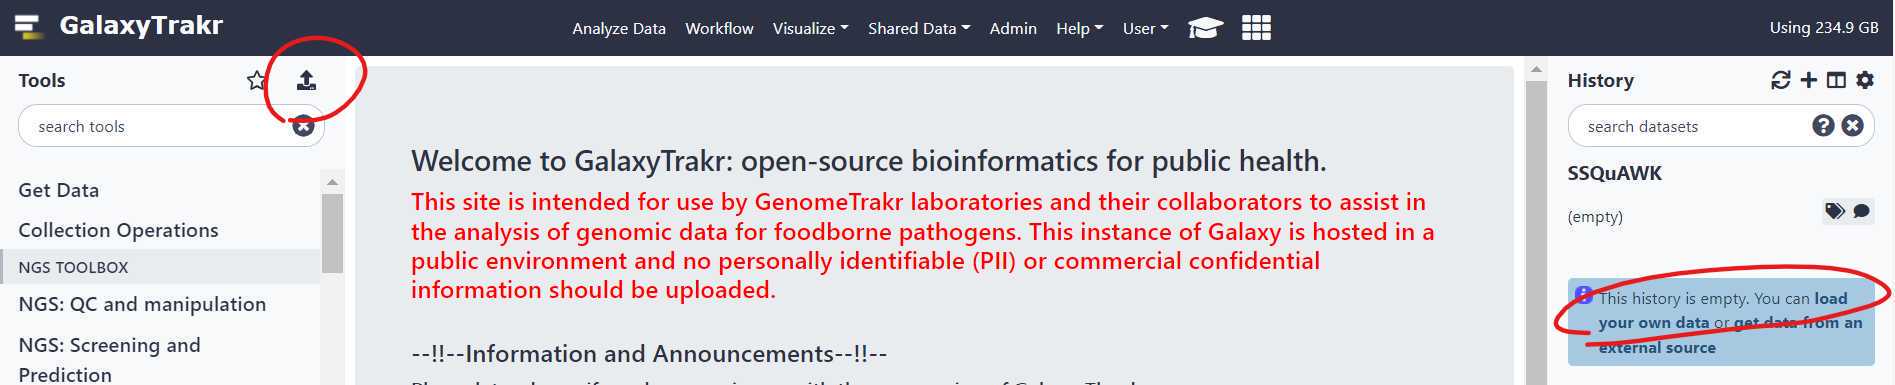
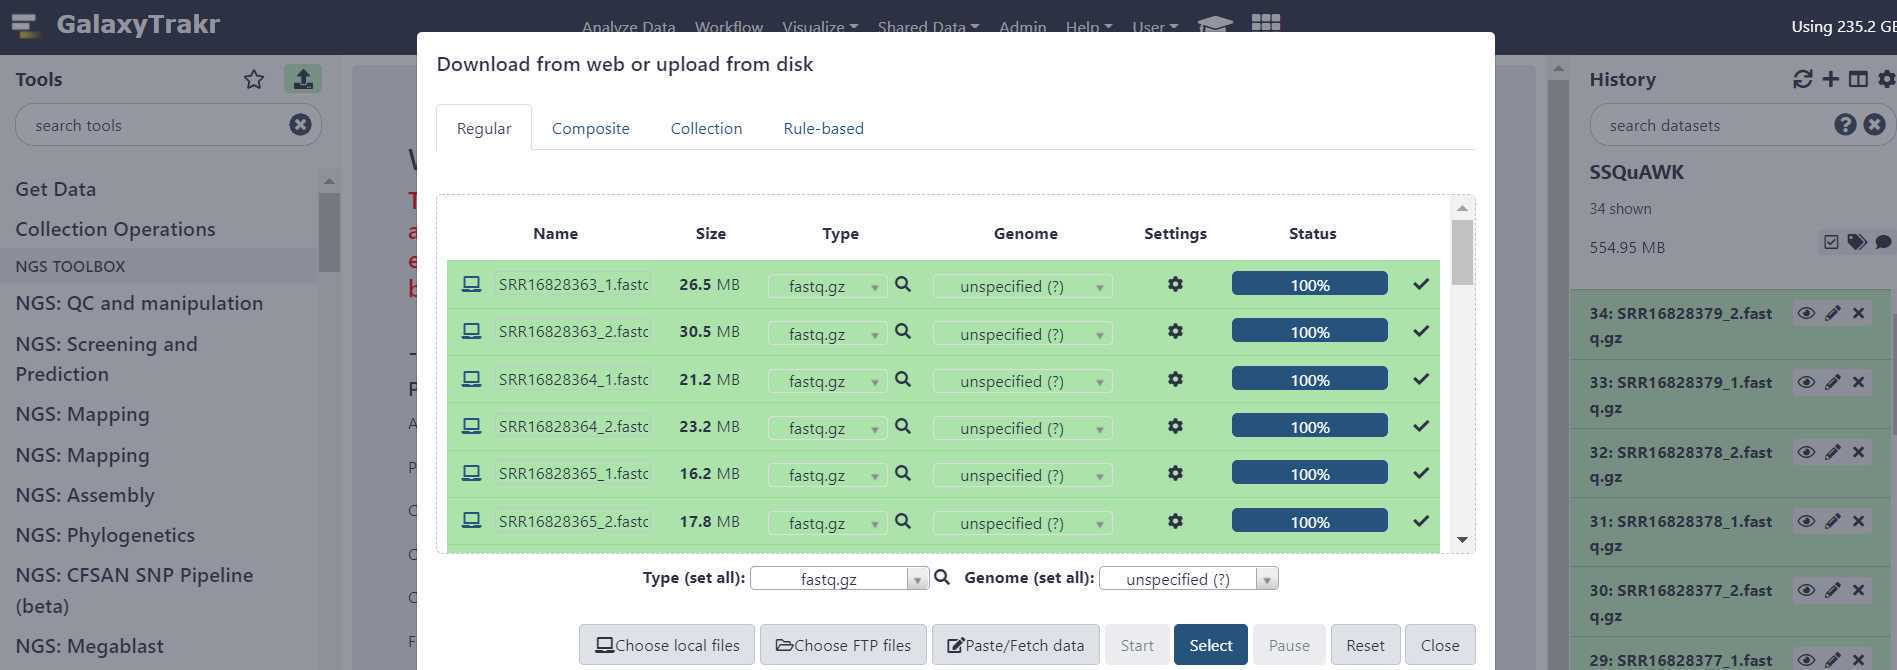
Upload sequence data to your history , using either of the two options circled in red below.
A window will appear in the middle of your screen. This is where you select your files using the "Choose local files" button at the bottom of the window. The "Choose local files" button is highlighted in green. These fastq.gz files should be paired (two per sample).
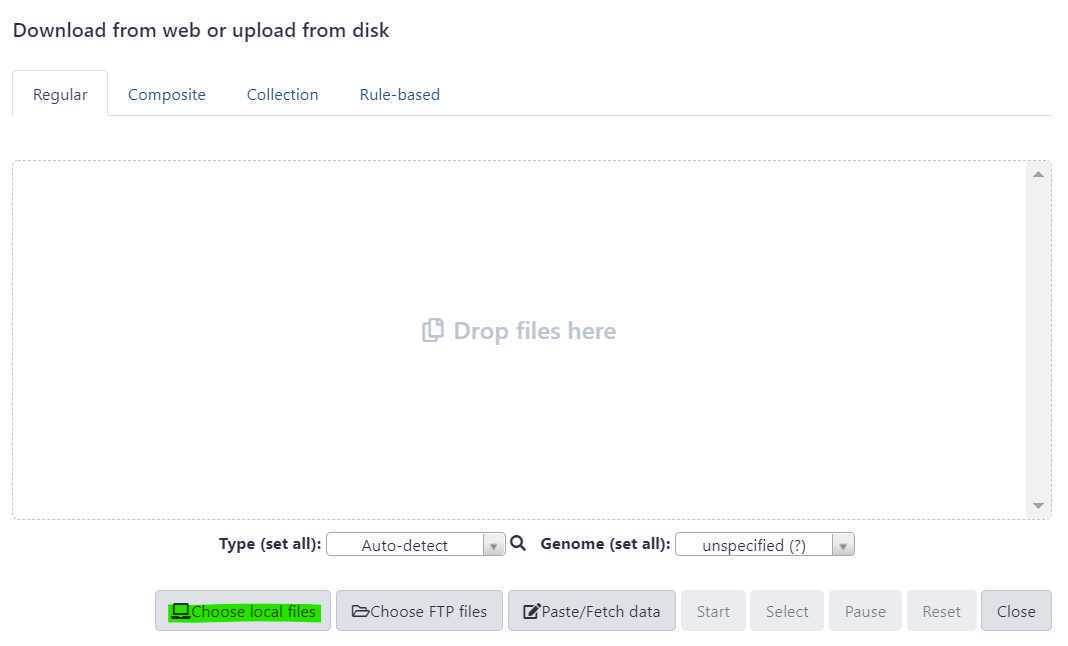
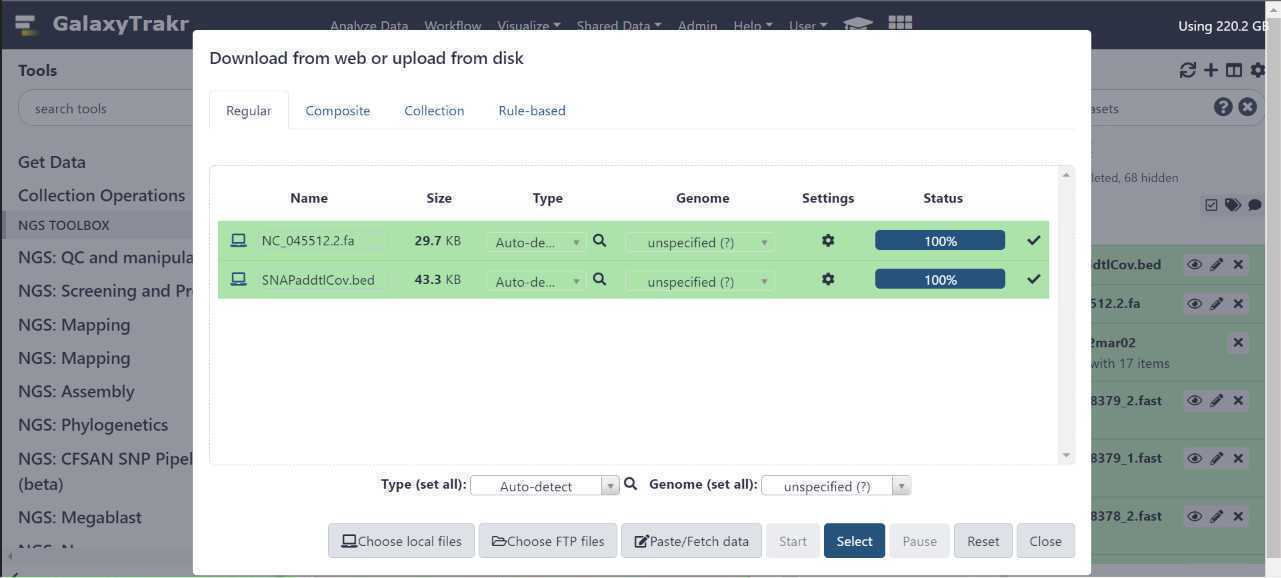
Before initiating the file upload, double check that the file "Type" is appropriately set.
Do not use the "Auto - Detect" option.
Sequence data uploaded using the "auto - detect" option may be subject to file corruption.
This can result in various downstream analysis issues, including empty output metrics and job errors.
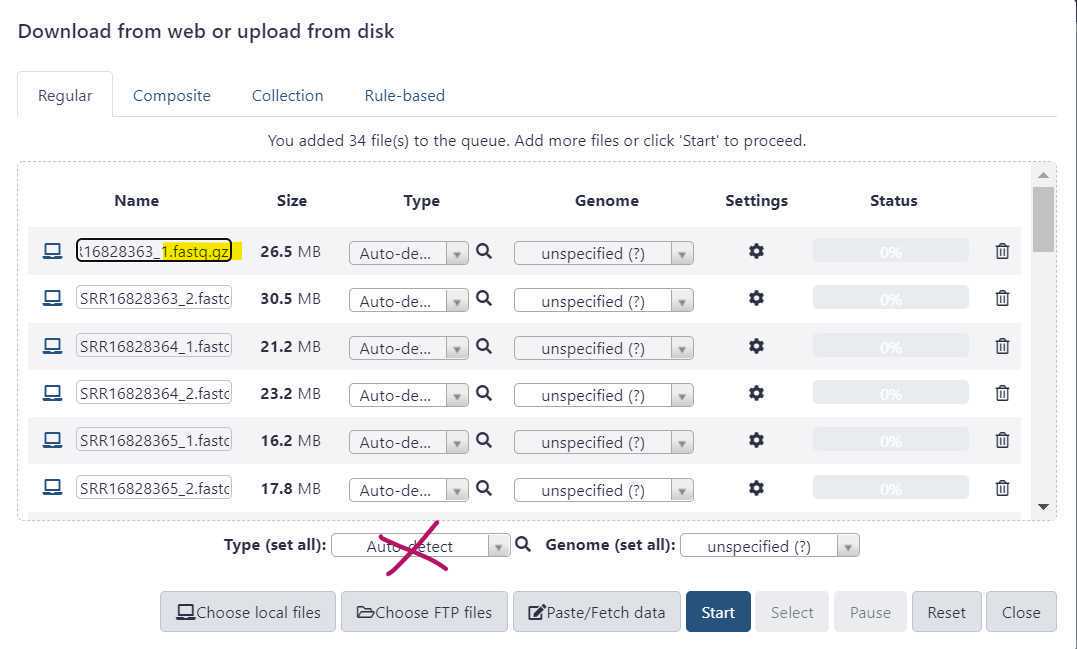
Instead, use the "Type (set all)" dropdown to select the correct file type.
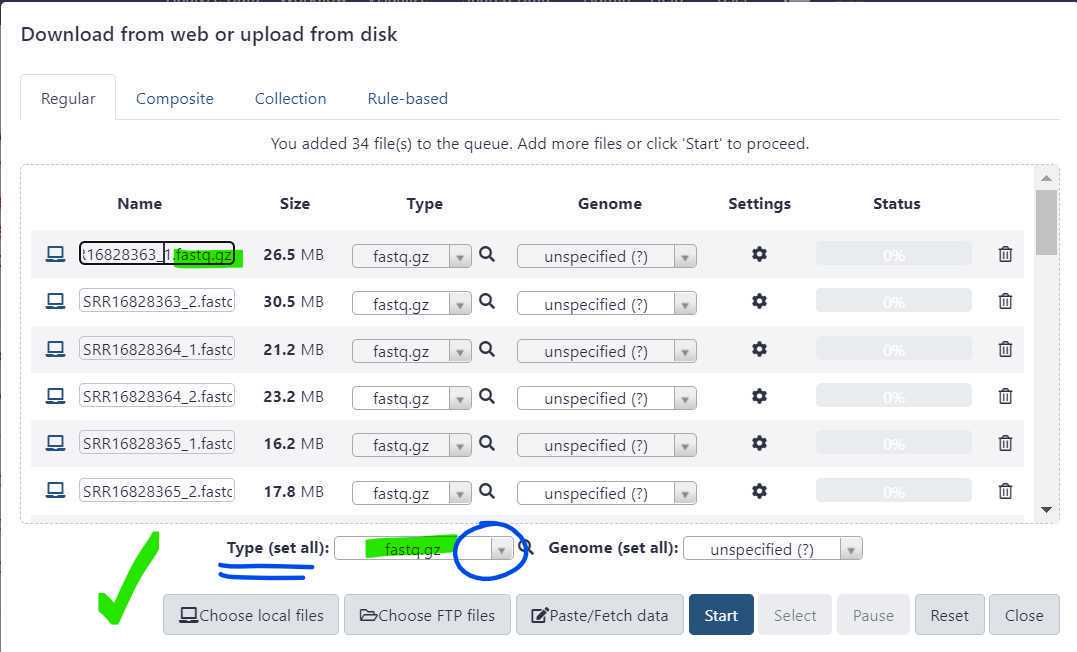
Once the file type is set , press "Start" to initiate your data upload to GalaxyTrakr. The "Start" button is circled in green.
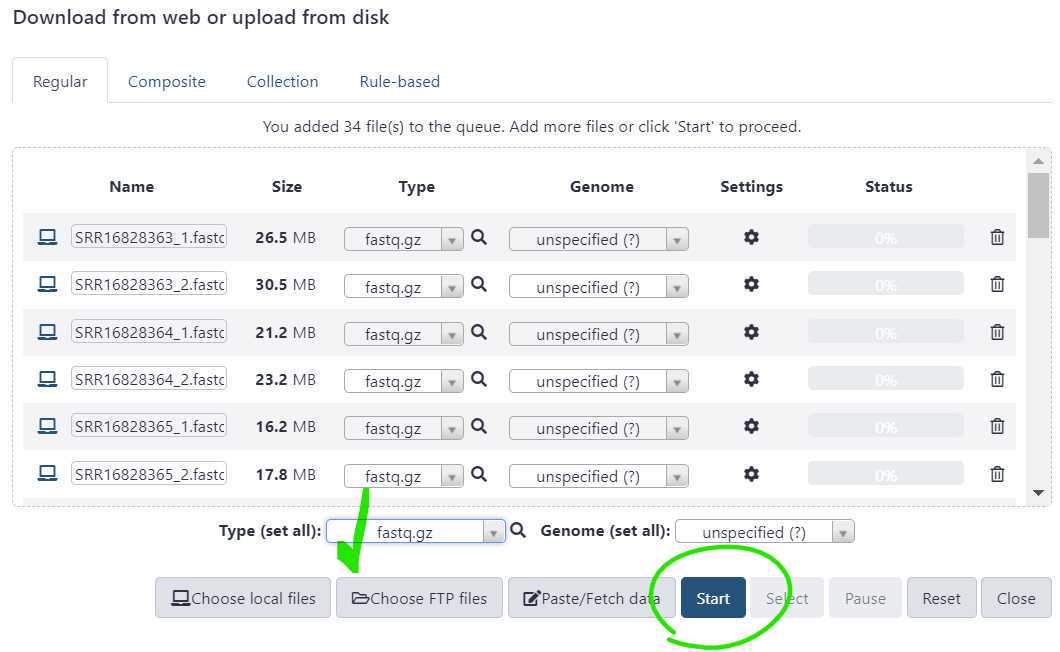
As the file uploads complete, each row will turn green. If samples are shown with yellow background, then are still uploading.
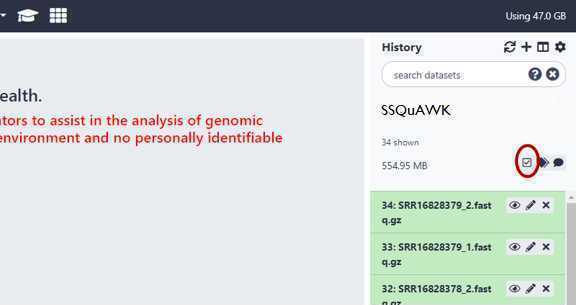
You have just upload a set of forward and reverse reads. For further analysis these files need to be paired properly so the platform knows which R1 and R2 files go with each sample. GalaxyTrakr does this by creating a List of Dataset Pairs.
Within your newly created History panel, click the "check box," then select all the files you just uploaded by clicking "All" or by individually selecting the ones you want to pair.
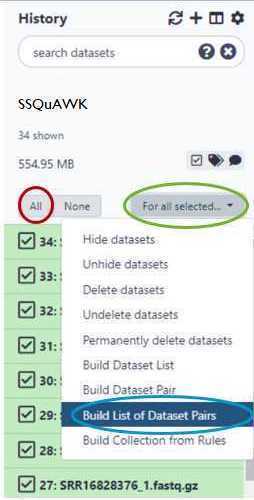
Check all the files belonging to a pair. In this example, all the files belong to a pair, so I will use the "All" button (circled in red).
Then, use the "For all selected…" dropdown (circled in green), and click on "Build List of Dataset Pairs" (circled in blue).
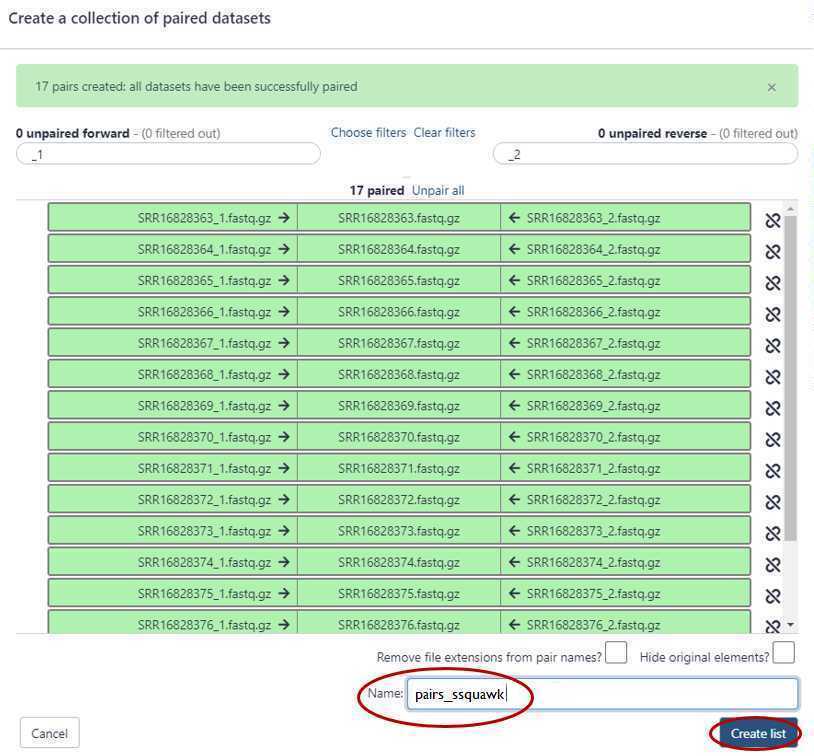
GalaxyTrakr will automatically pair the files, but it's good to double check.
Paired reads will pair in the middle column and turn green.
If everything looks good, then choose a name for your pairs (circled red) and "Create List" (also circled red).
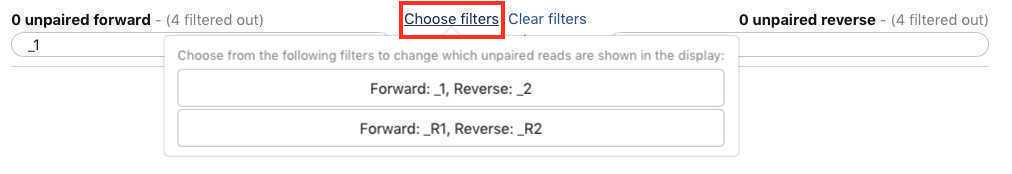
Alternatively, instead of auto-pairing you can click "choose filters" and select the appropriate filter for the pairing:
This paired dataset will now be available for analysis in your history panel. You can run multiple analyses on the same dataset in a history rather than upload the same sequence data to a new history to perform additional analyses. This will help you use your allocated storage space efficiently.
Upload reference data
To the existing history, also upload (1) the provided reference.fasta file and (1) a primer.bed file.
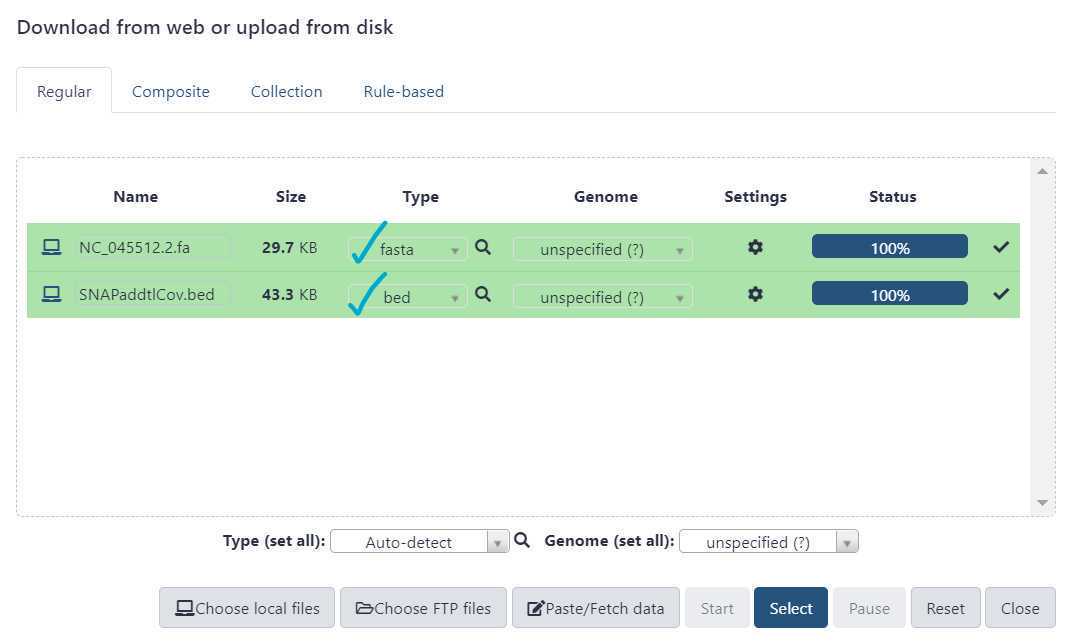
SSQuAWK is only compatible with the 22903 nt reference genome file obtained from NCBI 'NC_045512.2'. It is provided here for your convenience:
The primer.bed file should correspond to the SARS - CoV - 2 enrichment primer panel kit used.
QIAseq Direct kit: QIAseqDIRECT.bed
SNAP standard kit: SNAPStd.bed
SNAP additional coverage kit: SNAPaddtlCov.bed
NEB VarSkip Short (version 1) kit: varskipShort.bed
NEB VarSkip Short (version 2) kit: VSSv2.bed
ARTIC v4 primer schemes: ARTICv4.bed
Run the SSQuAWK workflow
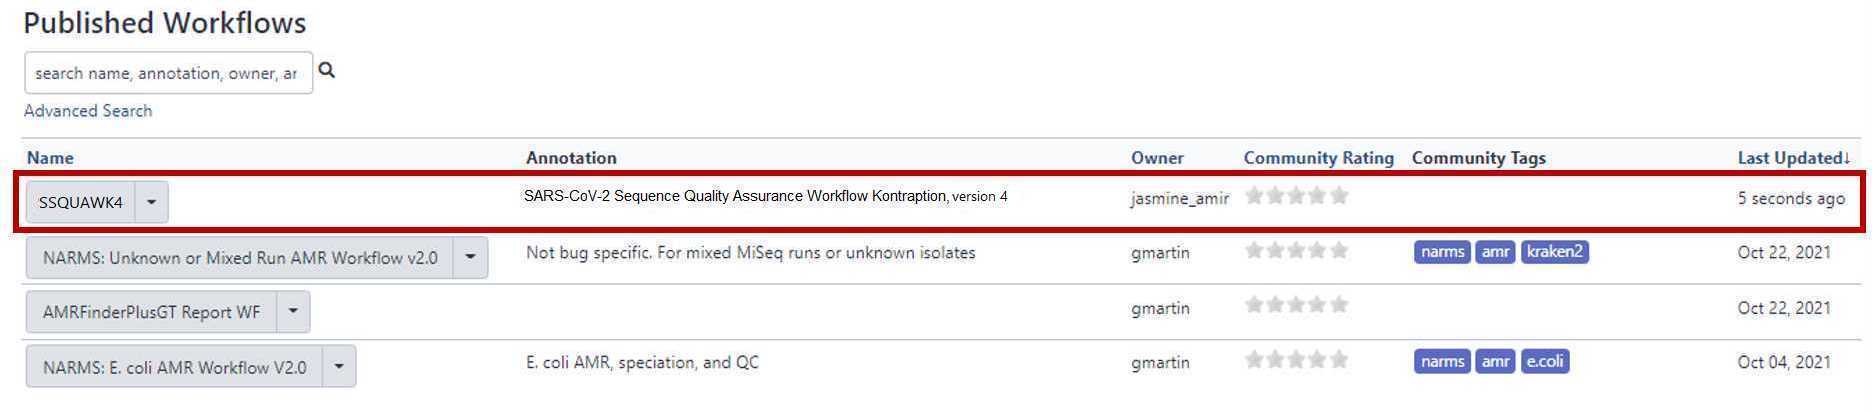
Access the SSQuAWK4.0.2 workflow with the "workflows" panel.*
*SSQuAWK4.0.1: S ARS - CoV - 2 S equence Qu ality A ssurance W orkflow K ontraption, version 4.0.2
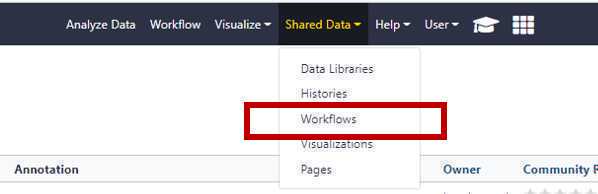
Navigate to the “Shared Data" drop down and choose workflows
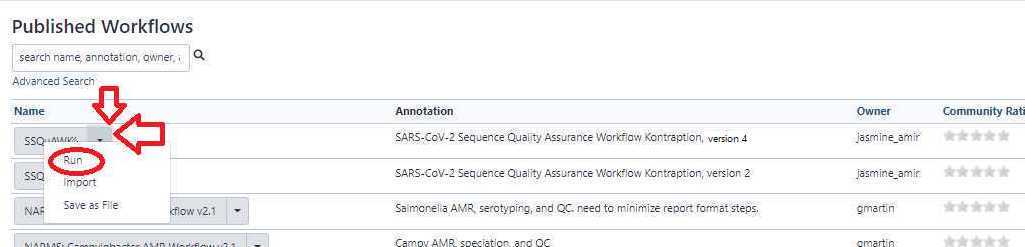
Then, from the SSQuaWK4.0.1 drop down menu, select "Run".
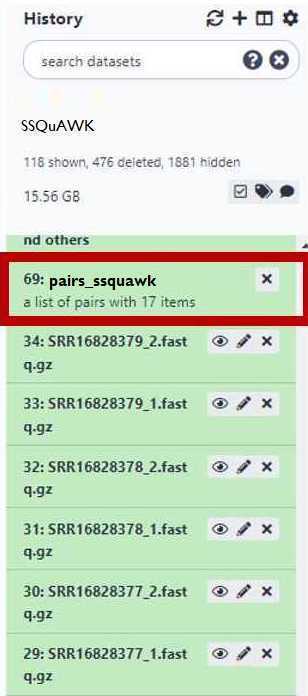
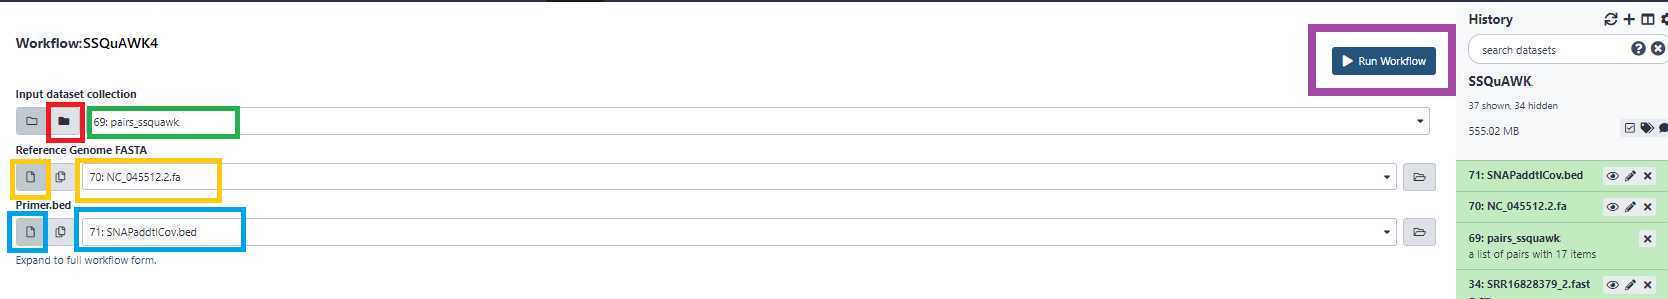
Select the paired list you created earlier by selecting the folder icon (boxed in red), and then the list of pairs (boxed in green).
Boxed in gold: Select the reference fasta file from your history.
Boxed in blue: Select the bed file from your history.
Click Run Workflow (boxed in purple).
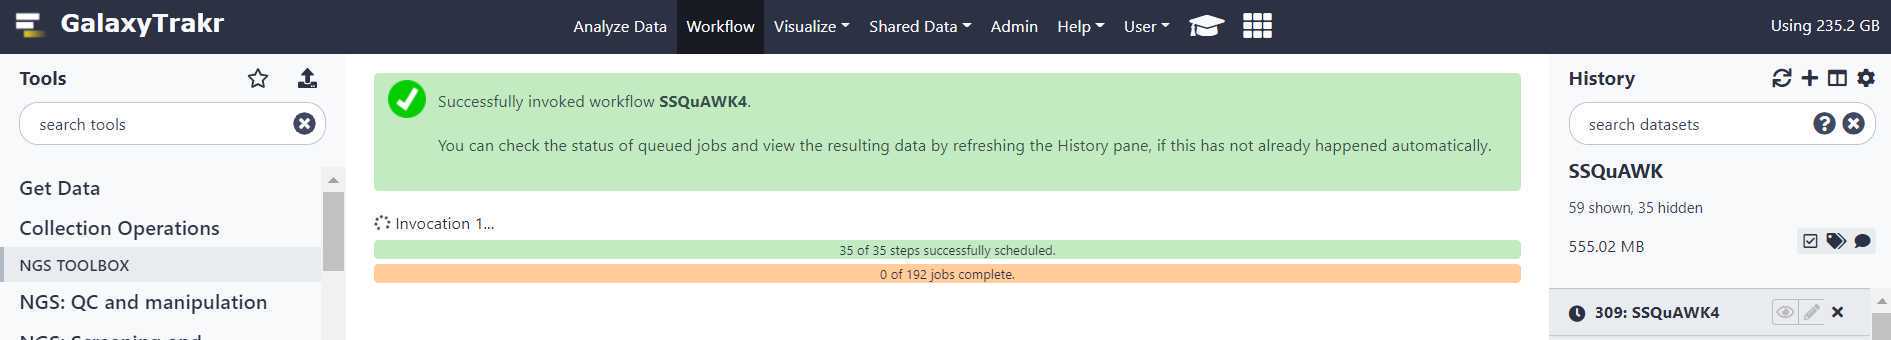
Running the workflow can take some time depending on the number of samples you are analyzing. Once GalaxyTrakr adds the workflow invocation to the queue, you can choose to log out of GalaxyTrakr and log back in at a later time to see if the job is completed.
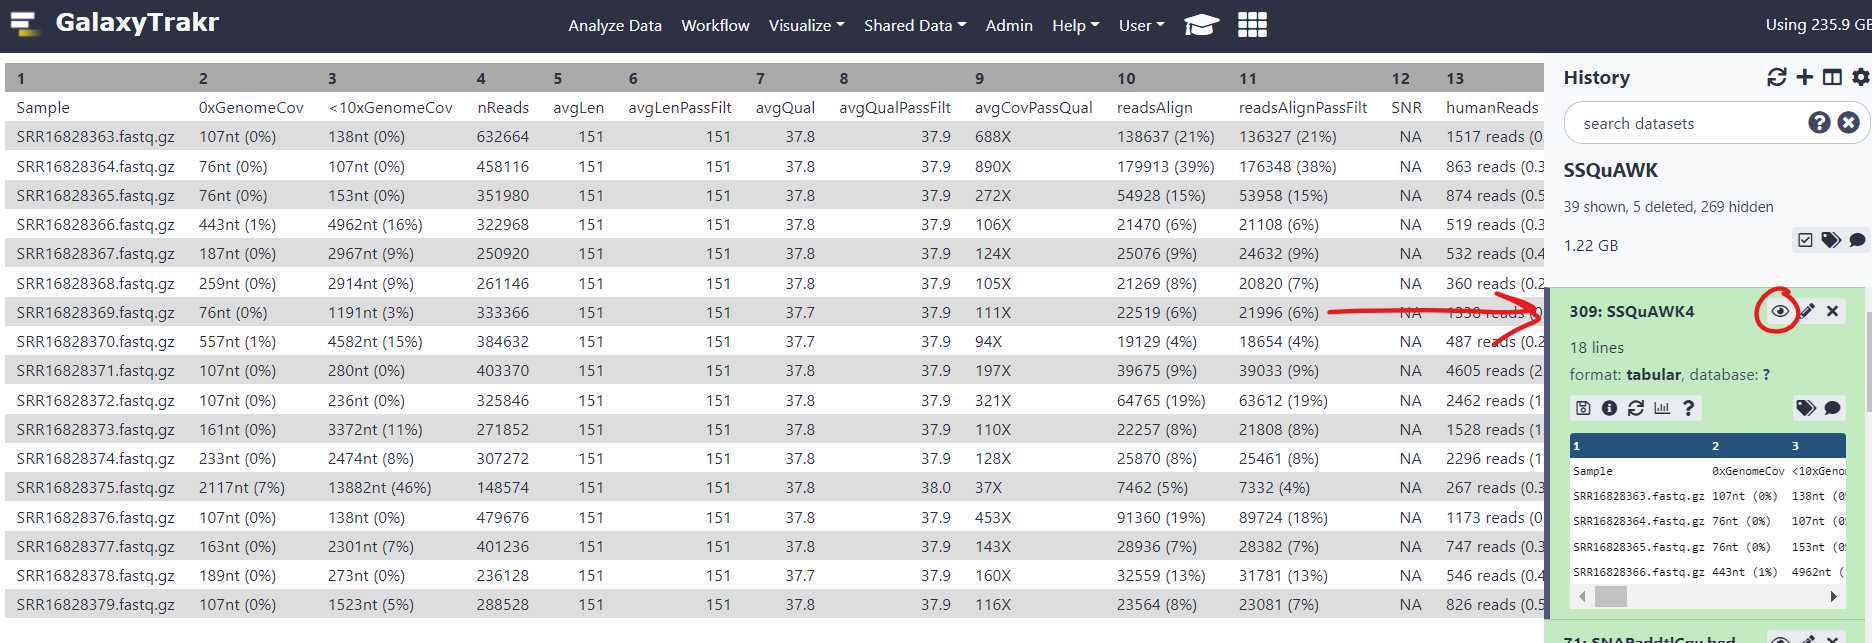
Upon completion of the pipeline, the output file for SSQuAWK4.0.2 will be green. Click on the “Eye” icon to view in GalaxyTrakr window.
Interpret the results
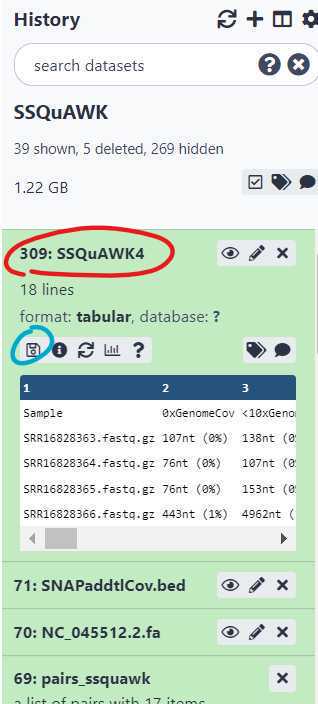
Download and interpret the results:
Click the output file text for " SSQuAWK4.0.2" (circled in red) and then the floppy disc save icon (circled in blue). The tabular file can be opened in a text reader or converted to a format that can be opened in Excel.
The SSQuAWK4.0.1 output file includes the following metrics:
Parameter | A | B | C | | --- | --- | --- | | Parameter | Tool | Description | | Sample | List of Pairs | Sample name from list of pairs | | 0xGenomeCov | Bowtie2, samtools, ivar_trim | Percentage of nucleotides that do not cover the genome at all (zero times) | | <10xGenomeCov | Bowtie2, samtools, ivar_trim | Percentage of nucleotides that barely cover the genome (less than 10 times) | | nReads | Bowtie2 | Total number of reads | | avgLen | Bowtie2, samtools | Average read length | | avgLenPassFilt | Bowtie2, samtools, ivar_trim | Average read length after iVar_trim filtering* | | avgQual | Bowtie2, samtools | Average read quality | | avgQualPassFilt | Bowtie2, samtools, ivar_trim | Average read length after iVar_trim filtering* | | avgCovPassQual | Bowtie2, samtools, ivar_trim | Average number and percentage of nts from sequence reads that map to the genome | | readsAlign | Bowtie2, samtools | Number and percentage of reads that aligned to the reference sequence. | | readsAlignPassFilt | Bowtie2, samtools, ivar_trim | Number and percentage of reads that aligned to the reference sequence after iVar_trim filtering*. | | SNR | Bowtie2, ivar_trim, Python3 and Pandas | SNR is "Signal to Noise Ratio". When the sequence dataset contains one paired sequence set containing "negativeControl" in its name, SNR will be calculated. Otherwise, the SNR metric will return "NA". The SNR calculation is as follows, for each sequence file pair: readsAlignPassFilt / readsAlignPassFilt_negativeContol | | humanReads | Kraken2 | Number and percentage of reads classified as Homo sapiens | | SARS-CoV-2Reads | Kraken2 | Number and percentage of reads classified as SARS - CoV - 2 | | syntheticSeqsReads | Kraken2 | Number and percentage of reads classified as non - biological sequences | | quality_control_method_name | SSQuAWK | Name of the method or pipline used to evaluate sequence quality | | quality_control_method_version | 4.0.2 | Version number of the quality control pipeline or method used | | quality_control_determination | | Result of the quality control accessment. Blank if pass/fail thresholds have not been estabolished or "sequence flagged for potential quality control issues" if relevant. | | quality_control_issues | | More information for sequences that have a QC flag issue |
- The iVar_trim filter parameters: minReadLen = 30, minQual_slidingWindow = 20, and slidingWindow = 4 nt. Input Description Contigs Assembly Number of contigs in the de-novo SKESA assembly. Contigs smaller than 200 base-pairs (bp) are not counted. Length Assembly Total length of all contigs > 200bp. This should approximate the size of the genome for the target organism. EstCov Assembly Mean coverage for contigs in the SKESA assembly. N50 Assembly Sequence length of the shortest contig at 50% of the total genome length MedianInsert Read Distance between forward and reverse reads. Calculated by mapping reads to SKESA assembly using bwa. MeanLength_R1 Read Mean length of forward read MeanLength_R2 Read Mean length of reverse read MeanQ_R1 Read Mean Q-score of forward read MeanQ_R2 Read Mean Q-score of reverse read Scheme Assembly PubMLST (pubmlst.org) database scheme (e.g. senterica for Salmonella enterica) ST Assembly Sequence Type Loci Assembly gene (allele number) – for example aroC(118)
What is nucleotide coverage?! Let's look at 2 simple pictures

<img src="https://static.yanyin.tech/literature_test/protocol_io_true/protocols.io.kxygxzk5dv8j/iwivbn8q725.jpg" alt="In the figure above, each star, drawn on the burgundy line (reference genome) is a nucleotide position. There are 28 stars, so we will say our genome is 28 nucleotides long.We can use coverage to determine the quality of our sequences (blue lines).The lime green stars along the genome represent 0X coverage, because we did not sequence any reads with nucleotides positions covering that reference nucleotide position. There are no blue lines that we sequenced there!There are 3 nucleotide positions with 0x coverage. The total genome is 28 nucleotides long. percent_nt0Xcov = (nucleotidePositions0Xcov / genomeLength ) * 100 percent_nt0Xcov = (3 / 28) 100 percent_nt0xcov = 10.71%In most ideal scenarios, higher coverage indicates better sequence quality. For example, 100x coverage is better than 10x coverage. Since we want higher coverage, percent_nt0Xcov and percent_ntLess10Xcov are ideally lower percentages. 0x coverage and 10x coverage indicate "no coverage" and "poor coverage", respectively. Generally, we expect avgReadCov in 100's or 1000'sIf percent_nt0Xcov is a higher percentage, say 50%, that means half of the genome was not covered by our sequences. The quality is not ideal. * These values are not official threshold and only used for illustrative purposes. " loading="lazy" title="In the figure above, each star, drawn on the burgundy line (reference genome) is a nucleotide position. There are 28 stars, so we will say our genome is 28 nucleotides long.We can use coverage to determine the quality of our sequences (blue lines).The lime green stars along the genome represent 0X coverage, because we did not sequence any reads with nucleotides positions covering that reference nucleotide position. There are no blue lines that we sequenced there!There are 3 nucleotide positions with 0x coverage. The total genome is 28 nucleotides long. percent_nt0Xcov = (nucleotidePositions0Xcov / genomeLength ) * 100 percent_nt0Xcov = (3 / 28) 100 percent_nt0xcov = 10.71%In most ideal scenarios, higher coverage indicates better sequence quality. For example, 100x coverage is better than 10x coverage. Since we want higher coverage, percent_nt0Xcov and percent_ntLess10Xcov are ideally lower percentages. 0x coverage and 10x coverage indicate "no coverage" and "poor coverage", respectively. Generally, we expect avgReadCov in 100's or 1000'sIf percent_nt0Xcov is a higher percentage, say 50%, that means half of the genome was not covered by our sequences. The quality is not ideal. * These values are not official threshold and only used for illustrative purposes. "/>
Example output for the first 3 pairs run through the SSQuAWK4.0.2 workflow:
| A | B | C | D | E | F | G | H | I | J | K | L | M | N | O | P | Q | R | S |
|---|---|---|---|---|---|---|---|---|---|---|---|---|---|---|---|---|---|---|
| Sample | 0xGenomeCov | <10xGenomeCov | nReads | avgLen | avgLenPassFilt | avgQual | avgQualPassFilt | avgCovPassQual | readsAlign | readsAlignPassFilt | SNR | humanReads | SARS-CoV-2Reads | syntheticSeqsReads | quality_control_method_name | quality_control_method_version | quality_control_determination | quality_control_determination |
| SRR16828363.fastq.gz | 107nt (0%) | 138nt (0%) | 632664 | 151 | 151 | 37.8 | 37.9 | 688X | 138637 (21%) | 136327 (21%) | NA | 1517 reads (0.48%) | 71091 reads (22.47%) | 224206 reads (70.88%) | SSQuAWK | 4.0.2 | ||
| SRR16828364.fastq.gz | 76nt (0%) | 107nt (0%) | 458116 | 151 | 151 | 37.8 | 37.9 | 890X | 179913 (39%) | 176348 (38%) | NA | 863 reads (0.38%) | 90751 reads (39.62%) | 47920 reads (20.92%) | SSQuAWK | 4.0.2 | ||
| SRR16828365.fastq.gz | 76nt (0%) | 153nt (0%) | 351980 | 151 | 151 | 37.8 | 37.9 | 272X | 54928 (15%) | 53958 (15%) | NA | 874 reads (0.50%) | 27782 reads (15.79%) | 52862 reads (30.04%) | SSQuAWK | 4.0.2 |
QC metric guidance for QC attributes on SRA metadata
| A | B | C | D | E | F | G |
|---|---|---|---|---|---|---|
| QC bin | Subjectivedefinition | % Genomeuncovered(10X) | Averagecoverage | Otherobservations | SRAsubmission | FDA CFSANDashboard |
| A | No QC issues evident | ~5% | ~1000X | Majority of reads are SARS-CoV-2 | “quality_control_determination”= no quality control issues identified | Included |
| B | Minor QC issues | 6% - 40% | ~100X | “quality_control_determination”= minor quality control issues identified | Included | |
| C | Insufficient coverage | 40% - 95% | < 100X | Insufficient data mapped for confidence | “quality_control_determination”= sequence flagged for potential quality control issues | Excluded |
| F | Significant QC and/or study design issues | >95% | < 10X | Suspected contamination (SNR low),low sequence quality,other process errors identified | Do not submit | N/A |
Video Tutorial
Thanks for using SSQuAWK!

