Top Down Proteomics Data Collection for Microdissected Pancreas Tissue Functional Units

Mowei Zhou, Ljiljana.PasaTolic, James M Fulcher, Isaac Kwame Attah

Published: 2022-09-01 DOI: 10.17504/protocols.io.261ge3pw7l47/v1

Abstract

The protocol describes how to use laser capture microdissection (LCM) to cut small regions of interest (~200-300 μm) from tissue sections. This is followed by top down proteomics analysis by liquid chromatography - mass spectrometry (LC-MS).

Steps

Liquid chromatography (LC) method setup

1.

Set up reversed-phase LC system with online trapping for desalting.

Dual pump configuration

Mobile phase A (MPA): 0.2% formic acid in water (LCMS grade)

Mobile phase B (MPB): 0.2% formic acid in acetonitrile (LCMS grade)

Equipment

ValueLabel
NanoAcquityNAME
liquid chromatographyTYPE
WatersBRAND
186016002SKU
http://www.waters.com/waters/home.htm?locale=en_DKLINK
Dual pump configuration with autosampler 186016007SPECIFICATIONS
1.1.

Prepare the method for autosampler for microPOTS samples.

Note
For samples processed by the microPOTS protocol cited below, the LC vials will hold PCR tubes inside. The height of the syringe in the autosampler must be adjusted to avoid damage to the needle. This can be accessed within the nanoACQUITY Sample Manager Software. Select the autosampler and the "advanced" options. Under this tab, check the "Needle Placement (from bottom)" box. Adjust the needle placement to 10.2 mm from the bottom of the LC vial.

1.2.

Set up gradient method for samples.

Wash pump: 5 μL/min, 95% MPA, 5% MPB. Loading time 10 min.

Gradient pump: 0.3 μL/min

0 min: 95% MPA, 5% MPB

1 min: 90% MPA, 10% MPB

90 min: 40% MPA, 60% MPB

100 min: 95% MPA, 5% MPB

Note
Blank runs with high % MPB into both the trap and the analytical column can be added in between samples to minimize carry over. However, for the low sample loading in this case, blank is not absolutely necessary.

Mass spectrometer (MS) method setup

2.

Calibrate and set up the mass spectrometer method for sample runs.

2.1.

Perform both mass and system calibration following instrument vendor's recommendation.

Note
At minimum, "positive polarity" and "Orbitrap mass" calibrations need to be completed. System calibration is strongly recommended to ensure good performance for "Intact protein mode" and ETD.

2.2.

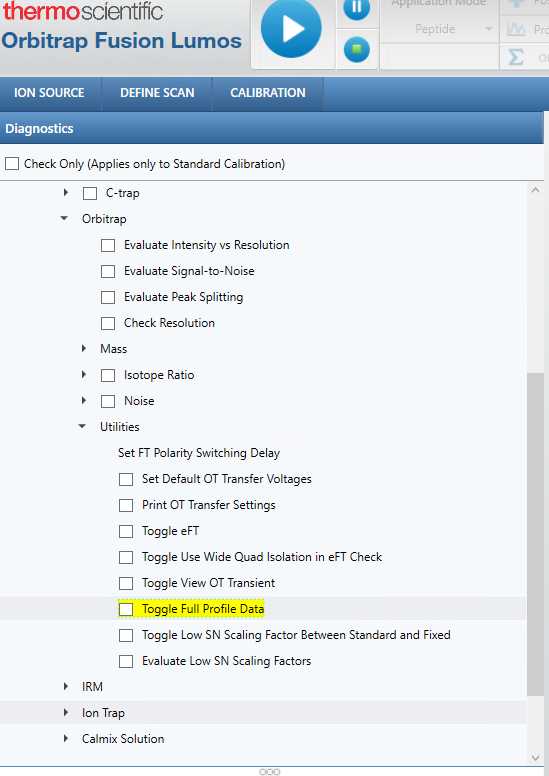
(Optional) Turn on full profile mode.

Under "Diagnosis" - "System" - "Orbitrap" - "Utilities", check "Toggle Full Profile Data" before starting the queue.

Note
Full profile mode will generate ~10 GB files per 100 min run. The raw data will save all the baseline signal (including noise), which may increase the likelihood of capturing low abundance species. Remember to toggle off the full profile mode after the queue to reset the instrument for regular experiments.

2.3.

Set up the data dependent acquisition method with the following parameters.

ETD method was used to obtain higher sequence coverage than CID for characterizing proteoforms. In addition, a ETD method with inclusion list for histones was used on some replicates to improve the analysis of histone modifications.

Sample method - CID

Note
Global Settings Use Static Source Gasses Use Ion Source Settings from Tune = Checked Method Duration (min)= 100 Spray Voltage = Static Gas Mode = Static Infusion Mode (LC)= False FAIMS Mode = Not Installed Application Mode = Peptide Pressure Mode = Standard Default Charge State = 6 Advanced Peak Determination = TrueExperiment 1 Experiment Name = MS Start Time (min) = 0 End Time (min) = 100 Scan MasterScan Desired minimum points across the peak = 6 MSn Level = 1 Use Wide Quad Isolation = True Detector Type = Orbitrap Orbitrap Resolution = 120K Mass Range = Normal Scan Range (m/z) = 500-2000 Maximum Injection Time (ms) = 500 AGC Target = 1000000 Normalized AGC Target = 250% Microscans = 2 Maximum Injection Time Type = Custom RF Lens (%) = 30 Use ETD Internal Calibration = False DataType = Profile Polarity = Positive Source Fragmentation = False Scan Description = Enhanced Resolution Mode = Off Filter ChargeState Include charge state(s) = 3-35 Include undetermined charge states = False Filter DynamicExclusion Exclude after n times = 1 Exclusion duration (s) = 30 Mass Tolerance = mz Mass tolerance low = 1 Mass tolerance high = 1 Use Common Settings = False Exclude isotopes = True Perform dependent scan on single charge state per precursor only = True Data Dependent Properties Data Dependent Mode= Number of Scans Number of Dependent Scans= 1 (for sample run); 4 or 8 (for library run) Scan Event 1 Scan ddMSnScan Desired minimum points across the peak = 6 MSn Level = 2 Isolation Mode = Quadrupole Enable Intelligent Product Acquisition for MS2 Isolation = False Isolation Window = 2 Isolation Offset = Off Reported Mass = Original Mass Multi-notch Isolation = False Scan Range Mode = Auto Scan Priority= 1 Collision Energy Mode = Fixed ActivationType = CID Collision Energy (%) = 35 Activation Time (ms) = 10 Activation Q = 0.25 Multistage Activation = False Detector Type = Orbitrap Orbitrap Resolution = 60K Maximum Injection Time (ms) = 200 AGC Target = 500000 Inject ions for all available parallelizable time = False Normalized AGC Target = 1000% Microscans = 1 Maximum Injection Time Type = Custom Use ETD Internal Calibration = False DataType = Profile Polarity = Positive Source Fragmentation = False Scan Description = Time Mode = Unscheduled Enhanced Resolution Mode = Off

Sample method - ETD

Note
Global Settings Use Static Source Gasses Use Ion Source Settings from Tune = Checked Method Duration (min)= 100 Spray Voltage = Static Gas Mode = Static Infusion Mode (LC)= False FAIMS Mode = Not Installed Application Mode = Peptide Pressure Mode = Standard Default Charge State = 6 Advanced Peak Determination = TrueExperiment 1 Experiment Name = MS Start Time (min) = 0 End Time (min) = 100 Scan MasterScan Desired minimum points across the peak = 6 MSn Level = 1 Use Wide Quad Isolation = True Detector Type = Orbitrap Orbitrap Resolution = 120K Mass Range = Normal Scan Range (m/z) = 500-2000 Maximum Injection Time (ms) = 200 AGC Target = 1000000 Normalized AGC Target = 250% Microscans = 2 Maximum Injection Time Type = Custom RF Lens (%) = 30 Use ETD Internal Calibration = False DataType = Profile Polarity = Positive Source Fragmentation = False Scan Description = Enhanced Resolution Mode = Off Filter ChargeState Include charge state(s) = 5-35 Include undetermined charge states = False Filter IntensityThreshold Maximum Intensity = 1E+20 Minimum Intensity = 20000 Relative Intensity Threshold = 20 Intensity Filter Type = IntensityThreshold Filter DynamicExclusion Exclude after n times = 1 Exclusion duration (s) = 30 Mass Tolerance = mz Mass tolerance low = 1 Mass tolerance high = 1 Use Common Settings = False Exclude isotopes = True Perform dependent scan on single charge state per precursor only = True Data Dependent Properties Data Dependent Mode= Number of Scans Number of Dependent Scans= 5Scan Event 1 Filter PrecursorPriority HighestChargeState Scan ddMSnScan Desired minimum points across the peak = 6 MSn Level = 2 Isolation Mode = Quadrupole Enable Intelligent Product Acquisition for MS2 Isolation = False Isolation Window = 2 Isolation Offset = Off Reported Mass = Original Mass Multi-notch Isolation = False Scan Range Mode = Auto Scan Priority= 1 ActivationType = ETD Use calibrated charge dependent ETD parameters = False ETD Reaction Time (ms) = 15 ETD Reagent Target = 700000 Max ETD Reagent Injection Time (ms) = 200 ETD Supplemental Activation = False Detector Type = Orbitrap Orbitrap Resolution = 60K Maximum Injection Time (ms) = 250 AGC Target = 500000 Inject ions for all available parallelizable time = False Normalized AGC Target = 1000% Microscans = 1 Maximum Injection Time Type = Custom Use ETD Internal Calibration = False DataType = Profile Polarity = Positive Source Fragmentation = False Scan Description = Time Mode = Unscheduled Enhanced Resolution Mode = Off

Histone target inclusion list (H4 and H3) for ETD method

Note
>>>>>>>>>>>>> Mass List Table <<<<<<<<<<<<<< CompoundName| m/z| t start (min)| t stop (min)| H4 16+| 706.72| 41| 45| H4 Ac me2| 707.59| 41| 45| H4 Ac me3| 708.47| 41| 45| H4 Ac me4| 709.34| 41| 45| H4 Ac me5| 710.22| 41| 45| H4 Ac me6| 711.1| 41| 45| H4 Ac me7| 712.03| 41| 45| H4 Ac me8| 712.91| 41| 45| H4 17+| 665.21| 41| 45| H4 Ac me3| 666.85| 41| 45| H4 Ac me4| 667.68| 41| 45| H4 Ac me5| 668.5| 41| 45| H4 Ac me6| 669.33| 41| 45| H4 Ac me7| 670.2| 41| 45| H4 Ac me8| 670.97| 41| 45| H3 me1 23+| 662.2| 50| 55| H3 me2| 662.9| 50| 55| H3 me3| 663.51| 50| 55| H3 me4| 664.12| 50| 55| H3 me5| 664.77| 50| 55| H3 me6| 665.38| 50| 55| H3 me7| 665.99| 50| 55| H3 me8| 666.6| 50| 55| H3 me9| 667.21| 50| 55| H3 me10| 667.86| 50| 55| H3 me11| 668.47| 50| 55| H3 me12| 669.08| 50| 55| H3 me13| 669.68| 50| 55| H3 me14| 670.38| 50| 55| H3 me15| 670.9| 50| 55| H3 me16| 671.55| 50| 55| H3 me1 22+| 692.39| 50| 55| H3 me2| 692.94| 50| 55| H3 me3| 693.67| 50| 55| H3 me4| 694.26| 50| 55| H3 me5| 694.94| 50| 55| H3 me6| 695.58| 50| 55| H3 me7| 696.21| 50| 55| H3 me8| 696.85| 50| 55| H3 me9| 697.49| 50| 55| H3 me10| 698.17| 50| 55| H3 me11| 698.76| 50| 55| H3 me12| 699.44| 50| 55| H3 me13| 700.17| 50| 55| H3 me14| 700.81| 50| 55| H3 me15| 701.4| 50| 55| H3 me16| 701.94| 50| 55|>>>>>>>>>>>>> End Mass List Table <<<<<<<<<<<<<<

Instrument Quality Control (QC) and method setup

3.

A QC standard is used to evaluate instrument performance before starting samples.

Herein we use a bacterial lysate established in our lab (see reference below for more information), other samples can be used as QC as well.

Citation
Shen Y, Tolić N, Piehowski PD, Shukla AK, Kim S, Zhao R, Qu Y, Robinson E, Smith RD, Paša-Tolić L 2017 High-resolution ultrahigh-pressure long column reversed-phase liquid chromatography for top-down proteomics. Journal of chromatography. A https://doi.org/10.1016/j.chroma.2017.01.008

QC Sample information

Intact protein lysate from cultured Shewanella oneidensis MR-1 cells

Buffer preparation :

Homogenization buffer ( HB ) : 8M urea solution (480 mg/mL) in 50 mM ABC with 15 mM TCEP

Note: Use BondBreaker 0.5 M TCEP stock solution

Wash Buffer ( WB ): 0.2% formic acid, 5% acetonitrile

Note: Use LC-MS grade water

Note
NOTE: Adjust centrifugal filtration speeds and times as appropriate for your sample type and filter size.It is recommended to do all spin steps at 10°C (8 M urea will freeze at 4°C ).

  1. Lyse cells or homogenize tissue in homogenization buffer (HB).
  2. Incubate sample at room temperature for 30 min to extract and denature proteins
  3. Centrifuge lysate at 14,000 x G, 10C for 10 minutes to pellet cell debris
  4. Transfer supernatant to 100K MWCO filter and centrifuge at 14,000 x G until minimum volume is reached.
  5. Wash 100K spin filter with 1X max volume of HB, spin at 14,000 x G until minimum volume is reached.
  6. Transfer filtrate from 100K filter to a fresh 10K filter and centrifuge at 14,000 x G for time needed to get to minimum volume. a. If needed, add multiple aliquots of filtrate from 100K filter to the same 10K filter
  7. Wash 10K filter three times with wash buffer (WB) and spin to minimum volume each wash.
  8. Perform Coomassie or BCA protein assay.
  9. Dilute sample to 0.01 ug/uL in WB and aliquot 100 uL into separate 0.6 mL Eppendorf tubes with labels.
3.1.

QC LCMS method

LC method

Wash pump: 5 μL/min, 95% MPA, 5% MPB. Loading time 15 min.

Gradient pump: 0.3 μL/min

0 min: 95% MPA, 5% MPB

180 min: 55% MPA, 45% MPB

Followed by a blank injection to wash the column before sample runs

MS method

Note
Global Settings Use Static Source Gasses Use Ion Source Settings from Tune = Checked Method Duration (min)= 180 Spray Voltage = Static Gas Mode = Static Infusion Mode (LC)= False FAIMS Mode = Not Installed Application Mode = Intact Protein Pressure Mode = Low Pressure Default Charge State = 10 Advanced Peak Determination = TrueExperiment 1 Experiment Name = MS Start Time (min) = 0 End Time (min) = 180 Scan MasterScan Desired minimum points across the peak = 6 MSn Level = 1 Use Wide Quad Isolation = True Detector Type = Orbitrap Orbitrap Resolution = 120K Mass Range = Normal Scan Range (m/z) = 500-2000 Maximum Injection Time (ms) = 400 AGC Target = 1000000 Normalized AGC Target = 250% Microscans = 4 Maximum Injection Time Type = Custom RF Lens (%) = 30 Use ETD Internal Calibration = False DataType = Profile Polarity = Positive Source Fragmentation = True Energy (V) = 15 Scan Description = Enhanced Resolution Mode = Off Filter ChargeState Include charge state(s) = 4-35 Include undetermined charge states = False Filter DynamicExclusion Exclude after n times = 1 Exclusion duration (s) = 30 Mass Tolerance = mz Mass tolerance low = 1.5 Mass tolerance high = 1.5 Use Common Settings = False Exclude isotopes = True Perform dependent scan on single charge state per precursor only = True Data Dependent Properties Data Dependent Mode= Number of Scans Number of Dependent Scans= 4Scan Event 1 Scan ddMSnScan Desired minimum points across the peak = 6 MSn Level = 2 Isolation Mode = Quadrupole Enable Intelligent Product Acquisition for MS2 Isolation = False Isolation Window = 3 Isolation Offset = Off Reported Mass = Original Mass Multi-notch Isolation = False Scan Range Mode = Define m/z range Scan Priority= 1 Collision Energy Mode = Fixed ActivationType = CID Collision Energy (%) = 35 Activation Time (ms) = 10 Activation Q = 0.25 Multistage Activation = False Detector Type = Orbitrap Orbitrap Resolution = 60K Scan Range (m/z) = 400-2000 Maximum Injection Time (ms) = 200 AGC Target = 500000 Inject ions for all available parallelizable time = False Normalized AGC Target = 1000% Microscans = 2 Maximum Injection Time Type = Custom Use ETD Internal Calibration = False DataType = Profile Polarity = Positive Source Fragmentation = False Scan Description = Time Mode = Unscheduled Enhanced Resolution Mode = Off

Data collection and QC metric

4.

Queue the QC sample before starting the samples using the LCMS method described in section 3. QC runs need to pass the metrics defined below. Once passed, queue the sample runs using the LCMS method described in section 2.

4.1.

Evaluation of QC data ( Shewanella lysate from section 3)

To quickly evaluate the QC data, open them in the Thermo Scientific Freestyle software or Xcalibur QualBrowser. The following metrics are inspected to ensure that the LCMS run meets the expected standard.

1. Signal levels

The intensity levels at the total ion current (TIC), base peak intensity (BPI), and the MS2 spectra are inspected to ensure that they meet the expected intensity levels. The TIC intensity levels are typically expected to be above the 1e10 level, BPI at or above 1e8 level, and the MS2 spectra ion current from 1e5 to 1e7 levels.
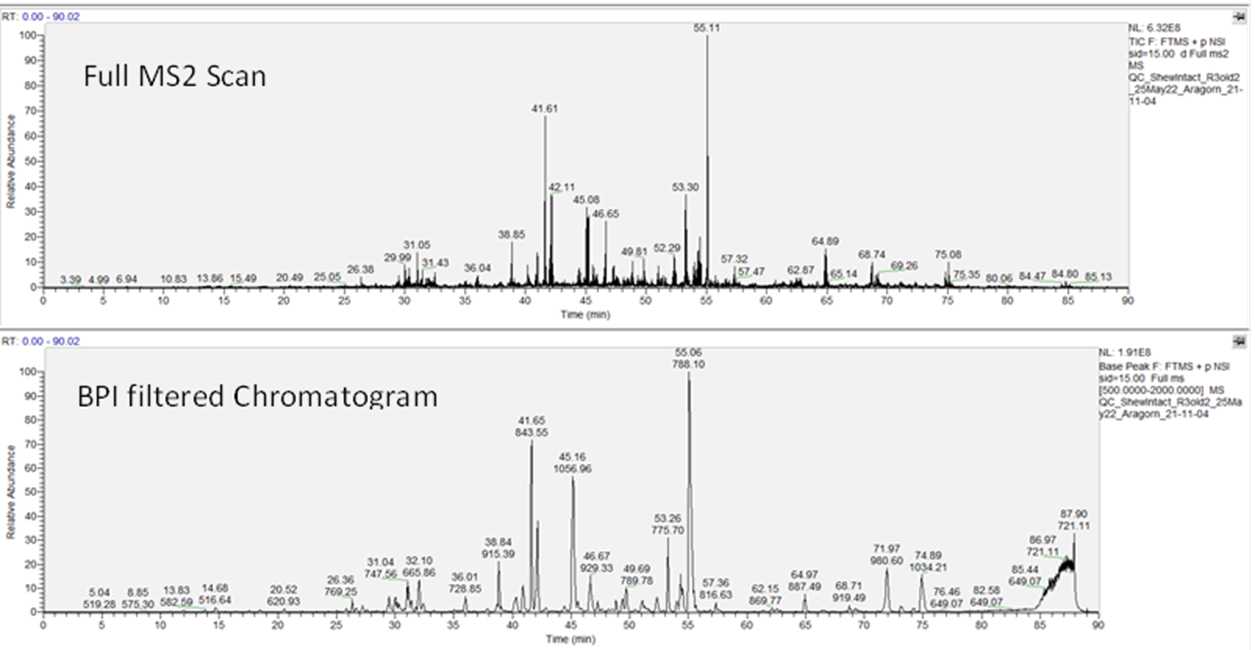
2. Chromatography

2a.

We look at the chromatography distribution using the base peak FTMS scan as filter to ensure that the eluted peaks are well distributed through the LC run. The chromatogram is filtered to show the BPI peaks and inspected to ensure no peak broadening (early or late) is observed.

Chromatogram filtered using the BPI to show the peak distribution.

2b.

The distribution of the MS2 peaks (fragmentation of peaks selected at the MS1 level) is inspected to evaluate how similar the distribution is to that of the MS1 level. The MS2 distribution is expected to emulate what is observed for the peak distribution of the MS1 when the BPI filter is applied, indicating that peak selection for fragmentation was performed at an appreciable level. To assess the MS2 fragmentation signal, the “full MS2” is applied as the filter to show the MS2 distribution through the whole experiment.

2c.

Finally, QC samples are analyzed with TopPIC to ensure appropriate number of proteoforms and proteoform spectrum matches (PrSMs) are being identified.

Software

ValueLabel
TopPIC SuiteNAME
https://github.com/toppic-suite/toppic-suiteREPOSITORY
Xiaowen LiuDEVELOPER
https://www.toppic.org/software/toppic/index.htmlLINK
1.4.13.1VERSION

Proteoforms are counted by opening the exported "..._proteoforms.tsv" file and PrSMs through the "..._PrSMs.tsv" file. The QC passing threshold for proteoforms is 1,000 and 2,000 for PrSMs.

Quality Assurance (QA) of HubMAP Samples

5.

Perform proteoform identification using the "TopPIC processing" section in the following protocol.

Citation
James M Fulcher, Yen-Chen Liao, Mowei Zhou, Ljiljana.PasaTolic Proteoform Identification and Quantitation with TopPIC and TDPortal for Human Tissues dx.doi.org/10.17504/protocols.io.3byl4bpj2vo5/v1

5.1.

Using the TopPIC PrSM results (after TopPICR post-processing), kidney samples are filtered based on the total number of PrSMs. A cutoff of 100 PrSMs was used to remove samples that were of lower quality.

推荐阅读

Nature Protocols
Protocols IO
Current Protocols
扫码咨询