Reproducible mass spectrometry data processing and compound annotation in MZmine 3
Daniel Petras, Steffen Heuckeroth, Tito Damiani, Aleksandr Smirnov, Olena Mokshyna, Corinna Brungs, Ansgar Korf, Joshua David Smith, Paolo Stincone, Nicola Dreolin, Louis-Félix Nothias, Tuulia Hyötyläinen, Matej Orešič, Uwe Karst, Pieter C. Dorrestein, Xiuxia Du, Justin J. J. van der Hooft, Robin Schmid, Tomáš Pluskal

Extended
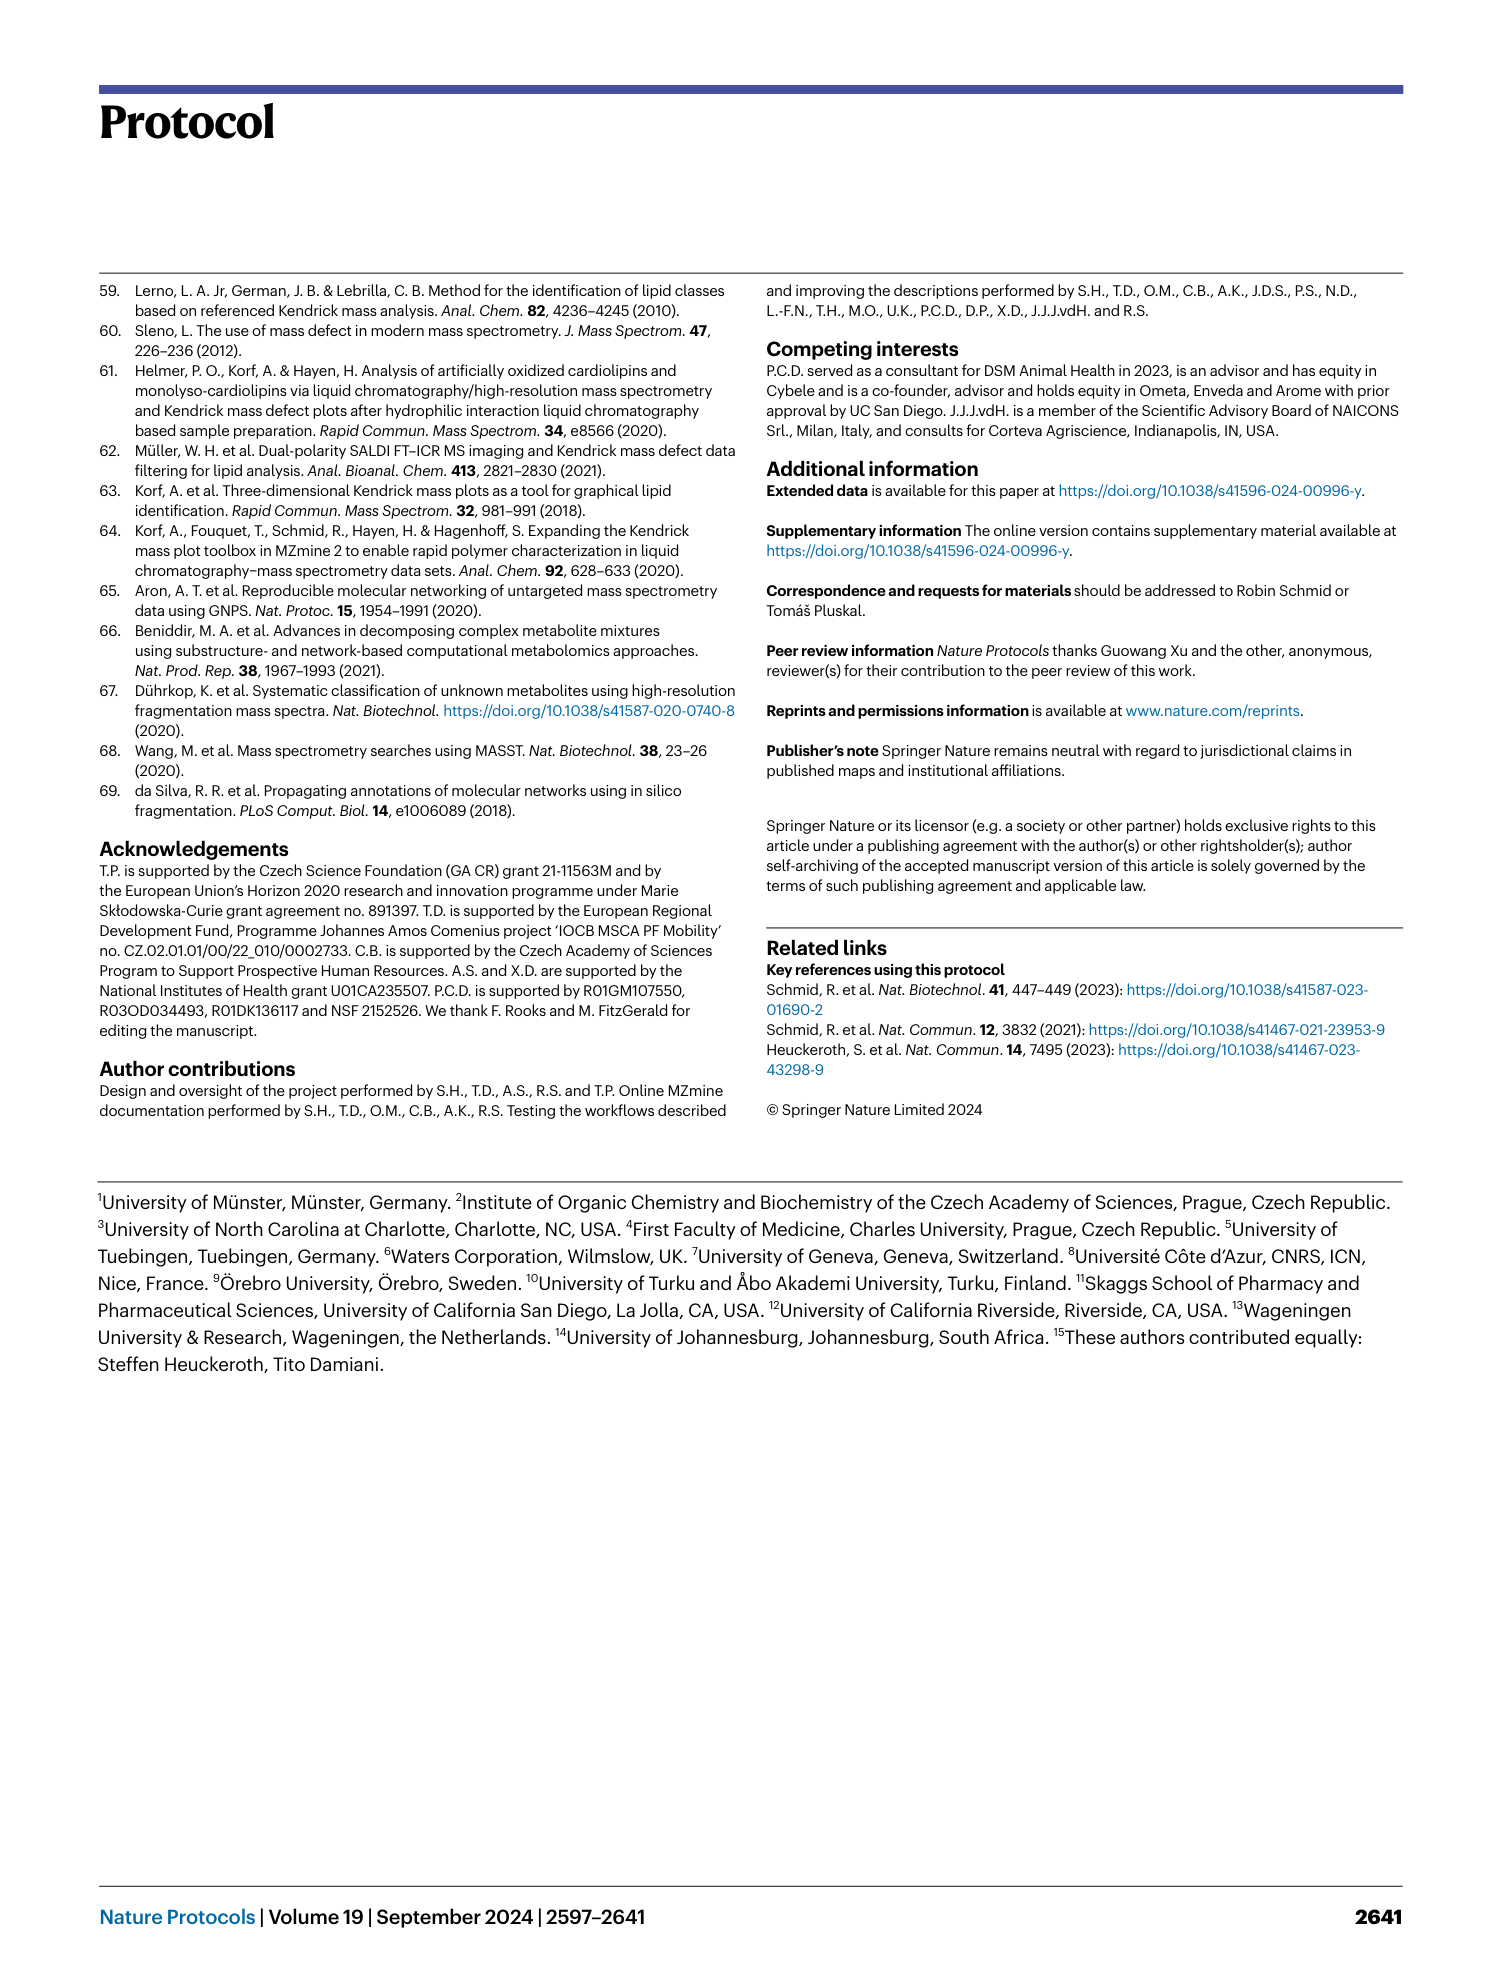
Extended Data Fig. 1 Screenshot of the batch mode dialogue box.
The current processing steps are displayed in the ‘Batch queue’ panel. Additional steps can be selected from the ‘Modules’ panel and included using the double-arrows buttons. The current batch file can be saved using the ‘Save’ button whereas other batch files can be imported using the ‘Load’ button. Some modules offer a ‘Show preview’ option that can be opened by ticking the corresponding checkbox. For the preview to work, data must be already imported in MZmine. The online documentation for each processing module can be opened using the ‘Help’ button.
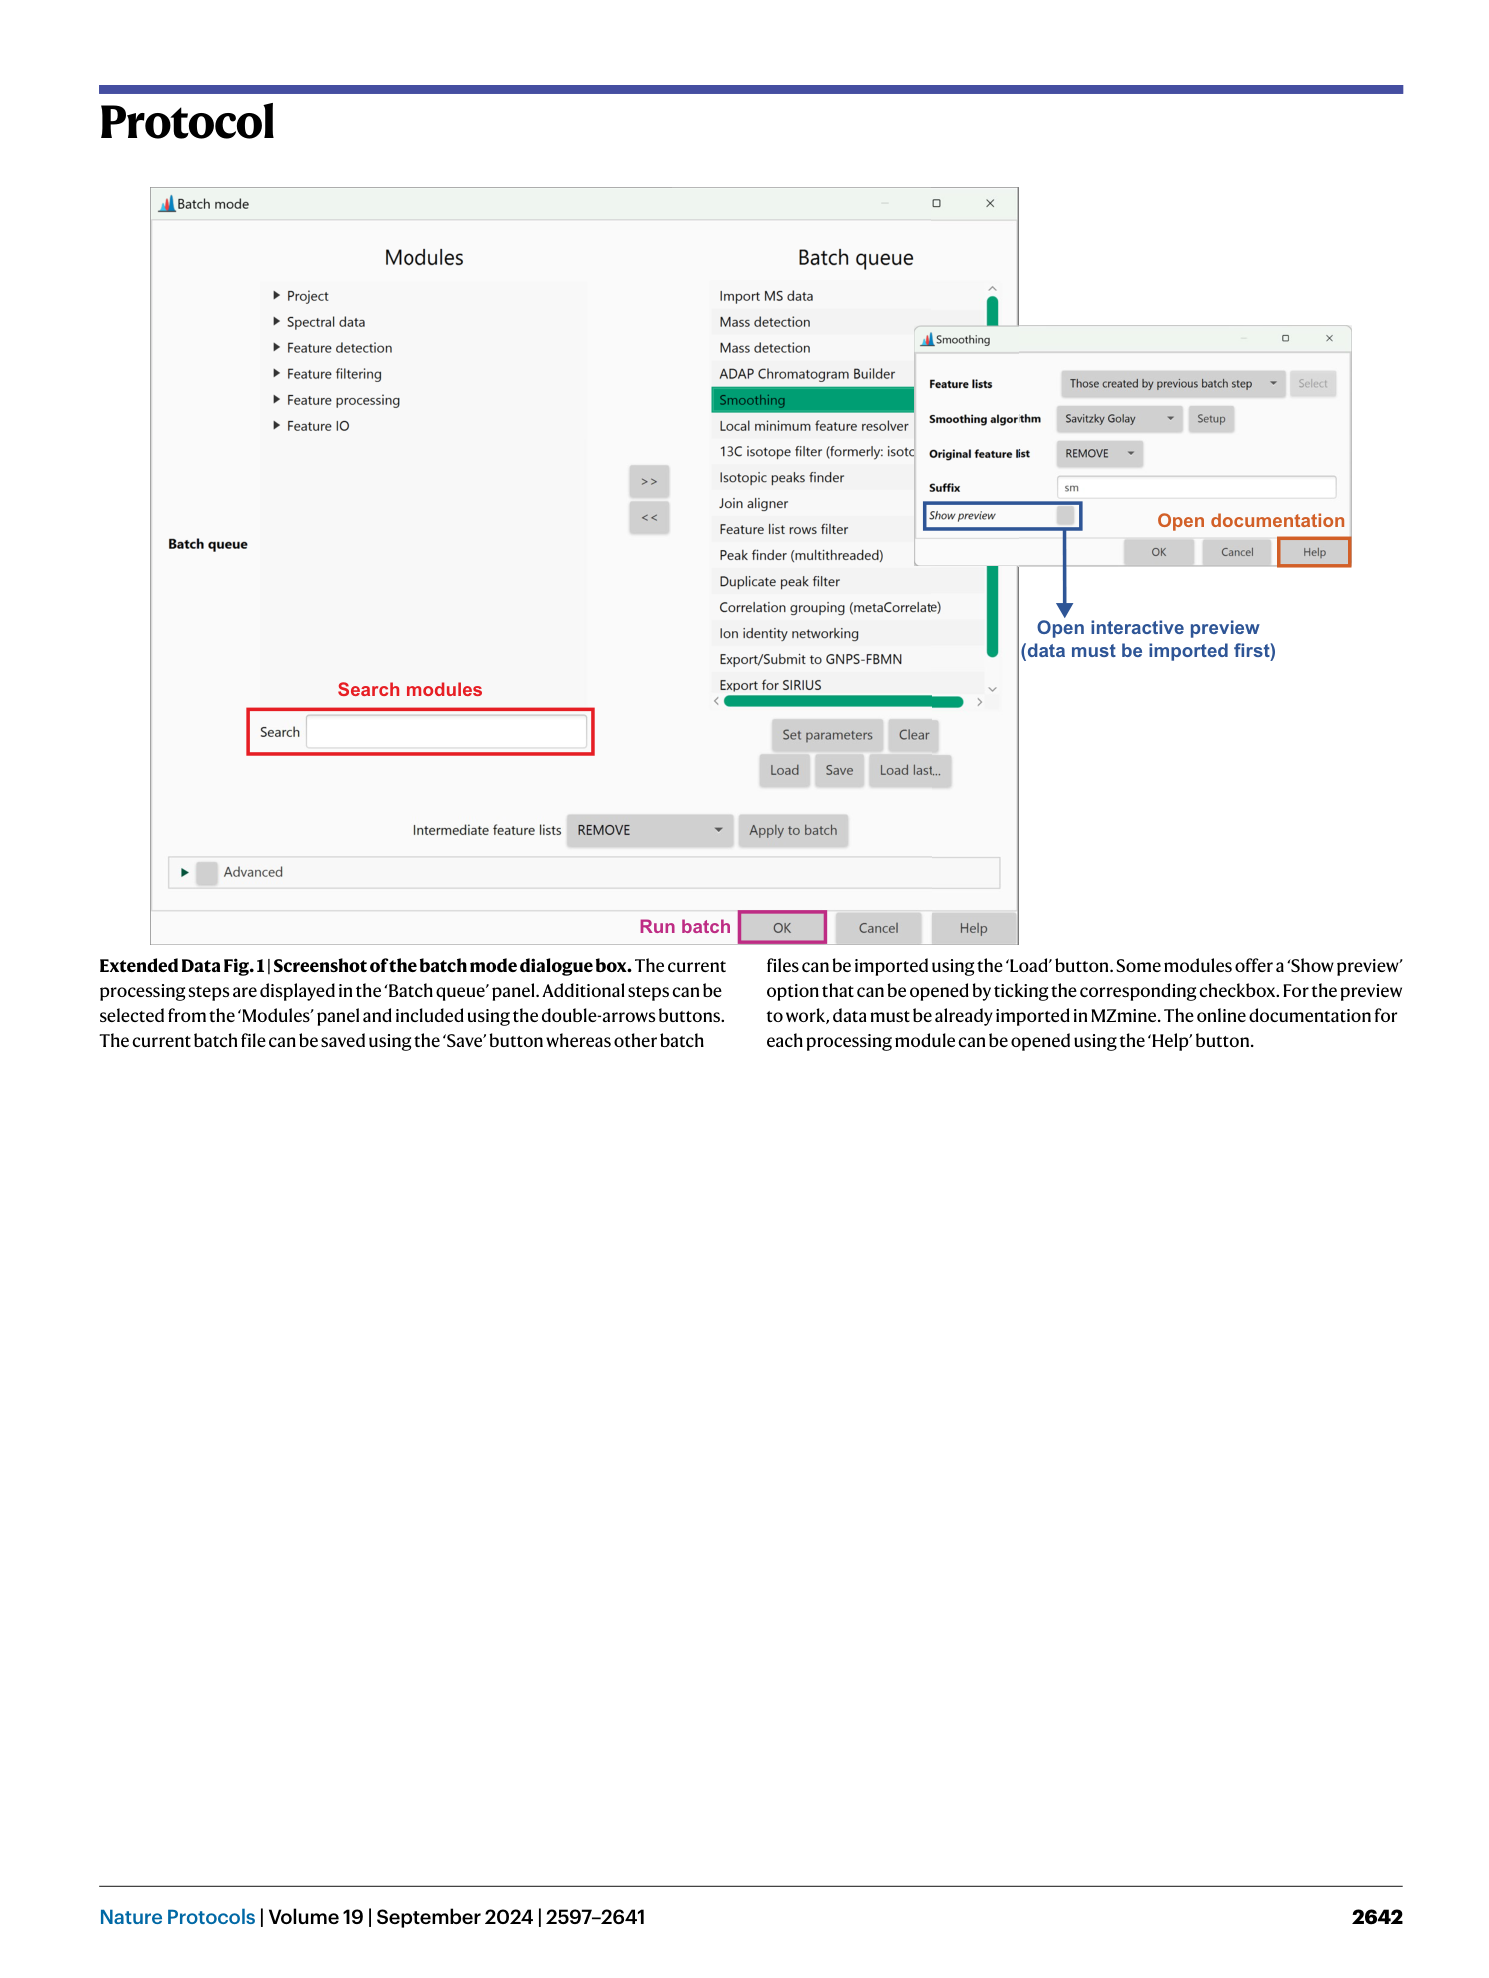
Extended Data Fig. 2 Screenshot of the ‘Raw data overview’ module.
The module displays three panels: chromatogram panel (left), mass spectrum panel (right) and scan information panel (bottom panel), which contains information for every scan in the data file.
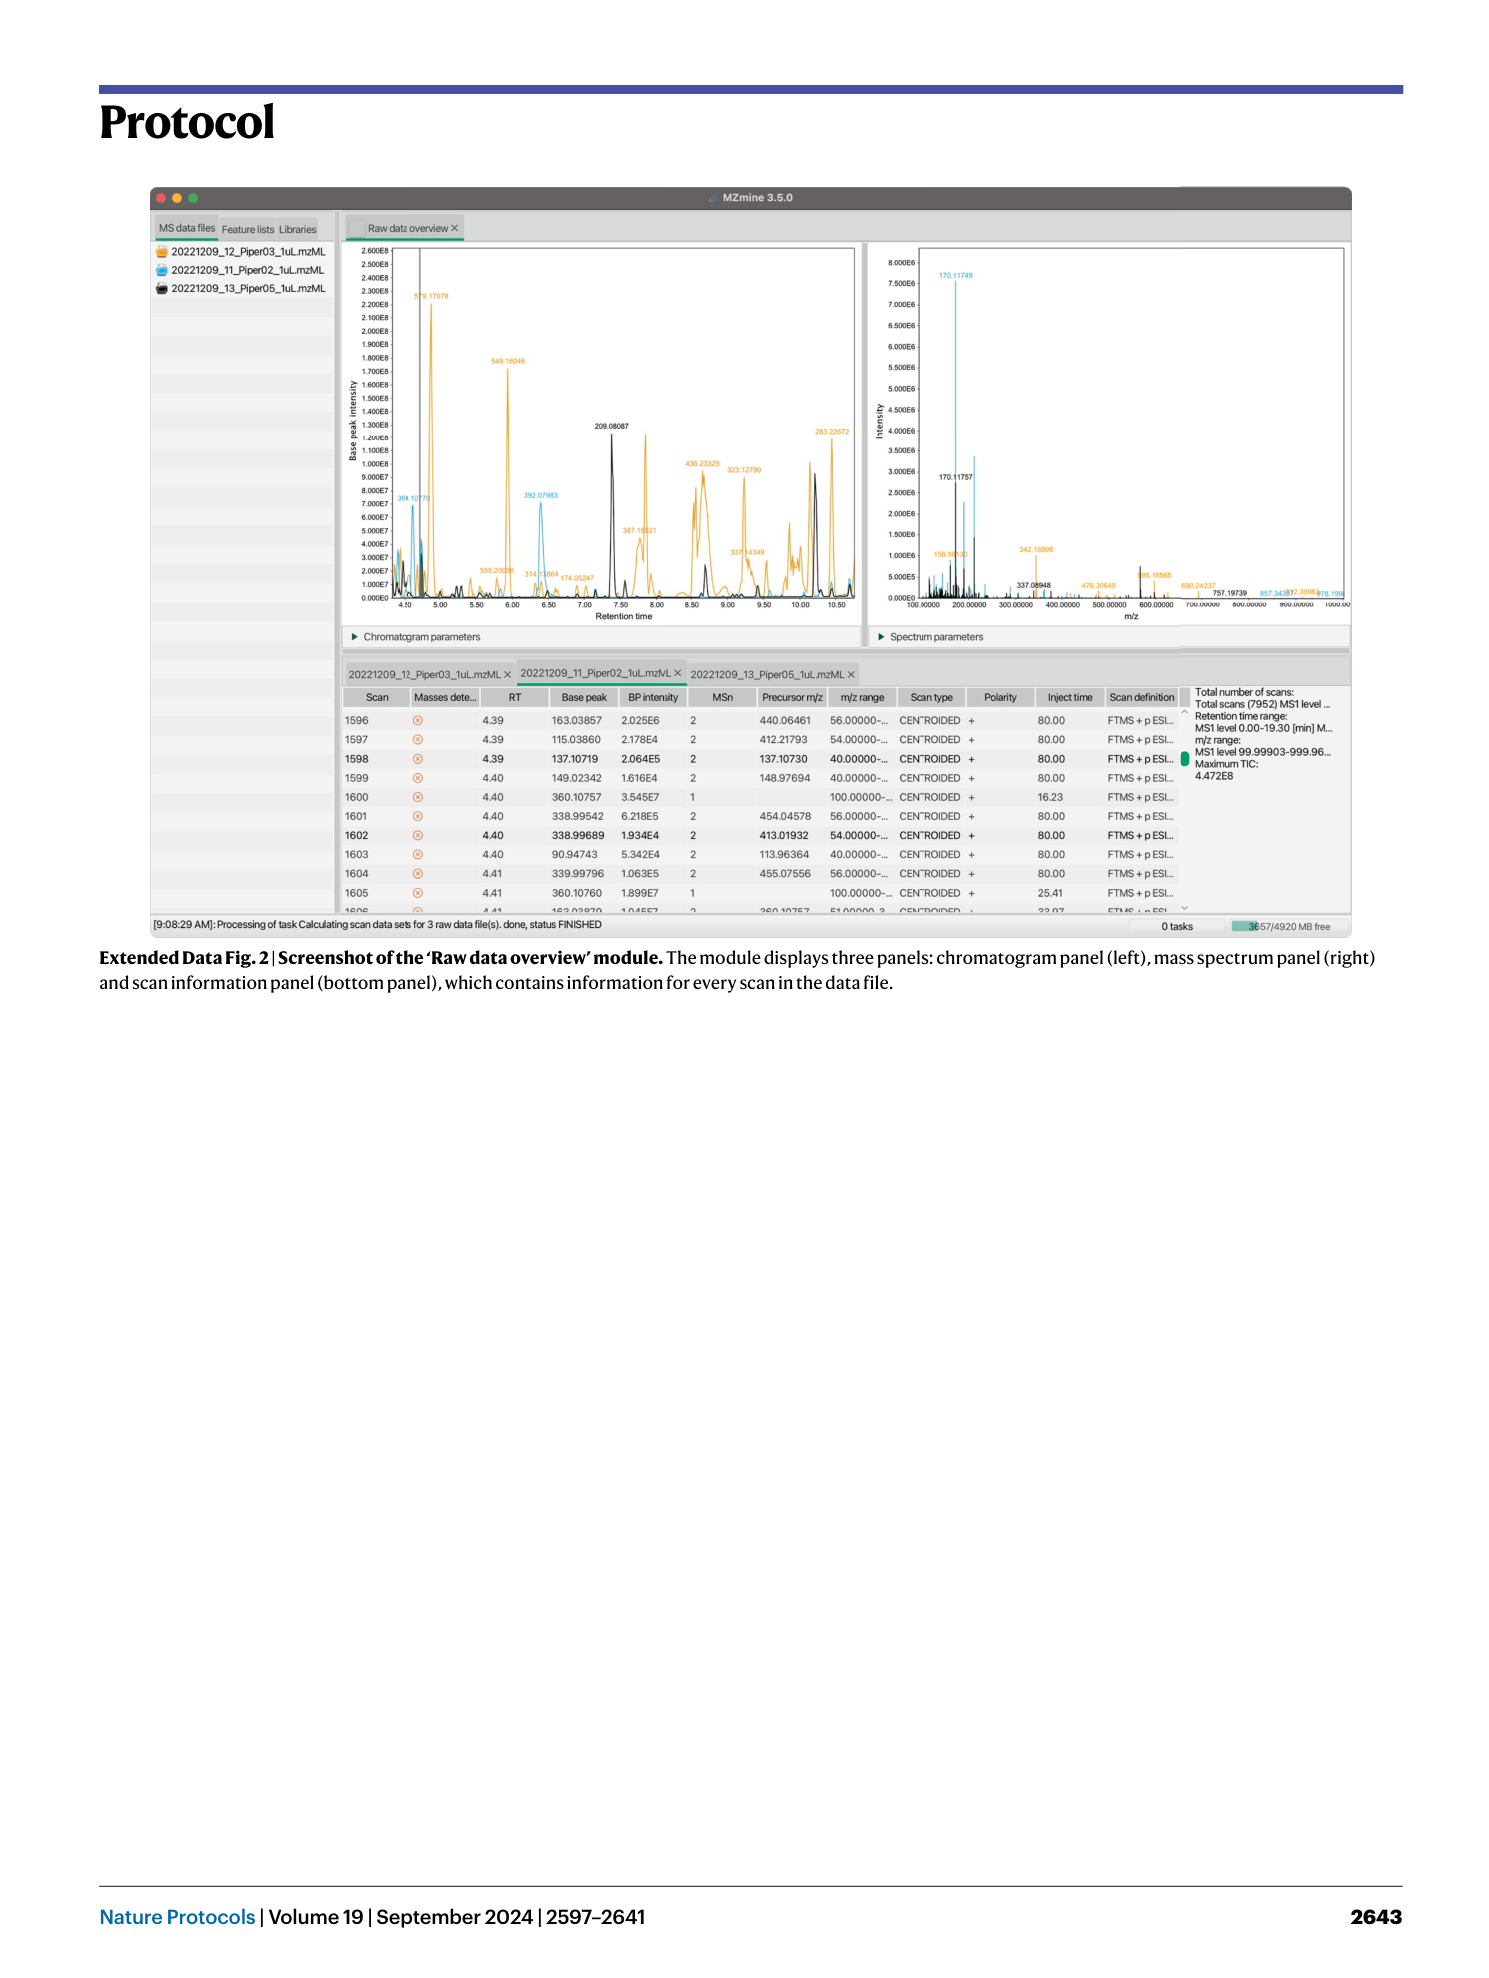
Extended Data Fig. 3 Screenshot of the interactive visualisation panel in the Local minimum resolver module.
Two subpanels are present: one for ‘noisy’ and one for ‘good’ EIC traces. The goal of the parameters optimization is to ensure detection of true features while minimising ‘noisy’ peaks to be retained as features. Feature lists and EIC traces to display can be chosen from the corresponding drop-down menus. Detected features are colour-filled and resolved peaks are shown in different colours.
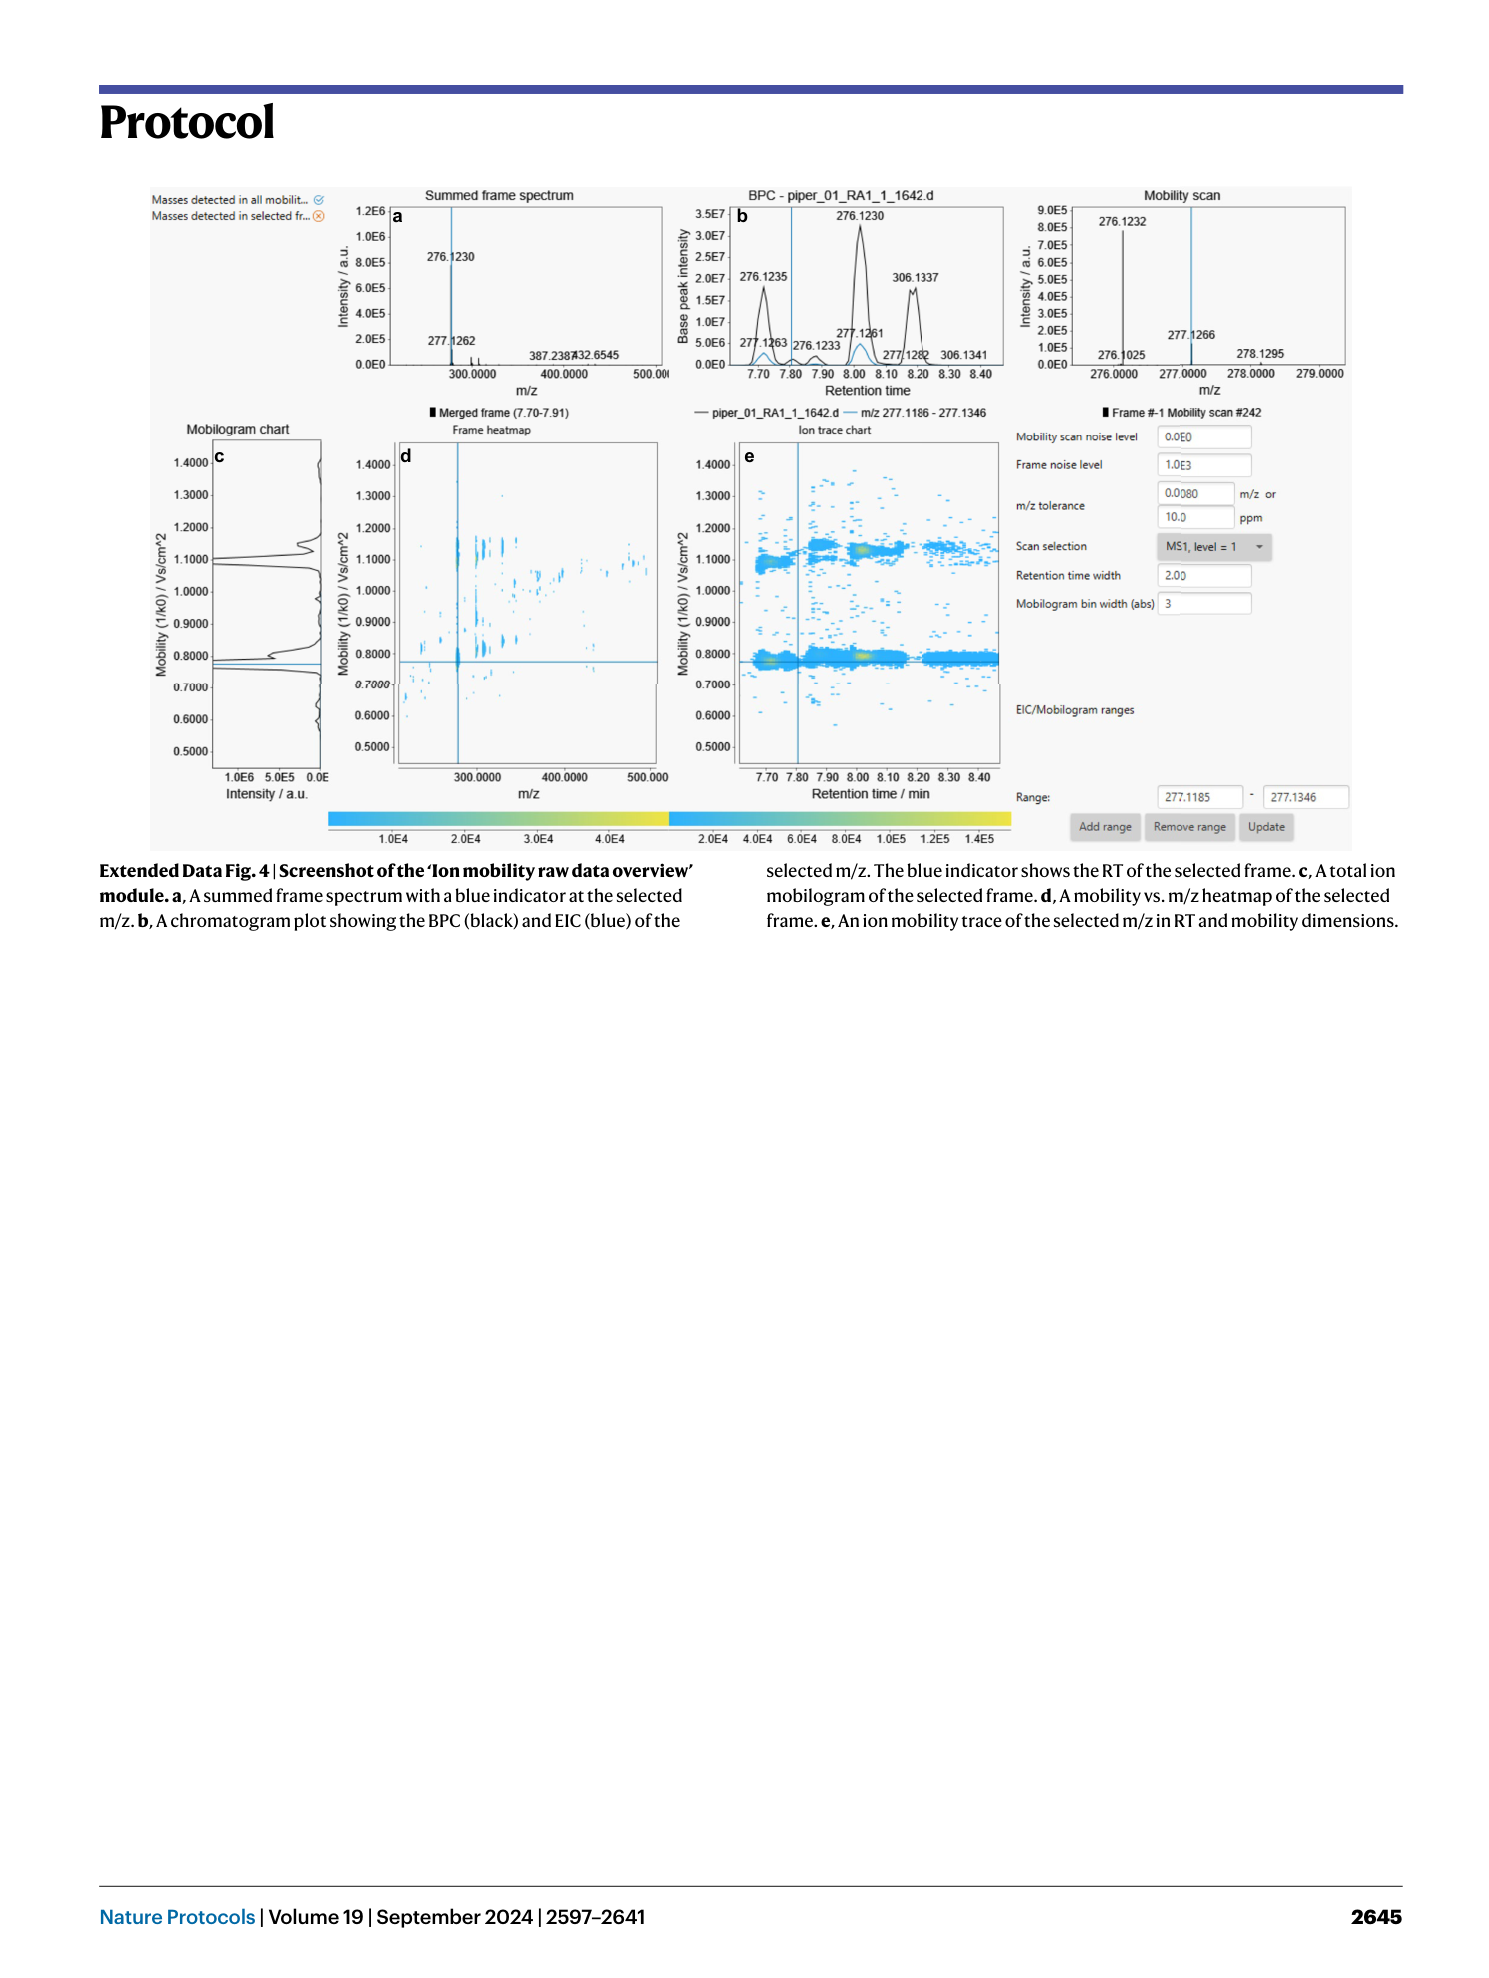
Extended Data Fig. 4 Screenshot of the ‘Ion mobility raw data overview’ module.
a , A summed frame spectrum with a blue indicator at the selected m/z. b , A chromatogram plot showing the BPC (black) and EIC (blue) of the selected m/z. The blue indicator shows the RT of the selected frame. c , A total ion mobilogram of the selected frame. d , A mobility vs. m/z heatmap of the selected frame. e , An ion mobility trace of the selected m/z in RT and mobility dimensions.
Supplementary information
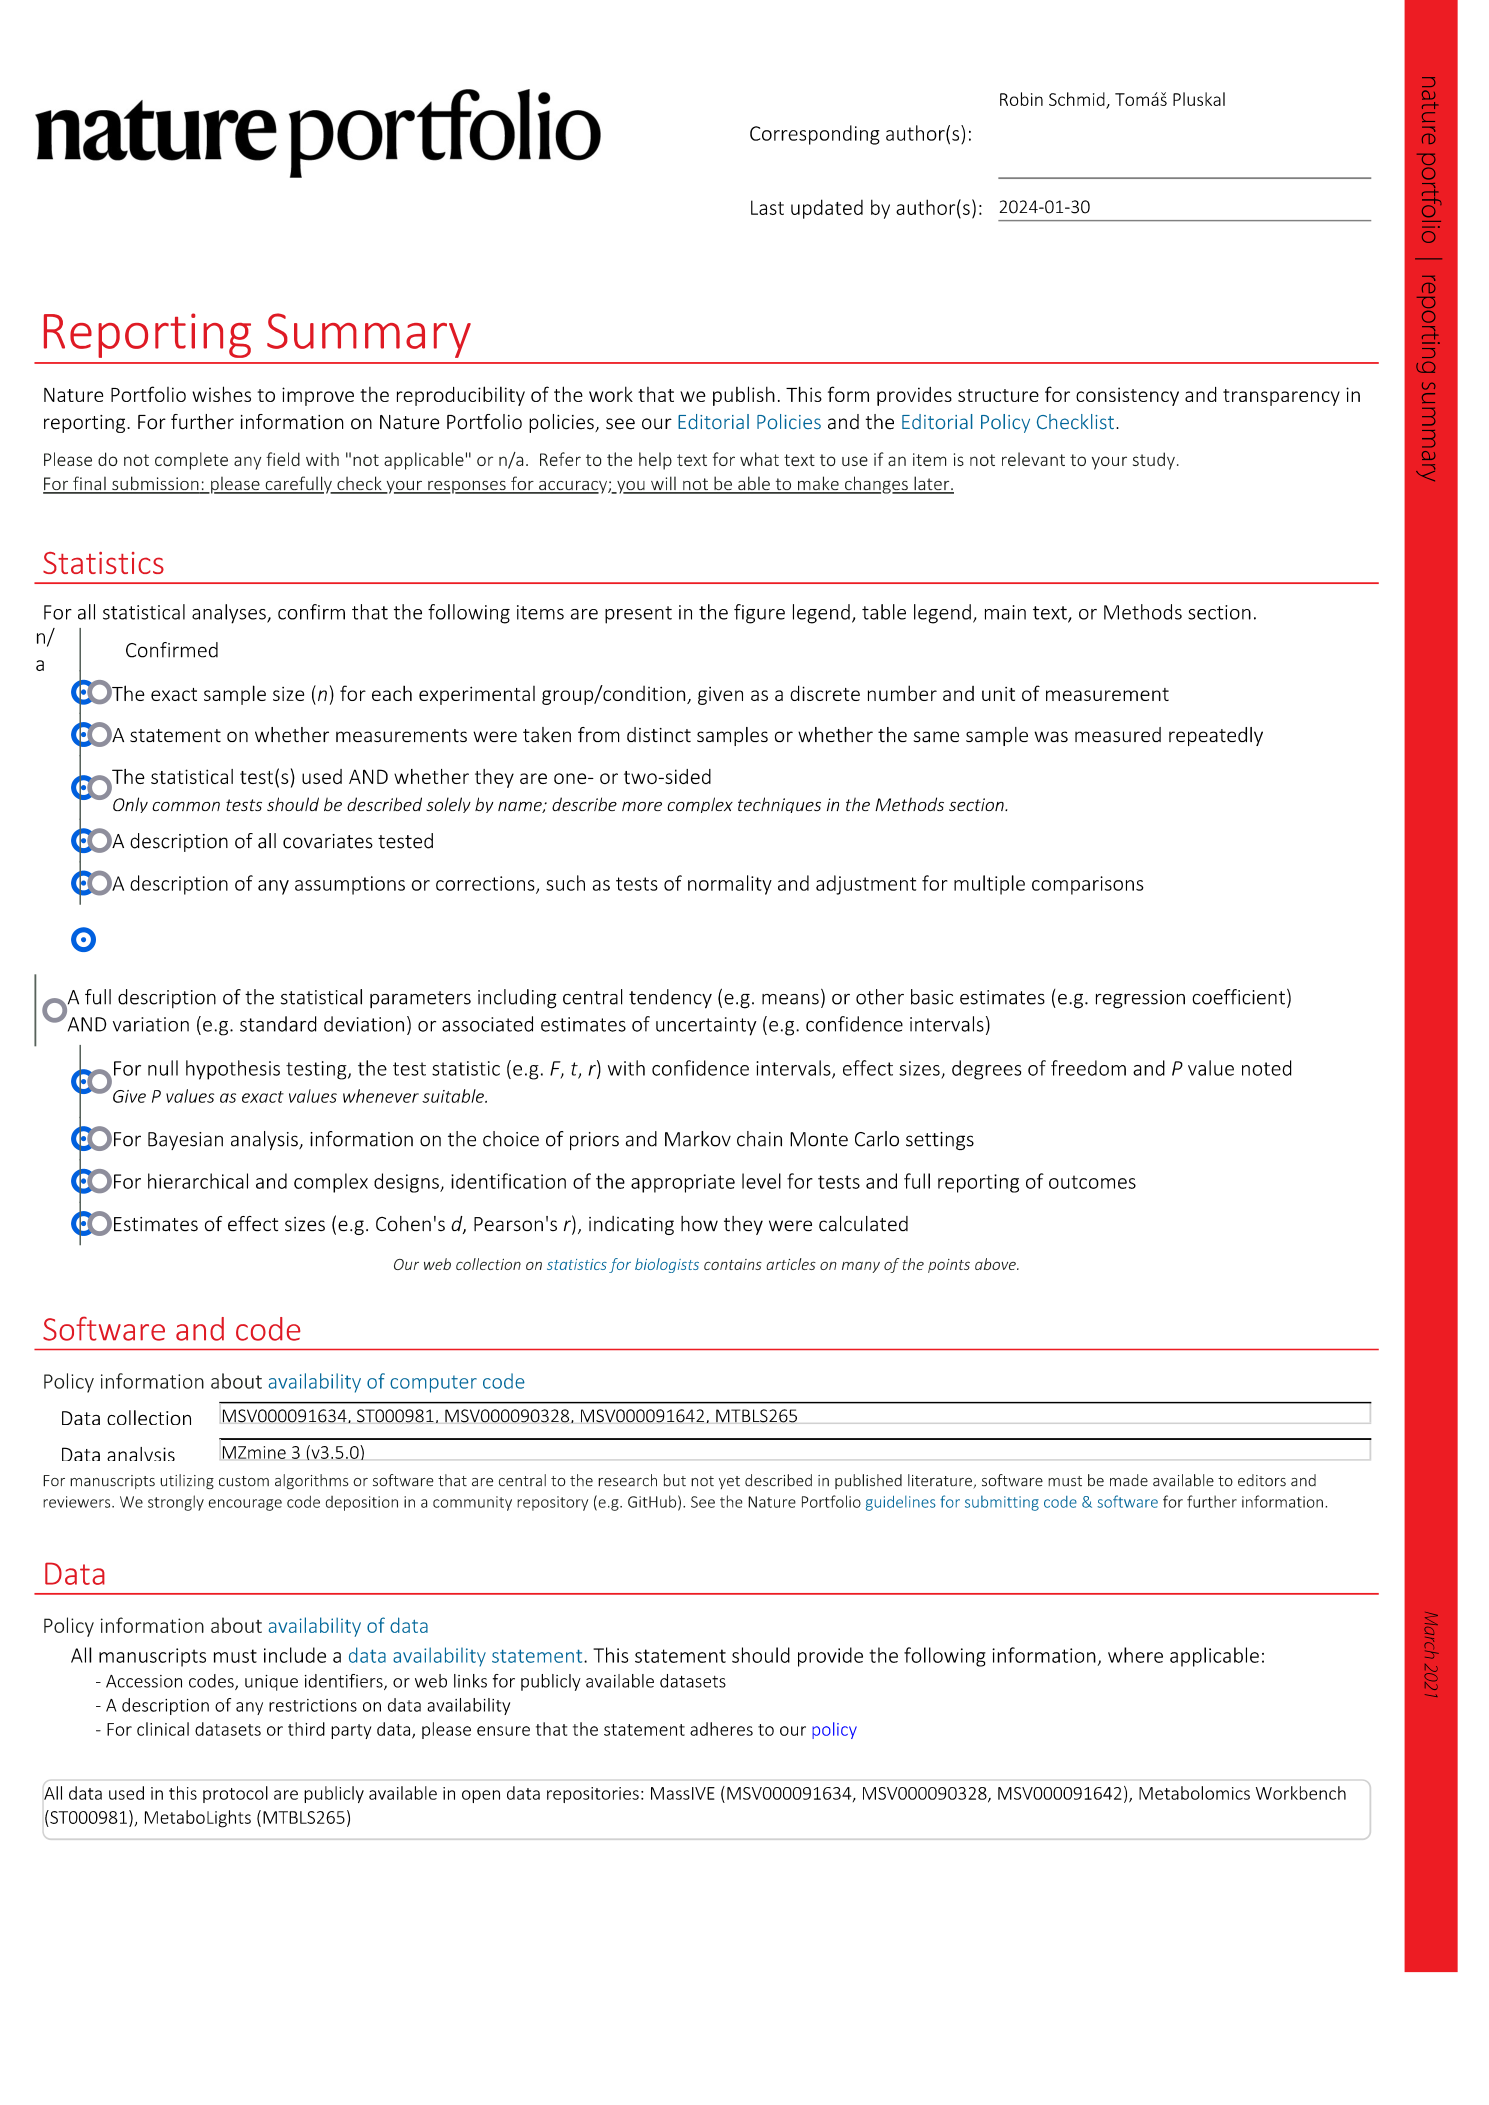
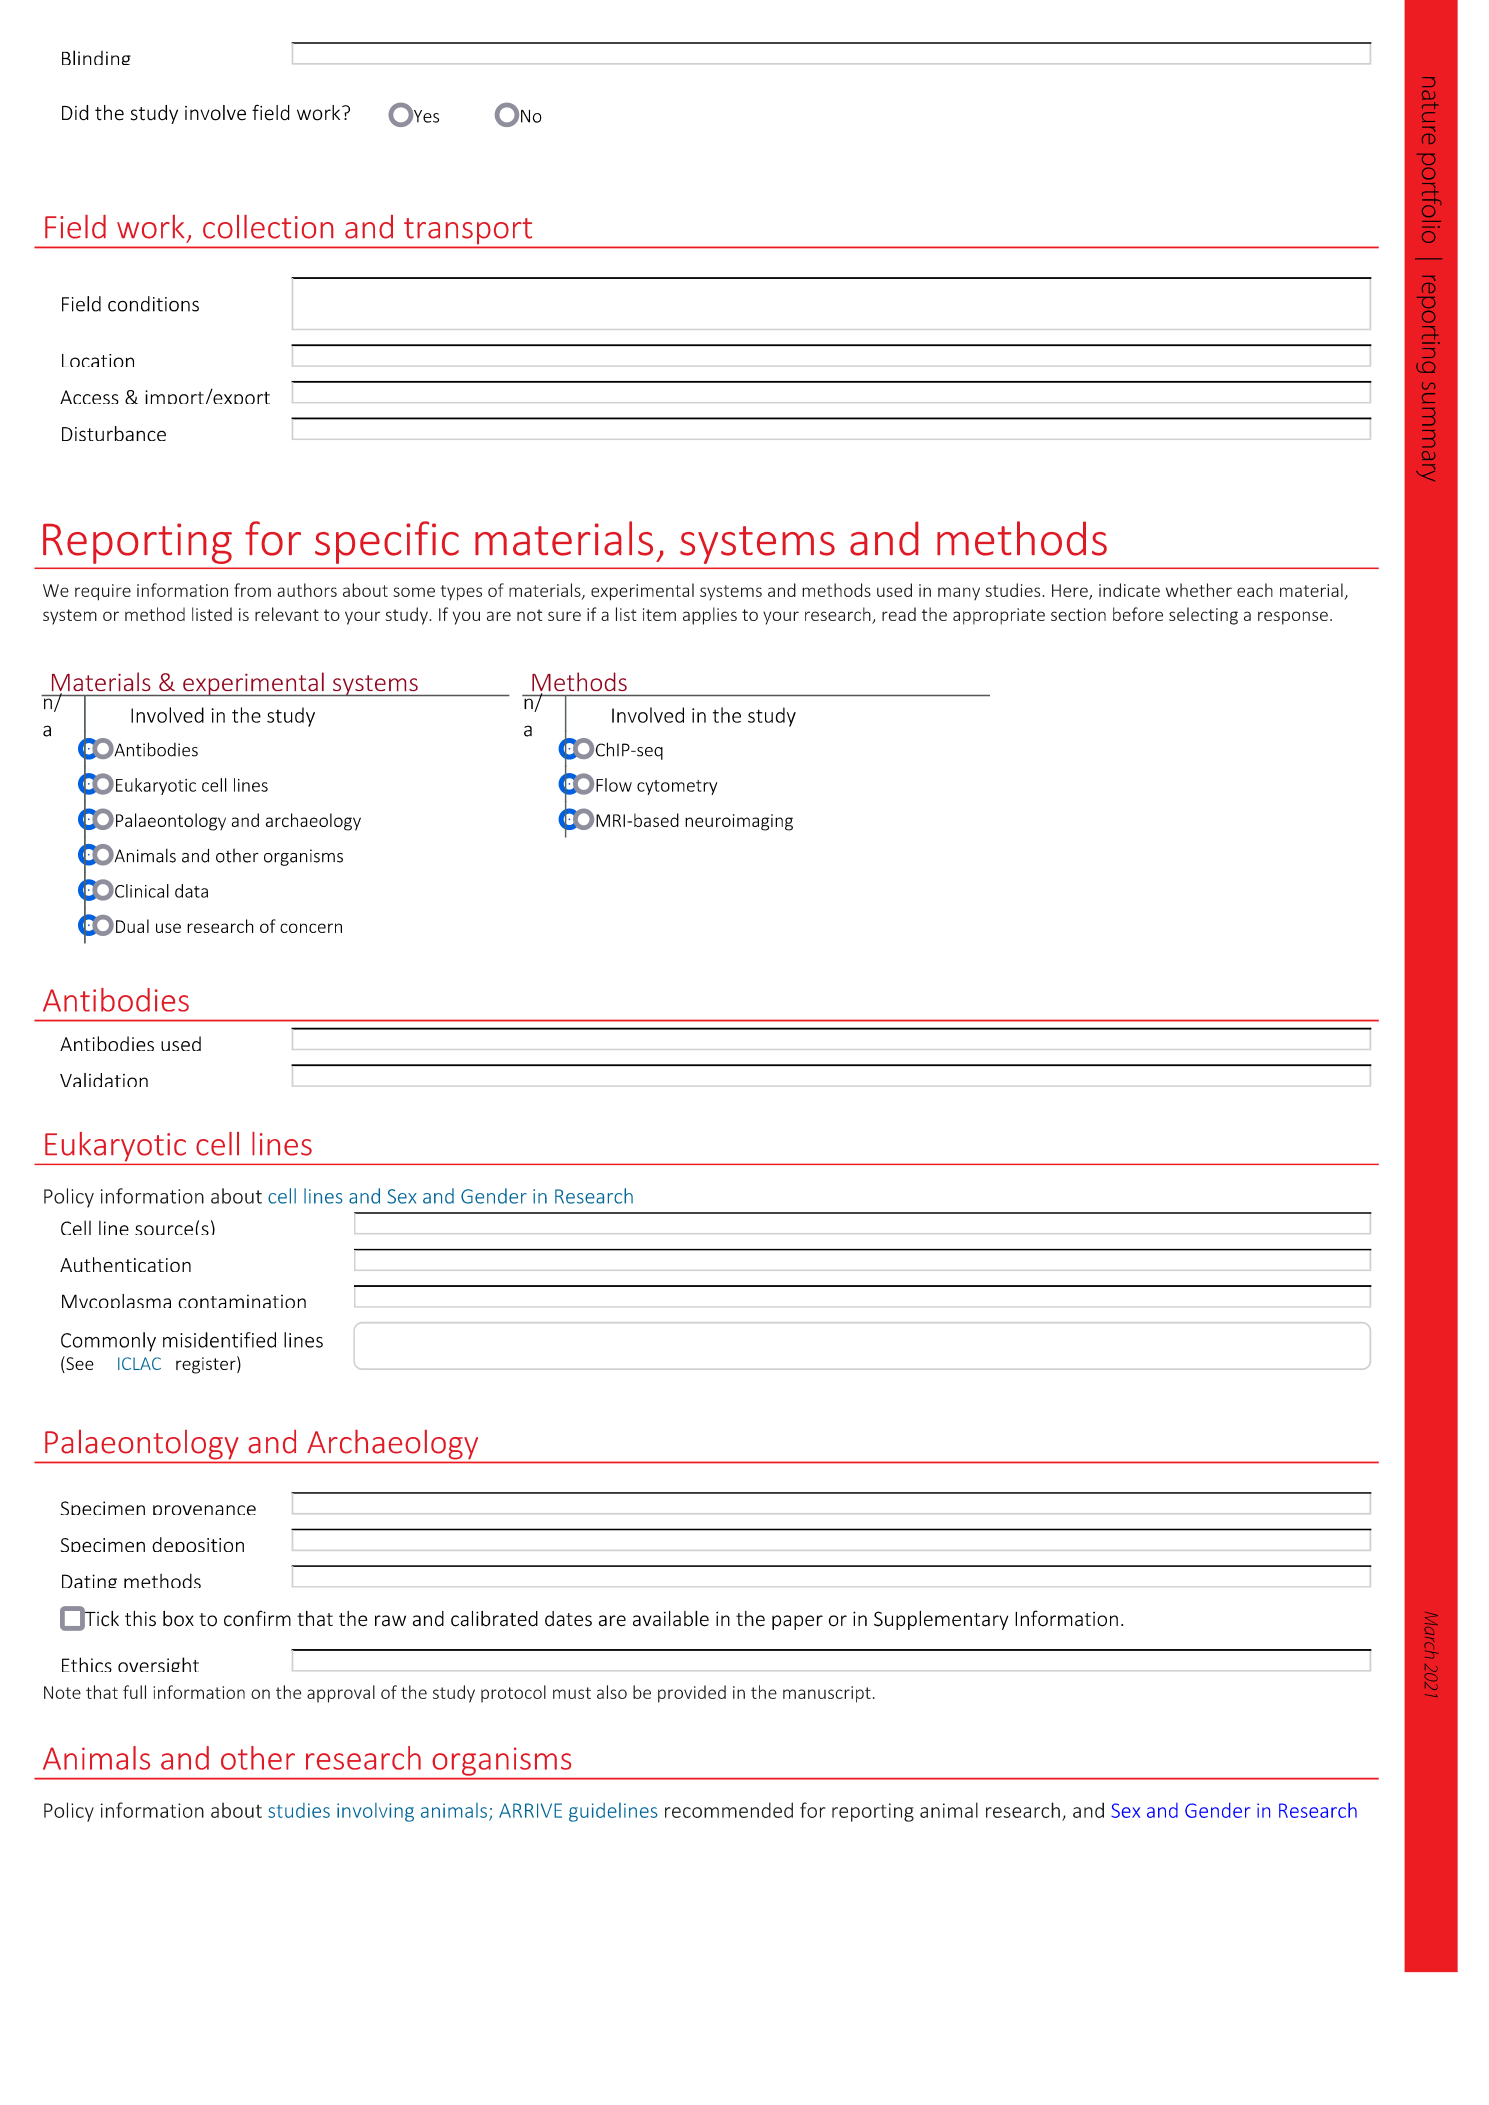
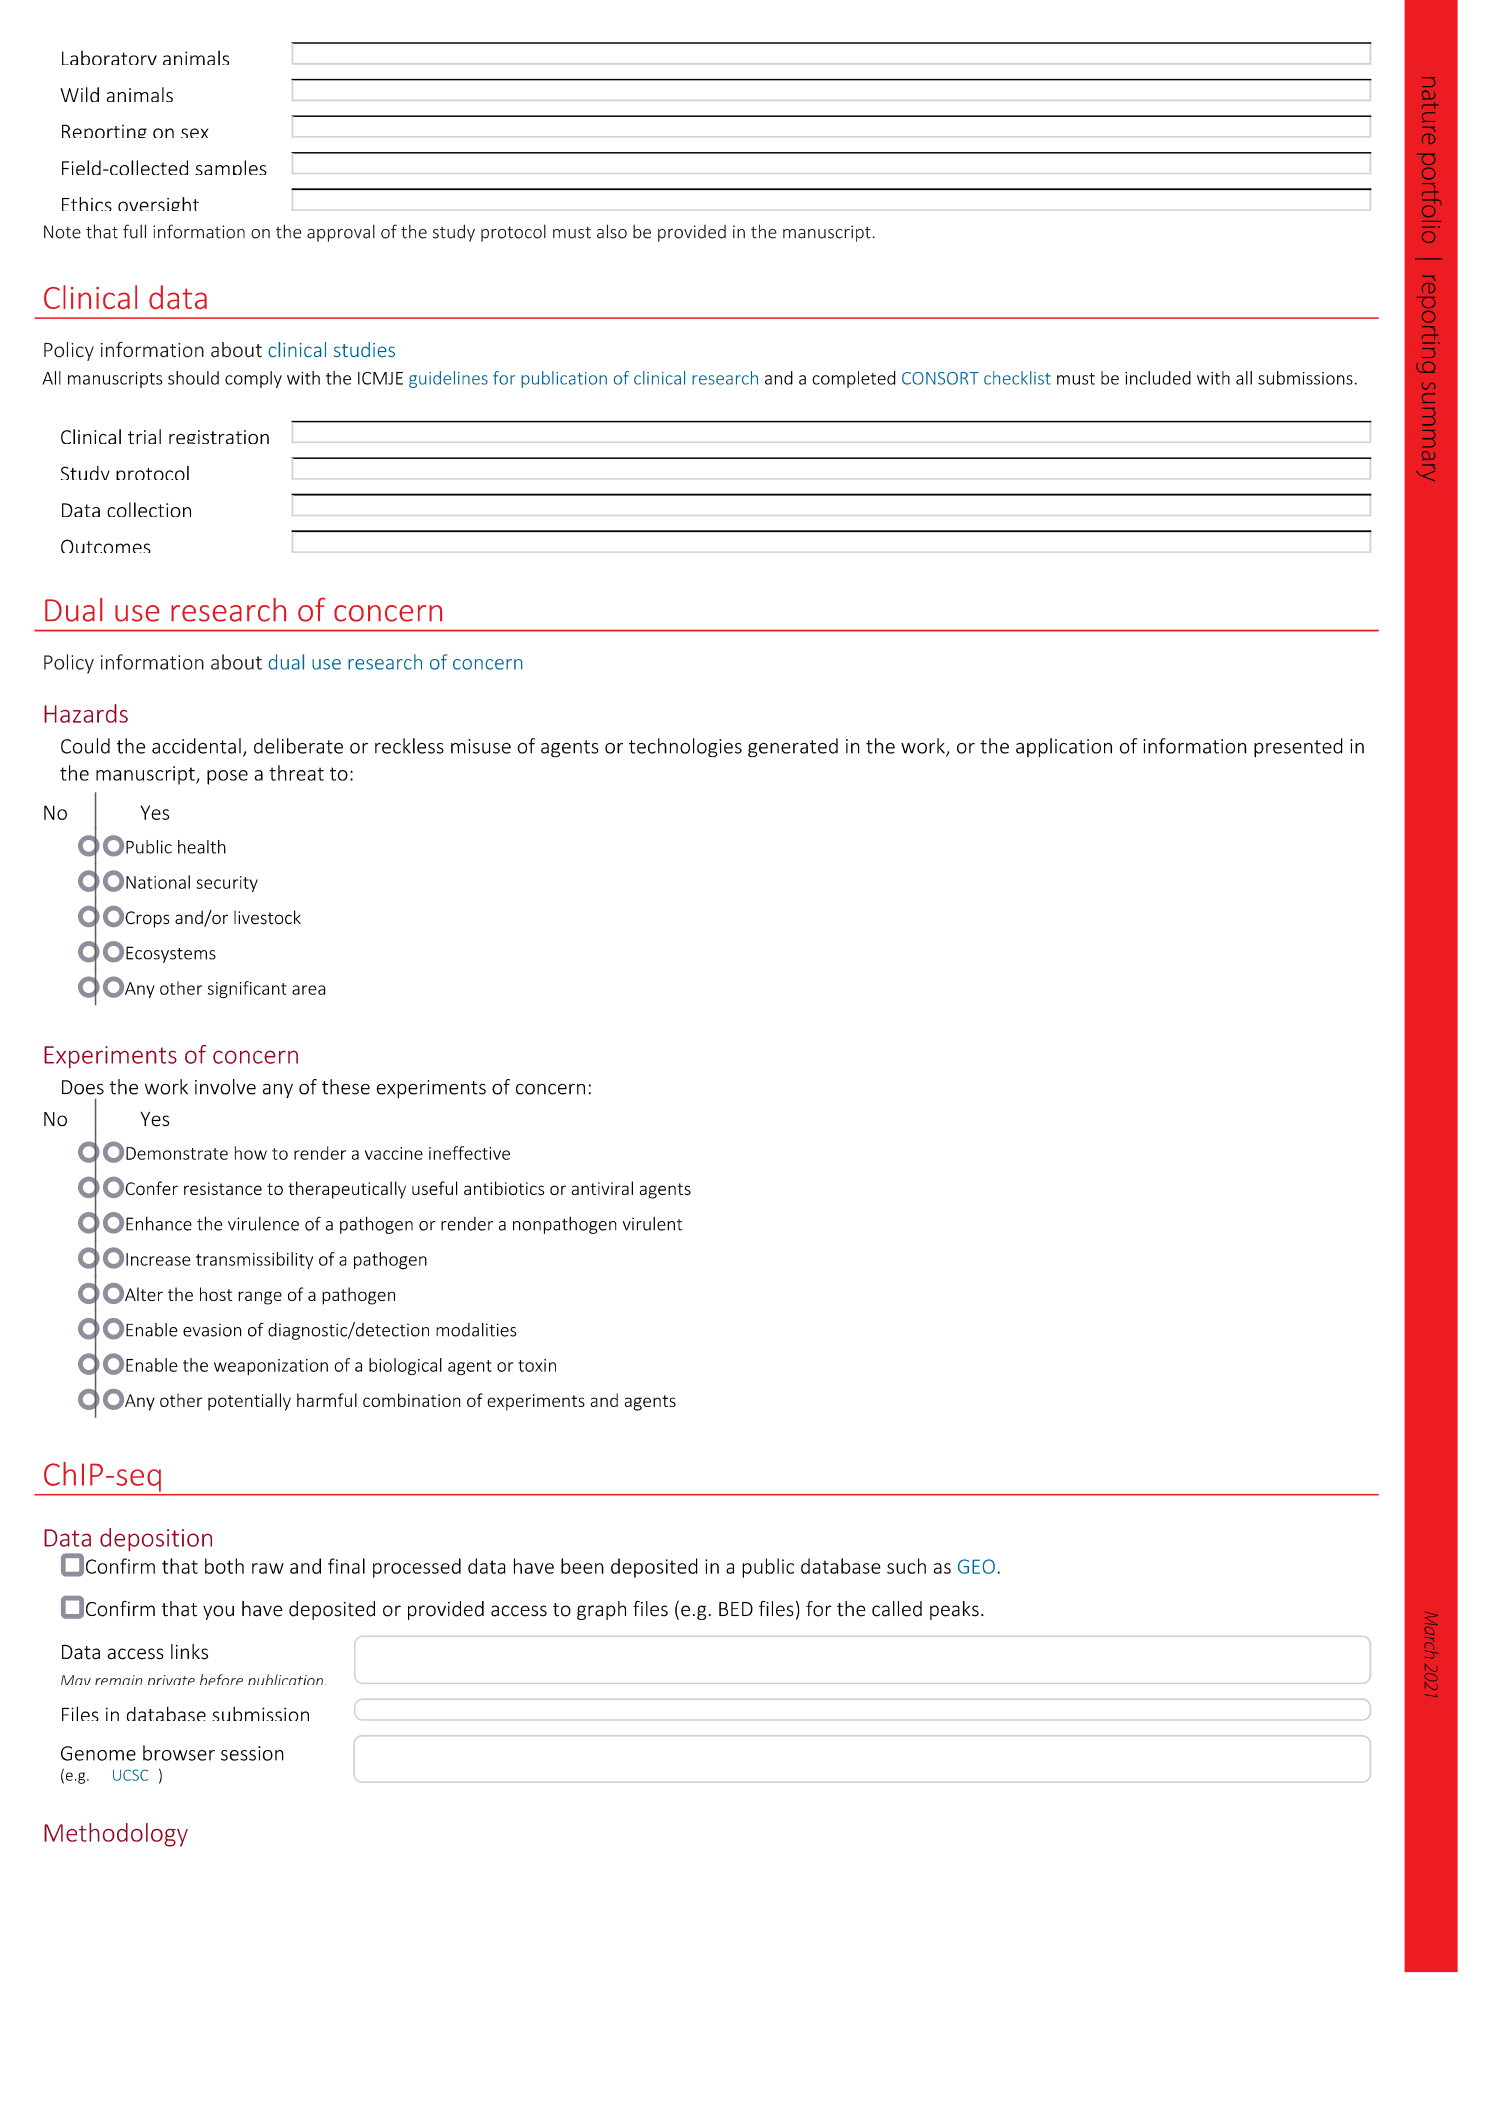
Reporting Summary
Supplementary Data 1
All batch files optimized for each example dataset and the corresponding data processing outputs (feature lists and MS2 spectral lists).
