RTqPCR of SARS-CoV-2 N1 Target on ABI 7500 Fast Using Promega GoTaq Enviro Wastewater SARS-CoV-2 System V1
Padmini Ramachandran, Tamara Walsky, Amanda Windsor, Maria Hoffmann, Christopher Grim
Disclaimer
Abstract
This protocol details methods for the preparation of RTqPCR for the CDC's N1 fragment of the nucleocopsid gene of SARS-CoV-2 using the Promega GoTaq® Enviro Wastewater SARS-CoV-2 System (AM2110). Total Nucleic Acid (TNA) from the Promega Maxwell® RSC Enviro TNA Kit (Cat.# AS1831) is used as input.
This system is a one-step RT-qPCR. In addition to the N1 primer/probe, it includes an internal process control, Pepper Mild Mottle Virus (PMMoV), to allow for normalization and an internal amplification control (IAC). The GoTaq® Enviro Master Mix, provided in this kit, uses proprietary enzymes and formulations that tolerate reverse transcriptase and PCR inhibitors such as humic acids, that can be present in nucleic acid samples purified from wastewater.
Before start
GoTaq® Enviro Wastewater SARS-CoV-2 Systems are sensitive; take precautions to minimize contamination.
- Store the reagents separately from RNA/TNA (total nucleic acid) samples.
- Use a clean designated work area and separate pipettes for pre- and post-amplification steps to minimize the potential for cross-contamination between RNA samples and to prevent carryover of nucleic acid from one run to the next.
- Wear a lab coat and protective eyewear.
- Wear gloves and change them often.
- Prevent contamination by using aerosol-resistant pipette tips.
- Always include a no-template control (NTC) reaction to detect contamination. We recommend performing NTC reactions in triplicate.
Steps
Preparation of Standard curve dilutions
Thaw the SARS-CoV-2 (N+E) RNA, 4 × 10⁶ copies/μl, and PMMoV RNA, 4 × 10⁶ copies/μL, on ice. Avoid long exposures to ambient temperature
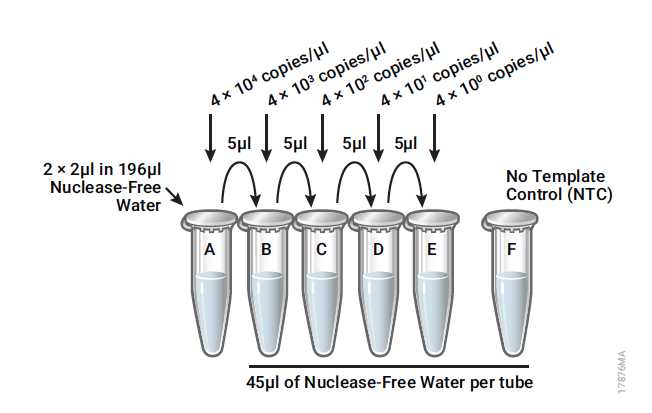
Combine and dilute the SARS-CoV-2 (N+E) and PMMoV RNAs (4 × 10⁶ copies/μL) 100-fold by adding 2μL of each RNA to 196μL of Nuclease-Free Water, for a final concentration of 4 × 10⁴ copies/μL.
Perform subsequent serial tenfold dilutions in low-binding 0.5mL tubes. For example, combine 5μl of RNA with 45μL of Nuclease-Free Water to obtain the following standard curve dilutions (4 × 10⁴–4 copies/μL; see Table 1 and Figure 1).
Vortex each dilution for 3–5 seconds prior to removing an aliquot for the next dilution.
Change pipette tips between dilutions.

| A | B | C |
|---|---|---|
| A | 4 x 10^4 | 1.6 x 10^5 |
| B | 4 x 10^3 | 1.6 x 10^4 |
| C | 4 x 10^2 | 1.6 x 10^3 |
| D | 40 | 160 |
| E | 4 | 16 |
Table 1. Standard curve dilutions for SARS-CoV-2 (N+E) and PMMoV RNA standards.
Single-run aliquots (~15uL of each dilution) can be distributed in strip tubes and frozen at -20ºC.
Keep standards separate from TNA and the RTqPCR reaction reagents.
Following the above instructions will generate enough 15uL aliquots for 3 runs. The volumes of dilutions B-E can be increased (e.g. 10uL into 90uL H2O) to create more aliquots.
Thermal Cycling
Set up a thermal cycler with the following conditions prior to making the reaction mix. This will help reduce the amount of time the plate may be exposed to light or elevated temperatures. A template can be saved for future experiments.
Standard Cycling Conditions
| A | B | C | D |
|---|---|---|---|
| Reverse transcription | 45 | 15 minutes | 1 |
| RT inactivation/GoTaq® Activation | 95 | 2 minutes | 1 |
| Denaturation | 95 | 15 seconds | 40 |
| Annealing/Extension | 62 | 60 secods |
Table 2. Standard thermal cycling conditions Collect data from the following fluorescence channels at the end of each 62°C annealing/extension step. Performing >40 PCR cycles is not recommended as it may generate nonspecific amplification products.
| A | B |
|---|---|
| FAM | N1 (SARS-CoV-2) |
| Cal Fluor560/HEX/JOE/VIC | Internal Amplification Control |
| ROX/CXR | Reference Dye |
| Quasar670/Cy5 | PMMoV |
Table 3. Fluorophores and targets for components of the reaction mix
Preparing the RT-qPCR Reaction Mix (10μl Reaction Volume)
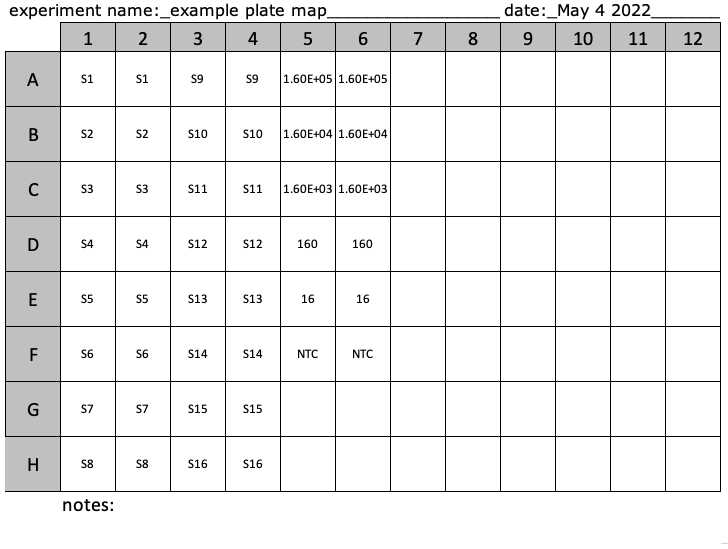
Make a plate map of samples, negative controls (NTC), and standards to help keep track of where on the plate each sample should go. PlateMap.xlsx

Determine the number of reactions. This includes reactions for the unknown samples, combined SARS-CoV-2 (N+E) and PMMoV RNA standards, and negative control reactions in duplicate or triplicate.
- If number of samples (n) including controls ≤14, then N = n + 2
- If number of samples (n) including controls is ≥ 15 or greater, then N = n + 5
While this approach consumes additional reagents, it ensures that enough RT-qPCR amplification mix will be available for all samples. It also ensures that each reaction contains the same RT-qPCR amplification mix.
Vortex GoTaq® Enviro Master Mix (green cap) briefly before use to ensure homogeneity. Centrifuge briefly to collect contents at bottom of tube.
Pulse centrifuge GoScript™Enzyme Mix (yellow cap), Primer/Probe/IAC Mix (20X) (blue cap), and Nuclease-Free water (white cap) to collect contents at bottom of tube.
Prepare the reaction mix for the number of reactions (N) calculated in step 5 in a 1.5mL microcentrifuge tube.
The Master Mix and Enzyme Mix are viscous; take care to pipette slowly to ensure accurate volumes are transferred.
| A | B | C | D |
|---|---|---|---|
| GoTaq® Enviro Master Mix (2X) | 5µL | ||
| GoScript™Enzyme Mix | 0.2µL | ||
| Primer/Probe/IAC Mix (20X) | 0.5µL | ||
| Nuclease-Free Water | 0.3µL |
Table 4. Reaction Mix Worksheet for 10μl Reaction Volume.
After the reaction mix is assembled, mix by flicking or inverting the tube several times then centrifuge to collect contents at bottom of tube
Place a 96-well qPCR plate on a cold block or ice and carefully pipette 6μl of RT-qPCR reaction mix into the appropriate wells according to the plate map
Add 4μl of TNA (or RNA), combined SARS-CoV-2 (N+E) and PMMoV RNA standards or Nuclease-Free Water (NTC) to the appropriate well according to the plate map and gently pipette mix 10 times. The final reaction volume is 10μL. Change tips after each sample addition.
Seal the plate with adhesive film or strip caps and centrifuge at approximately 300 × g for 1 minute to ensure all liquid is collected at the bottom of the plate wells. Protect from extended light exposure and keep on cold block/ice before cycling.
The samples are now ready for thermal cycling using the cycling conditions programmed in Step 4
Result Interpretation
Common qPCR analysis software packages apply a linear regression to the standard dilution series data and calculate the best fit of the standard curve using y = mx + b, where x = Log10 concentration; y = Cq/Ct; m = slope. r2 measures goodness of fit to the regressed line and m is a measure of efficiency, where m= –3.3 indicates 100% PCR efficiency (i.e., amplification product is doubled at each cycle). The y intercept (b in the equation) is the y value Cq at x = 0. For example, b corresponds to the Cq value for a sample with a concentration of 1 copy/reaction (Log10(1) = 0).
In general, the standard curve for each PCR target has an average slope (m) in the range of –3.0 to –3.7 (corresponding to a qPCR efficiency of 86%<E<115%) and an r2 value >0.970. We recommend monitoring y-intercept values for any significant changes from run to run.
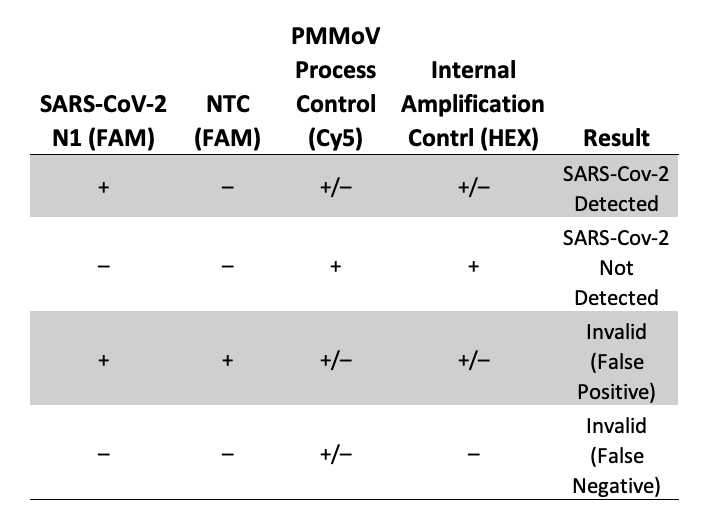
If the IAC Ct in a sample well is shifted significantly (Ct ≥ 2) compared to NTC well, PCR inhibitors are present in the experimental sample, and results should be considered qualitative and not quantitative. Repeat the purification or clean-up of nucleic acid if necessary. If a sample yields no detectable amplification for SARS-CoV-2 but exhibits IAC amplification (Ct = 20–30) and PMMoV amplification (Ct = 20–40), SARS-CoV-2 is not detectable with this system. If the IAC fails to amplify or the IAC Ct is shifted > 3 Ct compared to NTC wells, no conclusions can be made about the absence of SARS-CoV-2 genetic material in a sample. Results can be considered invalid. See Table 4 for examples.
IAC can fail to amplify if assay is setup incorrectly.
Wastewater samples typically exhibit PMMoV fluorescence growth curves that cross the threshold at <40 cycles.
If a sample yields no detectable amplification for SARS-CoV-2 but exhibits IAC amplification (Ct = 20–30), and PMMoV amplification (Ct = 20–40), SARS-CoV-2 is not detectable with this system.
Failure to detect PMMoV in wastewater samples may indicate:
- improper extraction of nucleic acid from samples resulting in loss of RNA, RNA degradation or both
- inhibition of reverse transcriptase, DNA polymerase or both by inhibitors in the sample
- absence of sufficient nucleic acid due to poor collection or pasteurization of sample
- improper assay set up and execution
- reagent or equipment malfunction
If the PMMoV reaction (Cy®5 channel) is negative, IAC is positive and SARS-CoV-2 N1 or N2 or E are positive, the result can be considered valid because PMMoV negativity may reflect a low PMMoV viral load.
If all SARS-CoV-2 markers, PMMoV (process control) and internal amplification control (IAC) are negative for the specimen, the results are invalid. If residual sample is available, repeat the extraction procedure and retest. If all markers remain negative after retesting, report the results as invalid. A new specimen should be collected if possible.
The IAC can be used to evaluate overall performance of the SARS-CoV-2 RT-qPCR amplification reaction and to detect DNA polymerase and/or reverse transcriptase inhibition. The probe used is a dual-labeled probe (CAL Fluor® 560/ BHQ1). Depending on the qPCR instrument used, HEX, JOE, VIC and CAL Fluor® 560 channels can be used to record the amplification signal. Depending on the qPCR instrument and analysis software used, the IAC Ct should fall in the range of 20–30 for the NTC reactions.
For an NTC, use Nuclease-Free Water in the RT-qPCR instead of a nucleic acid-containing sample or RNA standards. NTC samples should produce amplification curves for the IAC in the HEX™ channel. Sample contamination is indicated if FAM™ or Cy®5 NTC reaction channels exhibit fluorescence curve with Ct value indicating copy number greater than the limit of quantification (LOQ). LOQ for the assay is 20 copies per reaction for SARS-CoV-2 genetic signal (in the FAM channel: N1, N2 and E, respectively).
Calculations
The following formula can be applied to quantitate the amount of SARS-CoV-2 nucleic acid in a sample:
Viral genome (copies/liter) = (Copies in RTqPCR × 1000 )/ (Volume of nucleic acid extract used in RTqPCR (ml)* × Concentration Factor)
*If 4µL of nucleic acid is use in RTqPCR, the value in mL is 0.004
Concentration Factor = Wastewater sample volume used(mL) / Volume of nucleic acid extracted(mL)
Quantitation of PMMoV viral genome copies can be performed using the same approach as for SARS-CoV-2 using the PMMoV RNA Quant Standard.
Changes in SARS-CoV-2 levels can be analyzed relative to the PMMoV levels by using this formula:
Relative SARS-CoV-2 signal = SARS-CoV-2 signal (copies/liter) / PMMoV signal (copies/liter)


