QuPath Digital Quantification of Liver Immune Cells
Xinle Wang, Catia Perciani, Xue-Zhong Ma, Chao Jiang, Justin Manuel, Sai Chung, Cornelia Thoeni, Trevor McKee, Ian McGilvray, Sonya Macparland
QuPath
digital quantification
whole slide imaging
immunohistochemistry
bioimage analysis
digital image analysis
digital pathology
Abstract
Digital image analysis is a widely employed technique to effectively reduce sample processing time and bias. Whole slide imaging and analysis of immunohistochemically stained sample slides allows for rapid cellular quantification and insight into single cell and subcellular data that cannot be acquired by the naked eye. QuPath is an emerging open-source platform for digital pathology that provides as a free, flexible and highly accessible option to investigate histology and cellular infiltration. Despite the introduction of program modules that assist with quantification, research methodologies in the literature are inconsistent and impedes comparison across studies. This protocol offers validated, step-by-step instruction on how to optimize and run parameters using the QuPath Positive Cell Detection module, outlines how to quantitate and assess spatial distribution of cells in the liver lobule structure and presents tips and tricks to easily navigate the QuPath platform. The protocol will act to standardize optimization in QuPath for improved comparison in the literature and serve as a guide for new users.
Steps
Download, Import and Organize Images
Download open-source QuPath software from http://qupath.github.io. http://qupath.github.io. To avoid incompatible features in newer versions of the software, refrain from changing software versions during the same analysis.
Software
| Value | Label |
|---|---|
| QuPath | NAME |
| Pete Bankhead | DEVELOPER |
| http://qupath.github.io | LINK |
| 2.3 | VERSION |
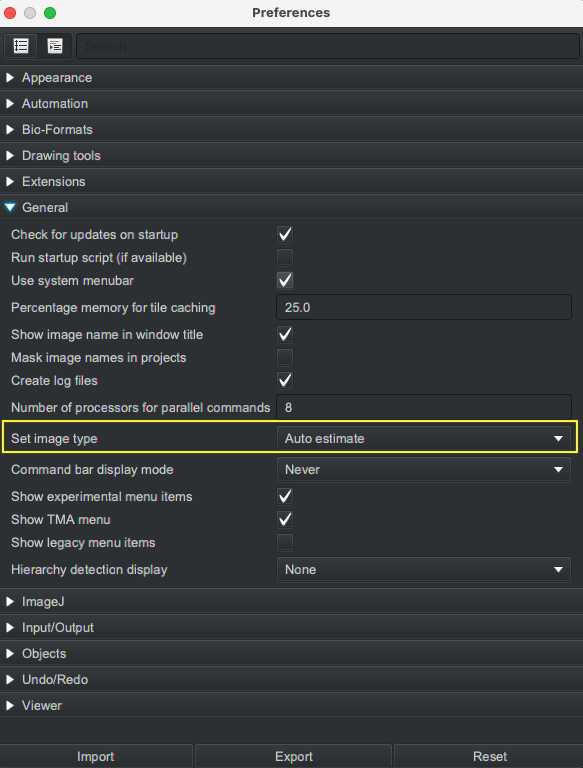
Open QuPath software and set initial preferences using the gear icon or from the menu ( Edit > Preference ). It is recommended to set "Set image type" as "Auto estimate" in Preference > General . This will enable the software to estimate image type as hematoxylin & eosin (H&E), horseradish peroxidase-based 3,3′-diaminobenzidine (H-DAB) or fluorescence without prompting user to manually enter for each image.
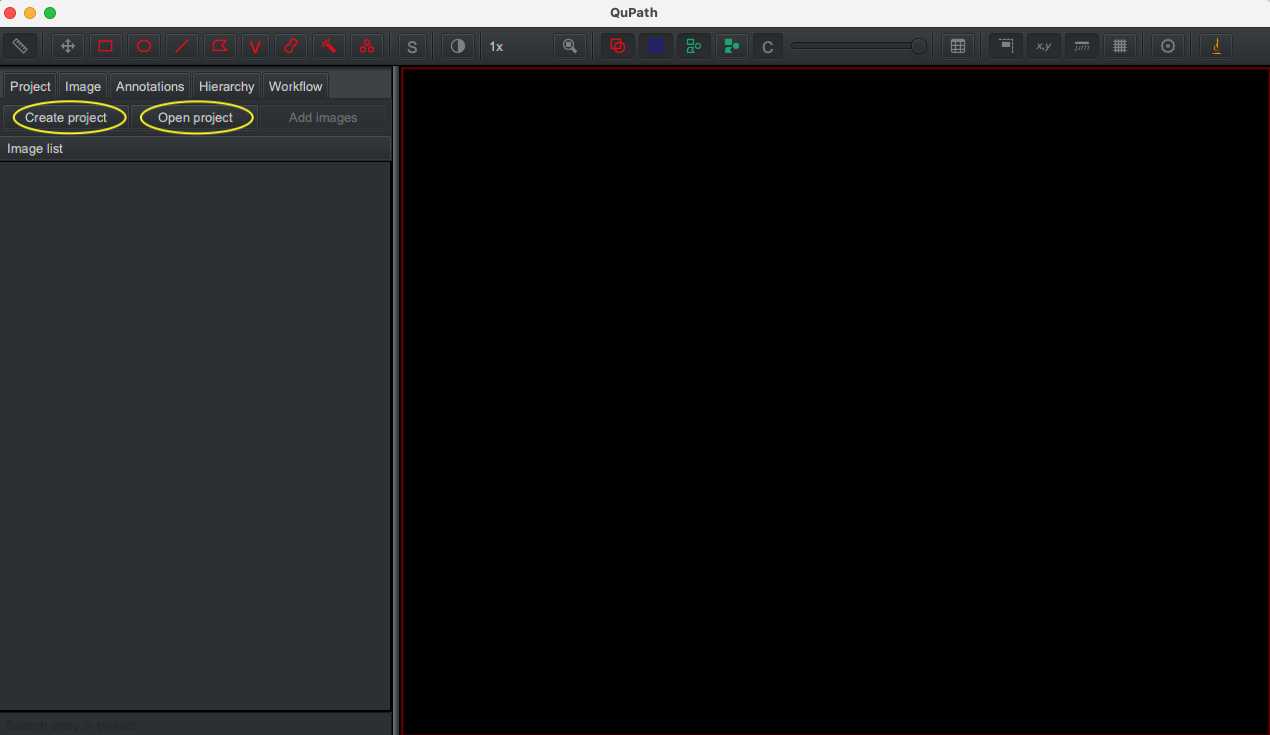
Create new project in a new, empty folder with Create project button. All files associated with the project will be saved into this folder and can be accessed through the Open project button.
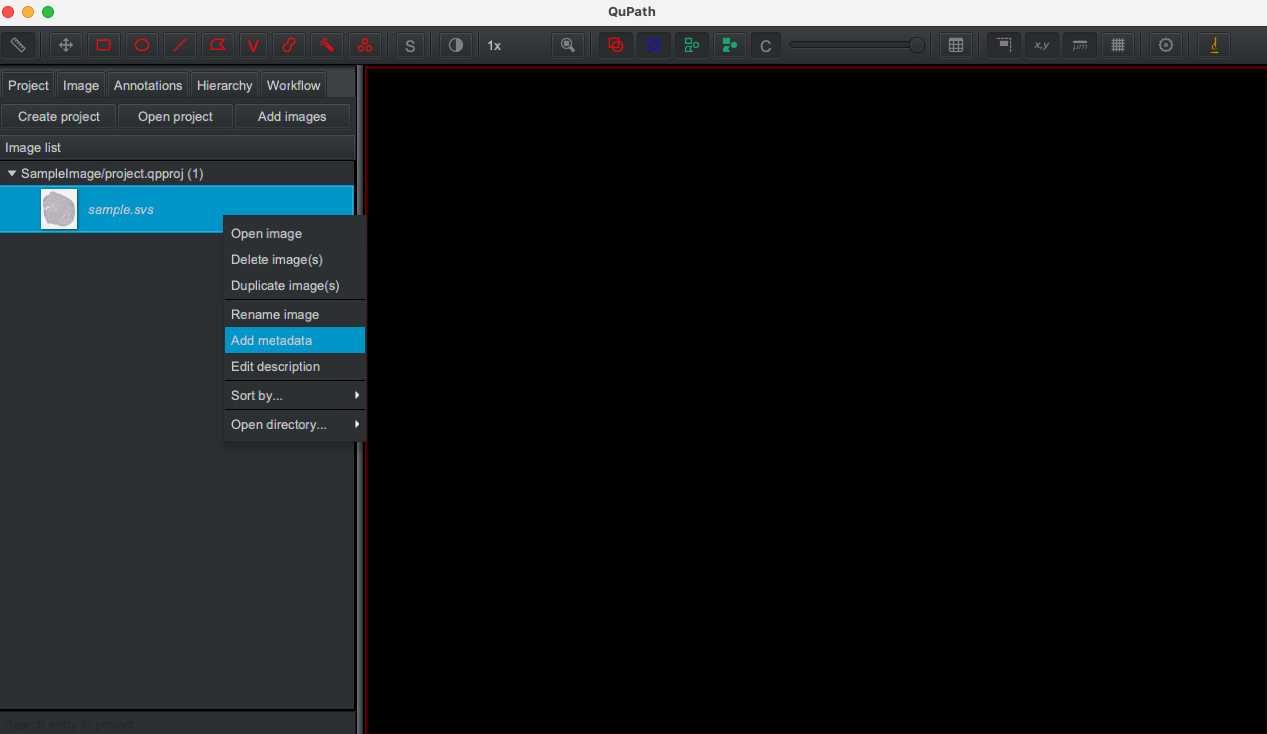
Import sample images through dragging and dropping onto QuPath interface. Image names that are italicized correspond to unprocessed images. To facilitate organization, images can be assigned a metadata to categorize based on user-inputted "key" and "value" (e.g. key = stain and value = CD68 to mark macrophages). The images can be sorted by right clicking the project title and selecting Sort by... > key name
Sample Image Quality Control
Before quantification analysis, it is important to assess the sample cohort for stain consistency. The same digital quantification parameters can only be applied to consistently stained samples. Depending on the liver sample examined, non-specific staining can occur despite identical staining protocol. In the case of inconsistent staining, the samples need to be segregated for low and high sensitivity digital cellular detection and analyzed separately to ensure true positivity capture.

Each individual image should be assessed for stain and slide preparation artifacts. The artifacts will be excluded from digital analysis. To exclude artifacts, either avoid artifact when annotating for sample by holding down CTRL and SHIFT, or annotate the artifact only using the annotation tools post-analysis, select all detections, insert detections into hierarchy and delete the artifact annotation (not keeping object detections).

Image Annotation
Annotate around the entire sample region of interest (ROI) using the magic wand icon. Note: Hold down on CTRL and SHIFT to avoid annotation overlap for artifact exclusion.
Annotate sub ROIs within overarching sample ROI with rectangle annotation tool for optimization of stain positivity detection parameters.
Analysis Optimization
In a particular ROI, optimize parameters for the positive cell detection module ( Analyze > Cell detection > Positive cell detection ) to capture individual cells and positivity threshold for "Cell: DAB OD mean". Once satisfied with parameters, run optimized module on second and third ROI to validate.
Once parameters are established, save optimized positive cell detection script to project folder for future access and batch processing.
Delete all optimization detections.
Run Analysis
Open saved positive cell detection script ( Automate > Show script editor ). Run script for analysis ( Run > Run ) for single analysis of current image. For multiple image processing or batch processing, select "Run for project" and choose images to assess.
Save image detections.
Spatial Lobular Analysis
For rectangular locational analysis of periportal versus pericentral immune cells, locate portal tract and central vein regions and annotate using the rectangle annotation tool between the regions. Select annotated rectangle and partition using partitioning script below.
![Schematic of liver lobular structure for analyzing spatial distribution of immune cells in the liver. (a) Overview of liver lobule structure and blood flow comprising the portal triad (PT) and central vein (CV) region. (b) Rectangular spatial partition schematic across the PT-CV axis. Lobule layers are divided from periportal (layer 1) to central venous (layer 10) region. (c) Concentrical spatial partition schematic around PT and CV regions: CV-centred expansion [lobule layers from most periportal (layer 1, outer circle) to central venous (layer 10)] and PT-centred expansion [lobule layers from most central venous (layer 1, outer circle) to periportal (layer 10)].](https://static.yanyin.tech/literature_test/protocol_io_true/protocols.io.bs6gnhbw/Screen%20Shot%202021-06-19%20at%208.25.49%20PM.png "Schematic of liver lobular structure for analyzing spatial distribution of immune cells in the liver. (a) Overview of liver lobule structure and blood flow comprising the portal triad (PT) and central vein (CV) region. (b) Rectangular spatial partition schematic across the PT-CV axis. Lobule layers are divided from periportal (layer 1) to central venous (layer 10) region. (c) Concentrical spatial partition schematic around PT and CV regions: CV-centred expansion [lobule layers from most periportal (layer 1, outer circle) to central venous (layer 10)] and PT-centred expansion [lobule layers from most central venous (layer 1, outer circle) to periportal (layer 10)].")
#Rectangle Partition Script
/**
 * Split a rectangle into equal parts along its longest dimension.
 * Rotated rectangles are supported.
 *
 * Written for https://forum.image.sc/t/how-to-divide-annotation-roi-into-equal-dimension-bins/51563/8
 *
 * @author Pete Bankhead
 * Taken from https://gist.github.com/petebankhead/e177b07784460a76d70f89347edd988d
 */

// Number of regions to create
int nRegions = 10

// Get selected object
def selected = getSelectedObject()
if (selected == null) {
    println 'No object selected!'
}

// Get points, removing duplicates
def roi = selected.getROI()
def points = new LinkedHashSet<>(roi.getAllPoints()) as List
if (points.size() != 4) {
    println 'I need a ROI with exactly 4 points'
    return
}

// Get the side lengths
double d1 = points[1].distance(points[0])
double d2 = points[2].distance(points[1])
double d3 = points[3].distance(points[2])
double d4 = points[0].distance(points[3])

// Check we really have a rectangle
// (Set this to a higher number of it's too strict)
double eps = 0.01
if (Math.abs(d1 - d3) > eps || Math.abs(d4 - d2) > eps) {
    println 'Points do not appear to form a rectangle!'
    return
}

// Get starting point based on longest side
int ind = 0
if (d1 > d2) {
    points.add(0, points.remove(3))
}
double x = points[ind].x
double y = points[ind].y
double dx = (points[ind+1].x - x) / nRegions
double dy = (points[ind+1].y - y) / nRegions
double dx2 = (points[ind+2].x - points[ind+1].x)
double dy2 = (points[ind+2].y - points[ind+1].y)

// Add annotations
def annotations = []
for (int i = 0; i < nRegions; i++) {
    double originX = x + dx*i
    double originY = y + dy*i
    def polygon = ROIs.createPolygonROI(
        [originX, originX+dx, originX+dx+dx2, originX+dx2] as double[],
        [originY, originY+dy, originY+dy+dy2, originY+dy2] as double[],
        roi.getImagePlane()
    )
    def newAnnotation = PathObjects.createAnnotationObject(polygon)
    newAnnotation.setName("ROI 1 Layer ${i+1}") //To change ROI number
    annotations << newAnnotation
}

addObjects(annotations)
For concentrical locational analysis of periportal versus pericentral immune cells, locate and annotate liver lobule regions. Set all lobule annotations to class "Other" and save annotations using Save Annotation script below. Once saved, further concentrical partition using partitioning script below.
#Save Annotation Script
hierarchy = getCurrentHierarchy()
imageName = getProjectEntry().getImageName()
path = buildFilePath(PROJECT_BASE_DIR, "testSetPoints")
mkdirs(path)

path = buildFilePath(PROJECT_BASE_DIR, "testSetPoints", imageName+".testROI")

annotations = getAnnotationObjects().findAll{it.getPathClass() == getPathClass("Other")}.collect {new qupath.lib.objects.PathAnnotationObject(it.getROI(), it.getPathClass())}

def gson = GsonTools.getInstance(true)

path = buildFilePath(PROJECT_BASE_DIR, "testSetPoints", imageName+".testarea")
File file = new File(path)
file.write(gson.toJson(annotations))
#Concentrical Partition Script
/**
* written up  https://petebankhead.github.io/qupath/scripts/2018/08/08/three-regions.html
* @author Pete Bankhead
* modified to make inner margin rings to identify centroid regions within liver lobules for quantification.
* Modifications by Trevor McKee and Xinle Wang, version 18-Feb-2021
*/

import org.locationtech.jts.geom.Geometry
import qupath.lib.common.GeneralTools
import qupath.lib.objects.PathObject
import qupath.lib.objects.PathObjects
import qupath.lib.roi.GeometryTools
import qupath.lib.roi.ROIs

import static qupath.lib.gui.scripting.QPEx.*

//-----
// Some things user need to specify

// How much to expand each region
double linelength = 313  // User input - edit this to specify line length
def ROIName = "ROI 3" // User input - change this to change the labeling for each ring
double expandMarginMicrons = -linelength/10.0

// Define the colors
def coloInner9Margin = getColorRGB(0, 50, 0)
def coloInner8Margin = getColorRGB(0, 100, 0)
def coloInner7Margin = getColorRGB(0, 150, 0)
def coloInner6Margin = getColorRGB(0, 200, 0)
def coloInner5Margin = getColorRGB(0, 250, 0)
def coloInner4Margin = getColorRGB(0, 0, 50)
def coloInner3Margin = getColorRGB(0, 0, 100)
def coloInner2Margin = getColorRGB(0, 0, 200)
def colorOuterMargin = getColorRGB(0, 0, 250)
def colorCentral = getColorRGB(0, 0, 0)

// Choose whether to lock the annotations or not (it's generally a good idea to avoid accidentally moving them)
def lockAnnotations = true

//-----

// Extract the main info we need
def imageData = getCurrentImageData()
def hierarchy = imageData.getHierarchy()
def server = imageData.getServer()

// We need the pixel size
def cal = server.getPixelCalibration()
if (!cal.hasPixelSizeMicrons()) {
  print 'We need the pixel size information here!'
  return
}
if (!GeneralTools.almostTheSame(cal.getPixelWidthMicrons(), cal.getPixelHeightMicrons(), 0.0001)) {
  print 'Warning! The pixel width & height are different; the average of both will be used'
}

// Get annotation & detections
def annotations = getAnnotationObjects()
def selected = getSelectedObject()
if (selected == null || !selected.isAnnotation()) {
  print 'Please select an annotation object!'
  return
}


// We need one selected annotation as a starting point; if we have other annotations, they will constrain the output
annotations.remove(selected)

// Extract the ROI & plane
def roiOriginal = selected.getROI()
def plane = roiOriginal.getImagePlane()


// Calculate how much to expand
double expandPixels = expandMarginMicrons / cal.getAveragedPixelSizeMicrons()
def areaTumor = roiOriginal.getGeometry()
def TissueAnnotation = areaTumor

// Get the first central area
def geomCentral = areaTumor.buffer(expandPixels)
//geomCentral = geomCentral.intersection(areaTissue)
def roiCentral = GeometryTools.geometryToROI(geomCentral, plane)
def annotationCentral = PathObjects.createAnnotationObject(roiCentral)
annotationCentral.setName("Central Region")
annotationCentral.setColorRGB(colorCentral)

// Get the first inner margin area
def geomInner = areaTumor
geomInner = geomInner.difference(geomCentral)
//geomInner = geomInner.intersection(areaTissue)
def roiInner = GeometryTools.geometryToROI(geomInner, plane)
def annotationInner = PathObjects.createAnnotationObject(roiInner)
annotationInner.setName("1st Ring " + ROIName)
annotationInner.setColorRGB(colorOuterMargin)

// Get the second central area
def geomCentral2 = geomCentral.buffer(expandPixels) // geomCentral.buffer(expandPixels)
geomCentral2 = geomCentral2.intersection(geomCentral)
def roiCentral2 = GeometryTools.geometryToROI(geomCentral2, plane)
def annotationCentral2 = PathObjects.createAnnotationObject(roiCentral2)
annotationCentral2.setName("Second Inner Ring")
annotationCentral2.setColorRGB(colorCentral)

// Get the 2nd inner margin area
def geomInner1 = geomCentral
geomInner1 = geomCentral.difference(geomCentral2)
//geomInner1 = geomInner.intersection(areaTissue)
def roiInner1 = GeometryTools.geometryToROI(geomInner1, plane)
def annotationInner2 = PathObjects.createAnnotationObject(roiInner1)
annotationInner2.setName("2nd Ring " + ROIName)
annotationInner2.setColorRGB(coloInner2Margin)

// Get the 3rd central area
def geomCentral3 = geomCentral2.buffer(expandPixels) // geomCentral.buffer(expandPixels)
geomCentral3 = geomCentral3.intersection(geomCentral2)
def roiCentral3 = GeometryTools.geometryToROI(geomCentral3, plane)
def annotationCentral3 = PathObjects.createAnnotationObject(roiCentral3)
annotationCentral3.setName("Third Inner Ring")
annotationCentral3.setColorRGB(colorCentral)

// Get the 3rd inner margin area
def geomInner2 = geomCentral2
geomInner2 = geomCentral2.difference(geomCentral3)
//geomInner1 = geomInner.intersection(areaTissue)
def roiInner2 = GeometryTools.geometryToROI(geomInner2, plane)
def annotationInner3 = PathObjects.createAnnotationObject(roiInner2)
annotationInner3.setName("3rd Ring " + ROIName)
annotationInner3.setColorRGB(coloInner3Margin)

// Get the 4th central area
def geomCentral4 = geomCentral3.buffer(expandPixels) // geomCentral.buffer(expandPixels)
geomCentral4 = geomCentral4.intersection(geomCentral3)
def roiCentral4 = GeometryTools.geometryToROI(geomCentral4, plane)
def annotationCentral4 = PathObjects.createAnnotationObject(roiCentral4)
annotationCentral4.setName("Third Inner Ring")
annotationCentral4.setColorRGB(colorCentral)

// Get the 4th inner margin area
def geomInner3 = geomCentral3
geomInner3 = geomCentral3.difference(geomCentral4)
//geomInner1 = geomInner.intersection(areaTissue)
def roiInner3 = GeometryTools.geometryToROI(geomInner3, plane)
def annotationInner4 = PathObjects.createAnnotationObject(roiInner3)
annotationInner4.setName("4th Ring " + ROIName)
annotationInner4.setColorRGB(coloInner4Margin)

// Get the 5th central area
def geomCentral5 = geomCentral4.buffer(expandPixels) // geomCentral.buffer(expandPixels)
geomCentral5 = geomCentral5.intersection(geomCentral4)
def roiCentral5 = GeometryTools.geometryToROI(geomCentral5, plane)
def annotationCentral5 = PathObjects.createAnnotationObject(roiCentral5)
annotationCentral5.setName("Third Inner Ring")
annotationCentral5.setColorRGB(colorCentral)

// Get the 5th inner margin area
def geomInner4 = geomCentral4
geomInner4 = geomCentral4.difference(geomCentral5)
//geomInner1 = geomInner.intersection(areaTissue)
def roiInner4 = GeometryTools.geometryToROI(geomInner4, plane)
def annotationInner5 = PathObjects.createAnnotationObject(roiInner4)
annotationInner5.setName("5th Ring " + ROIName)
annotationInner5.setColorRGB(coloInner5Margin)

// Get the 6th central area
def geomCentral6 = geomCentral5.buffer(expandPixels) // geomCentral.buffer(expandPixels)
geomCentral6 = geomCentral6.intersection(geomCentral5)
def roiCentral6 = GeometryTools.geometryToROI(geomCentral6, plane)
def annotationCentral6 = PathObjects.createAnnotationObject(roiCentral6)
annotationCentral6.setName("Third Inner Ring")
annotationCentral6.setColorRGB(colorCentral)

// Get the 6th inner margin area
def geomInner5 = geomCentral5 // change from geomcentral6
geomInner5 = geomCentral5.difference(geomCentral6)
//geomInner1 = geomInner.intersection(areaTissue)
def roiInner5 = GeometryTools.geometryToROI(geomInner5, plane)
def annotationInner6 = PathObjects.createAnnotationObject(roiInner5)
annotationInner6.setName("6th Ring " + ROIName)
annotationInner6.setColorRGB(coloInner6Margin)


// Get the 7th central area
def geomCentral7 = geomCentral6.buffer(expandPixels) // geomCentral.buffer(expandPixels)
geomCentral7 = geomCentral7.intersection(geomCentral6)
def roiCentral7 = GeometryTools.geometryToROI(geomCentral7, plane)
def annotationCentral7 = PathObjects.createAnnotationObject(roiCentral7)
annotationCentral7.setName("Third Inner Ring")
annotationCentral7.setColorRGB(colorCentral)

// Get the 7th inner margin area
def geomInner6 = geomCentral6 // change from geomcentral7
geomInner6 = geomCentral6.difference(geomCentral7)
//geomInner1 = geomInner.intersection(areaTissue)
def roiInner6 = GeometryTools.geometryToROI(geomInner6, plane)
def annotationInner7 = PathObjects.createAnnotationObject(roiInner6)
annotationInner7.setName("7th Ring " + ROIName)
annotationInner7.setColorRGB(coloInner7Margin)


// Get the 8th central area
def geomCentral8 = geomCentral7.buffer(expandPixels) // geomCentral.buffer(expandPixels)
geomCentral8 = geomCentral8.intersection(geomCentral7)
def roiCentral8 = GeometryTools.geometryToROI(geomCentral8, plane)
def annotationCentral8 = PathObjects.createAnnotationObject(roiCentral8)
annotationCentral8.setName("Third Inner Ring")
annotationCentral8.setColorRGB(colorCentral)

// Get the 8th inner margin area
def geomInner7 = geomCentral7 // change from geomcentral8
geomInner7 = geomCentral7.difference(geomCentral8)
//geomInner1 = geomInner.intersection(areaTissue)
def roiInner7 = GeometryTools.geometryToROI(geomInner7, plane)
def annotationInner8 = PathObjects.createAnnotationObject(roiInner7)
annotationInner8.setName("8th Ring " + ROIName)
annotationInner8.setColorRGB(coloInner8Margin)


// Get the 9th central area
def geomCentral9 = geomCentral8.buffer(expandPixels) // geomCentral.buffer(expandPixels)
geomCentral9 = geomCentral9.intersection(geomCentral8)
def roiCentral9 = GeometryTools.geometryToROI(geomCentral9, plane)
def annotationCentral9 = PathObjects.createAnnotationObject(roiCentral9)
annotationCentral9.setName("Central Ring " + ROIName)
annotationCentral9.setColorRGB(colorCentral)

// Get the 9th inner margin area
def geomInner8 = geomCentral8// change from geomcentral9
geomInner8 = geomCentral8.difference(geomCentral9)
//geomInner1 = geomInner.intersection(areaTissue)
def roiInner8 = GeometryTools.geometryToROI(geomInner8, plane)
def annotationInner9 = PathObjects.createAnnotationObject(roiInner8)
annotationInner9.setName("9th Ring " + ROIName)
annotationInner9.setColorRGB(coloInner9Margin)


// Add the annotations, added annotationInner6 to 250
hierarchy.getSelectionModel().clearSelection()
hierarchy.removeObject(selected, true)
def annotationsToAdd = [annotationInner, annotationInner2, annotationInner3, annotationInner4,annotationInner5, annotationInner6, annotationInner7, annotationInner8, annotationInner9,  annotationCentral9];
annotationsToAdd.each {it.setLocked(lockAnnotations)}
hierarchy.addPathObjects(annotationsToAdd)
#Restore Annotation Script
//Set to false to restore test data for the entire project.
//True allows you to restore the data temporarily to the current image; you may then change images without saving or Reload to remove it quickly.
//Should be Run, ***NOT Run for Project.***
currentImageOnly = true

project=getProject()
current = getProjectEntry().getImageName()
project.getImageList().each{
    if (currentImageOnly && it.getImageName() == current){

        String imgName = it.getImageName()
        hierarchy = getCurrentHierarchy()

        createCurrentTrainingAreas(hierarchy, imgName)
        fireHierarchyUpdate()

    }else if(!currentImageOnly){
        print "CHANGES WILL NOT SHOW UP IN CURRENT IMAGE UNTIL YOU File->Reload data or change image"
        String imgName = it.getImageName()
        imageData = it.readImageData()
        hierarchy = imageData.getHierarchy()

        createTrainingAreas(hierarchy, imgName)
        it.saveImageData(imageData)
    }
}

def createTrainingAreas(hierarchy, imgName){
    def gson = GsonTools.getInstance(true);
    def type = new com.google.gson.reflect.TypeToken<List<qupath.lib.objects.PathObject>>() {}.getType();

    path = buildFilePath(PROJECT_BASE_DIR, 'testSetPoints')
    def json = new File(buildFilePath(PROJECT_BASE_DIR, 'testSetPoints', imgName + ".testarea"))
    deserializedAnnotations = gson.fromJson(json.getText('UTF-8'), type);
    hierarchy.addPathObjects(deserializedAnnotations)
    }


def createCurrentTrainingAreas(hierarchy, imgName){
    def gson = GsonTools.getInstance(true);
    def type = new com.google.gson.reflect.TypeToken<List<qupath.lib.objects.PathObject>>() {}.getType();

    path = buildFilePath(PROJECT_BASE_DIR, 'testSetPoints')
    def json = new File(buildFilePath(PROJECT_BASE_DIR, 'testSetPoints', imgName + ".testarea"))
    deserializedAnnotations = gson.fromJson(json.getText('UTF-8'), type);
    addObjects(deserializedAnnotations)
    }
Select all detections, insert detections into hierarchy and save to analyze positivity per partition
Export Results
Export detection results for all annotations ( Export > Export Measurements ). Export file types include .tsv and .csv files.
