Proteome-wide structural changes measured with limited proteolysis-mass spectrometry: an advanced protocol for high-throughput applications
Monika Pepelnjak, Patrick Stalder, Christian Dörig, Fabian Sesterhenn, Franziska Elsässer, Lucie Kralickova, Nigel Beaton, Devon Kohler, Olga Vitek, Liliana Malinovska, Valentina Cappelletti, Ilaria Piazza, Tsung-Heng Tsai, Lukas Reiter, Natalie de Souza, Paola Picotti

Extended
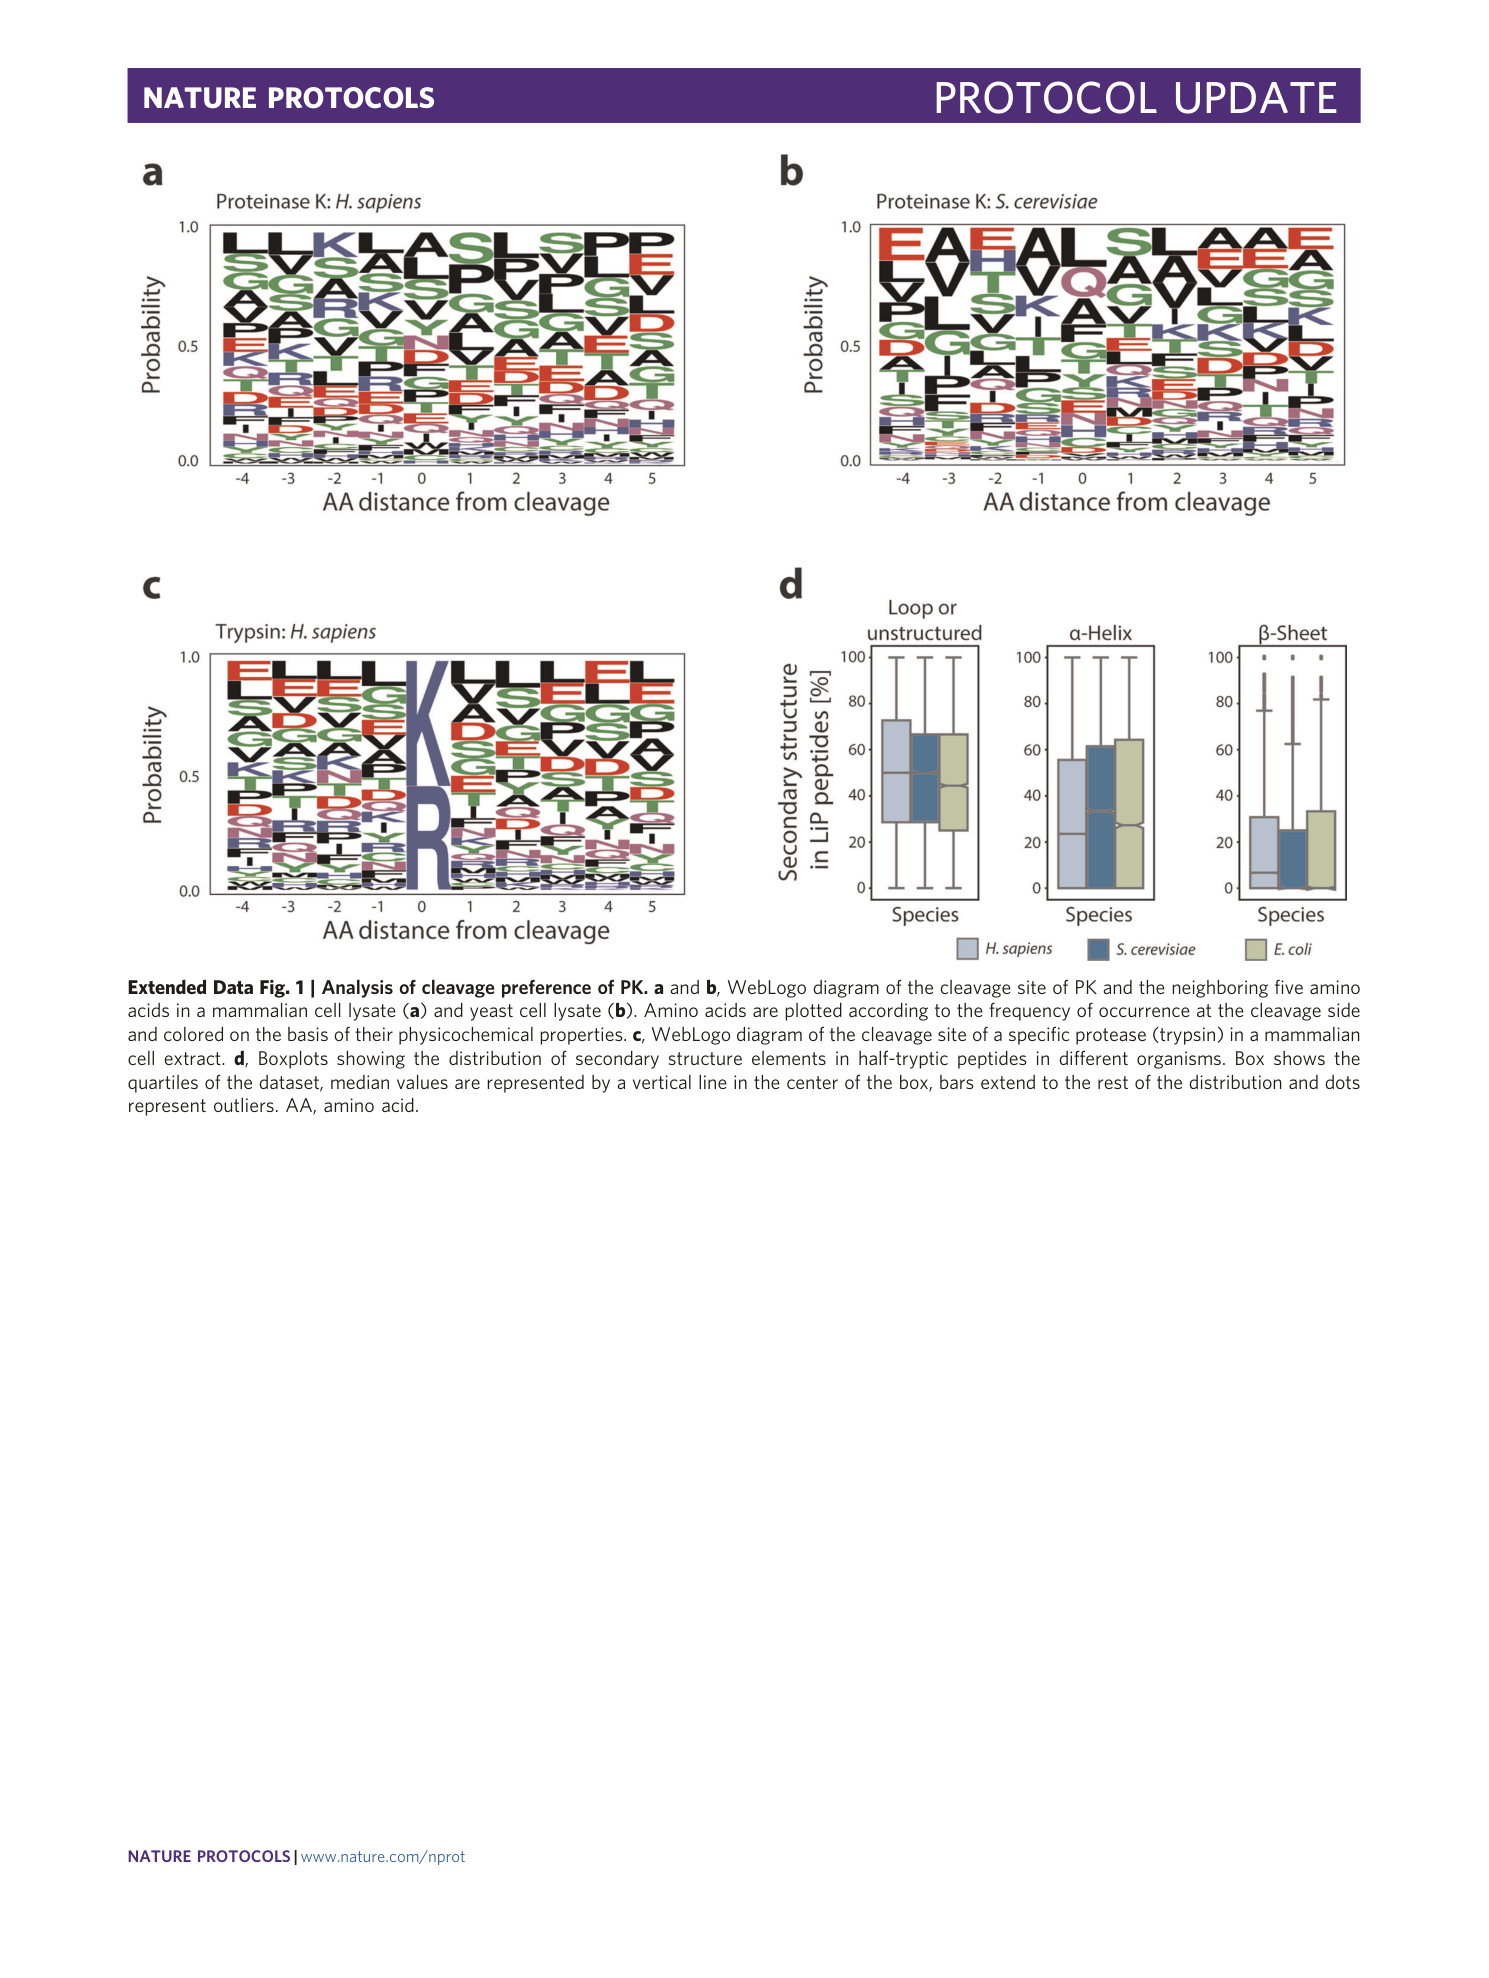
Extended Data Fig. 1 Analysis of cleavage preference of PK.
a and b , WebLogo diagram of the cleavage site of PK and the neighboring five amino acids in a mammalian cell lysate ( a ) and yeast cell lysate ( b ). Amino acids are plotted according to the frequency of occurrence at the cleavage side and colored on the basis of their physicochemical properties. c , WebLogo diagram of the cleavage site of a specific protease (trypsin) in a mammalian cell extract. d , Boxplots showing the distribution of secondary structure elements in half-tryptic peptides in different organisms. Box shows the quartiles of the dataset, median values are represented by a vertical line in the center of the box, bars extend to the rest of the distribution and dots represent outliers. AA, amino acid.
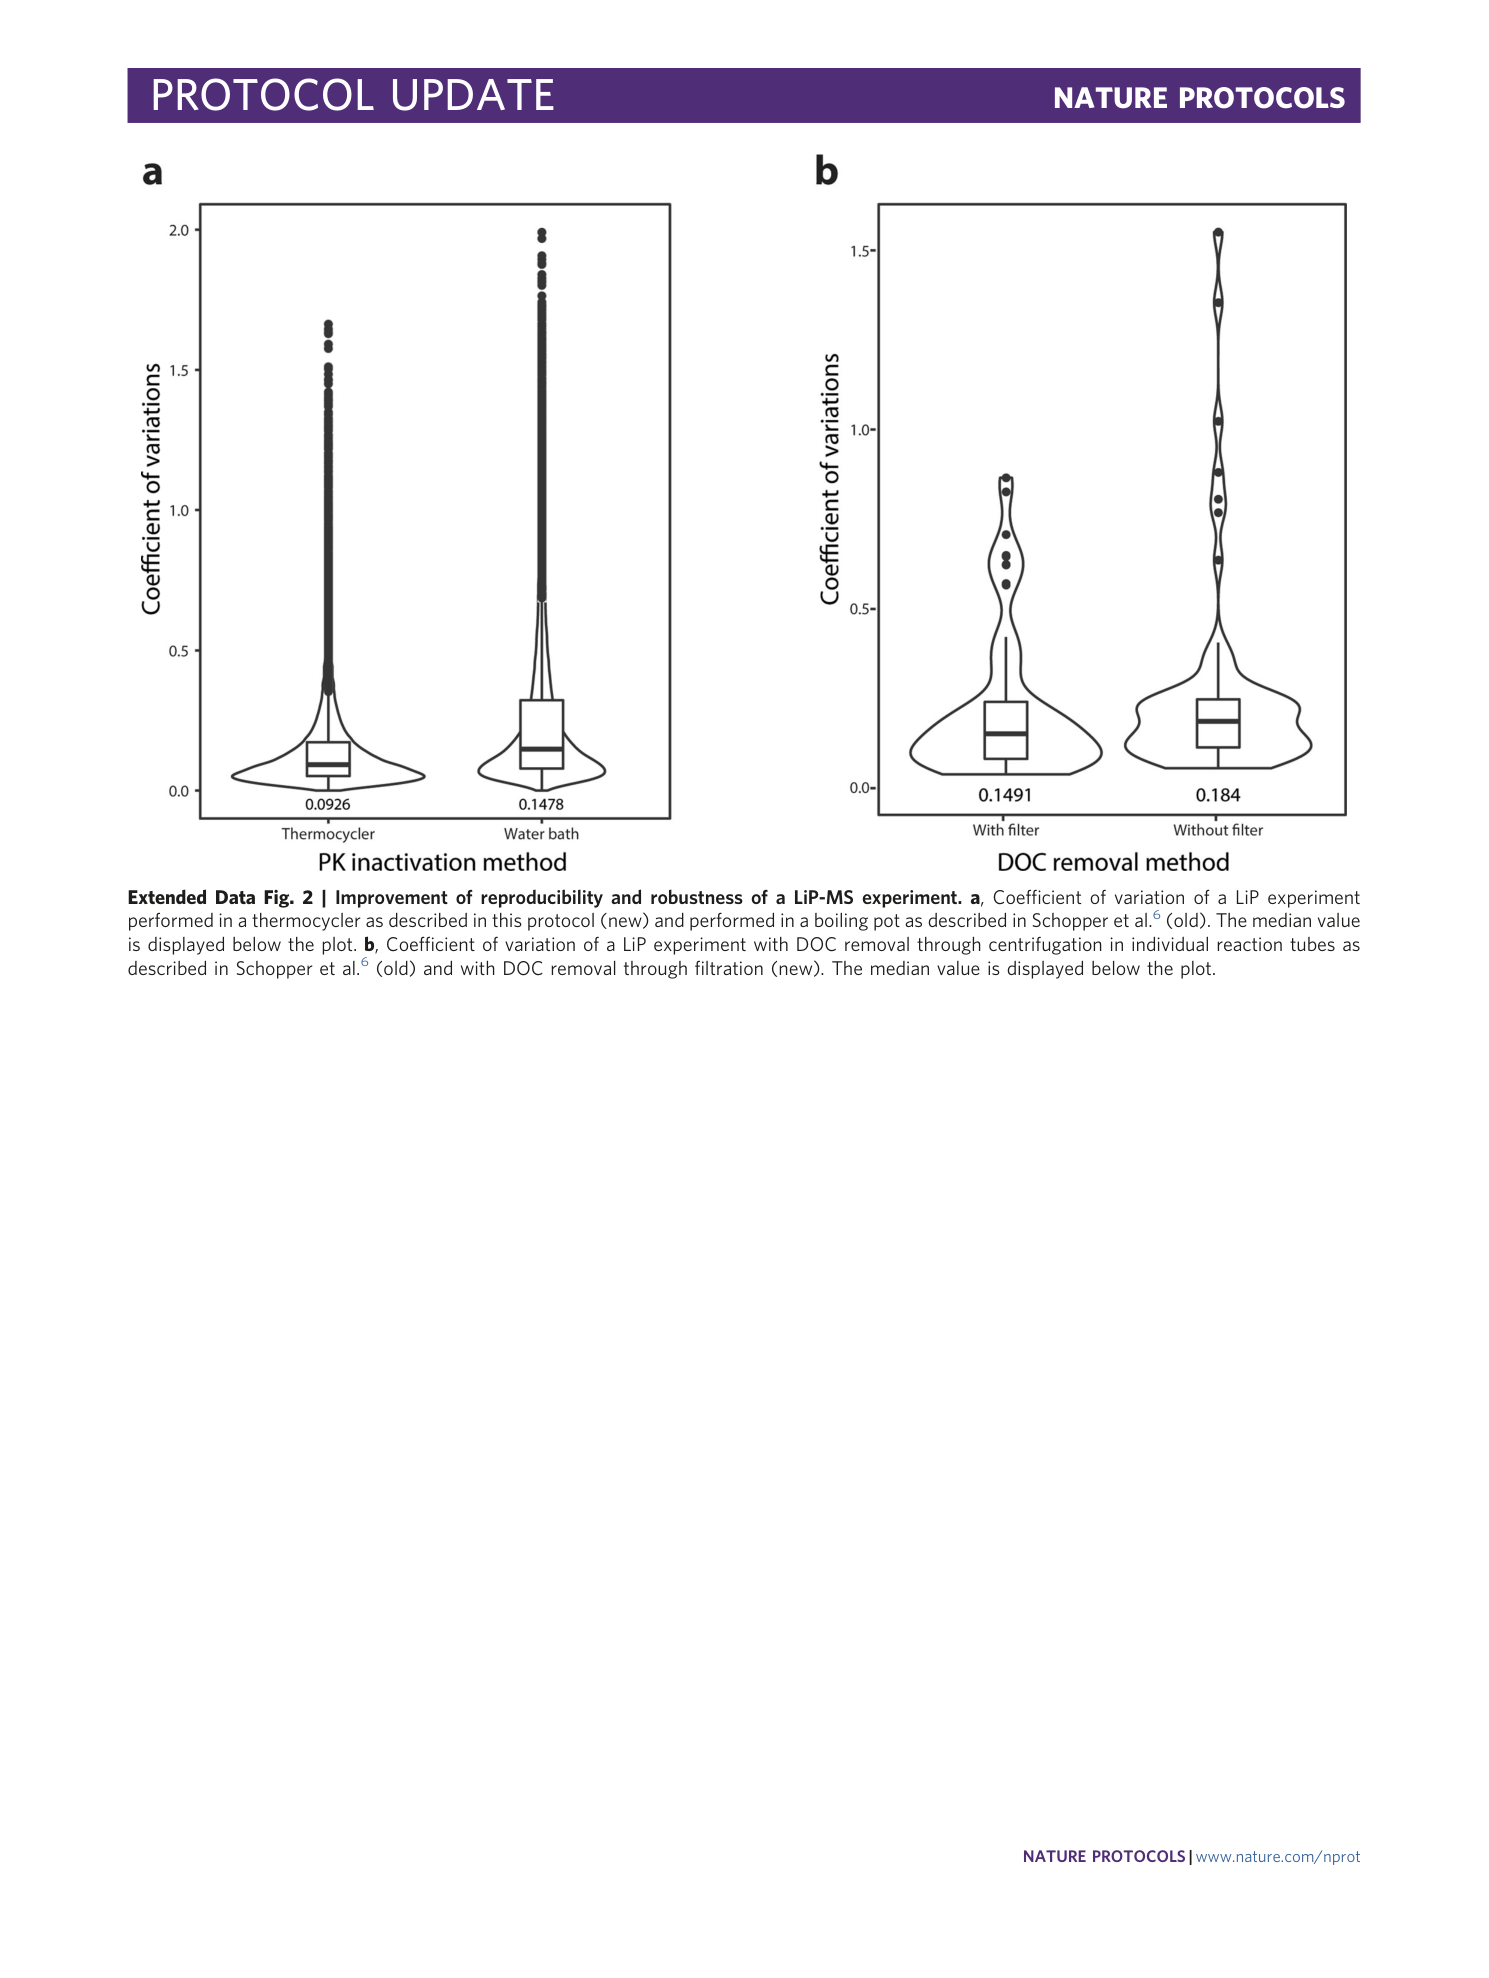
Extended Data Fig. 2 Improvement of reproducibility and robustness of a LiP-MS experiment.
a , Coefficient of variation of a LiP experiment performed in a thermocycler as described in this protocol (new) and performed in a boiling pot as described in Schopper et al. 6 (old). The median value is displayed below the plot. b , Coefficient of variation of a LiP experiment with DOC removal through centrifugation in individual reaction tubes as described in Schopper et al. 6 (old) and with DOC removal through filtration (new). The median value is displayed below the plot.
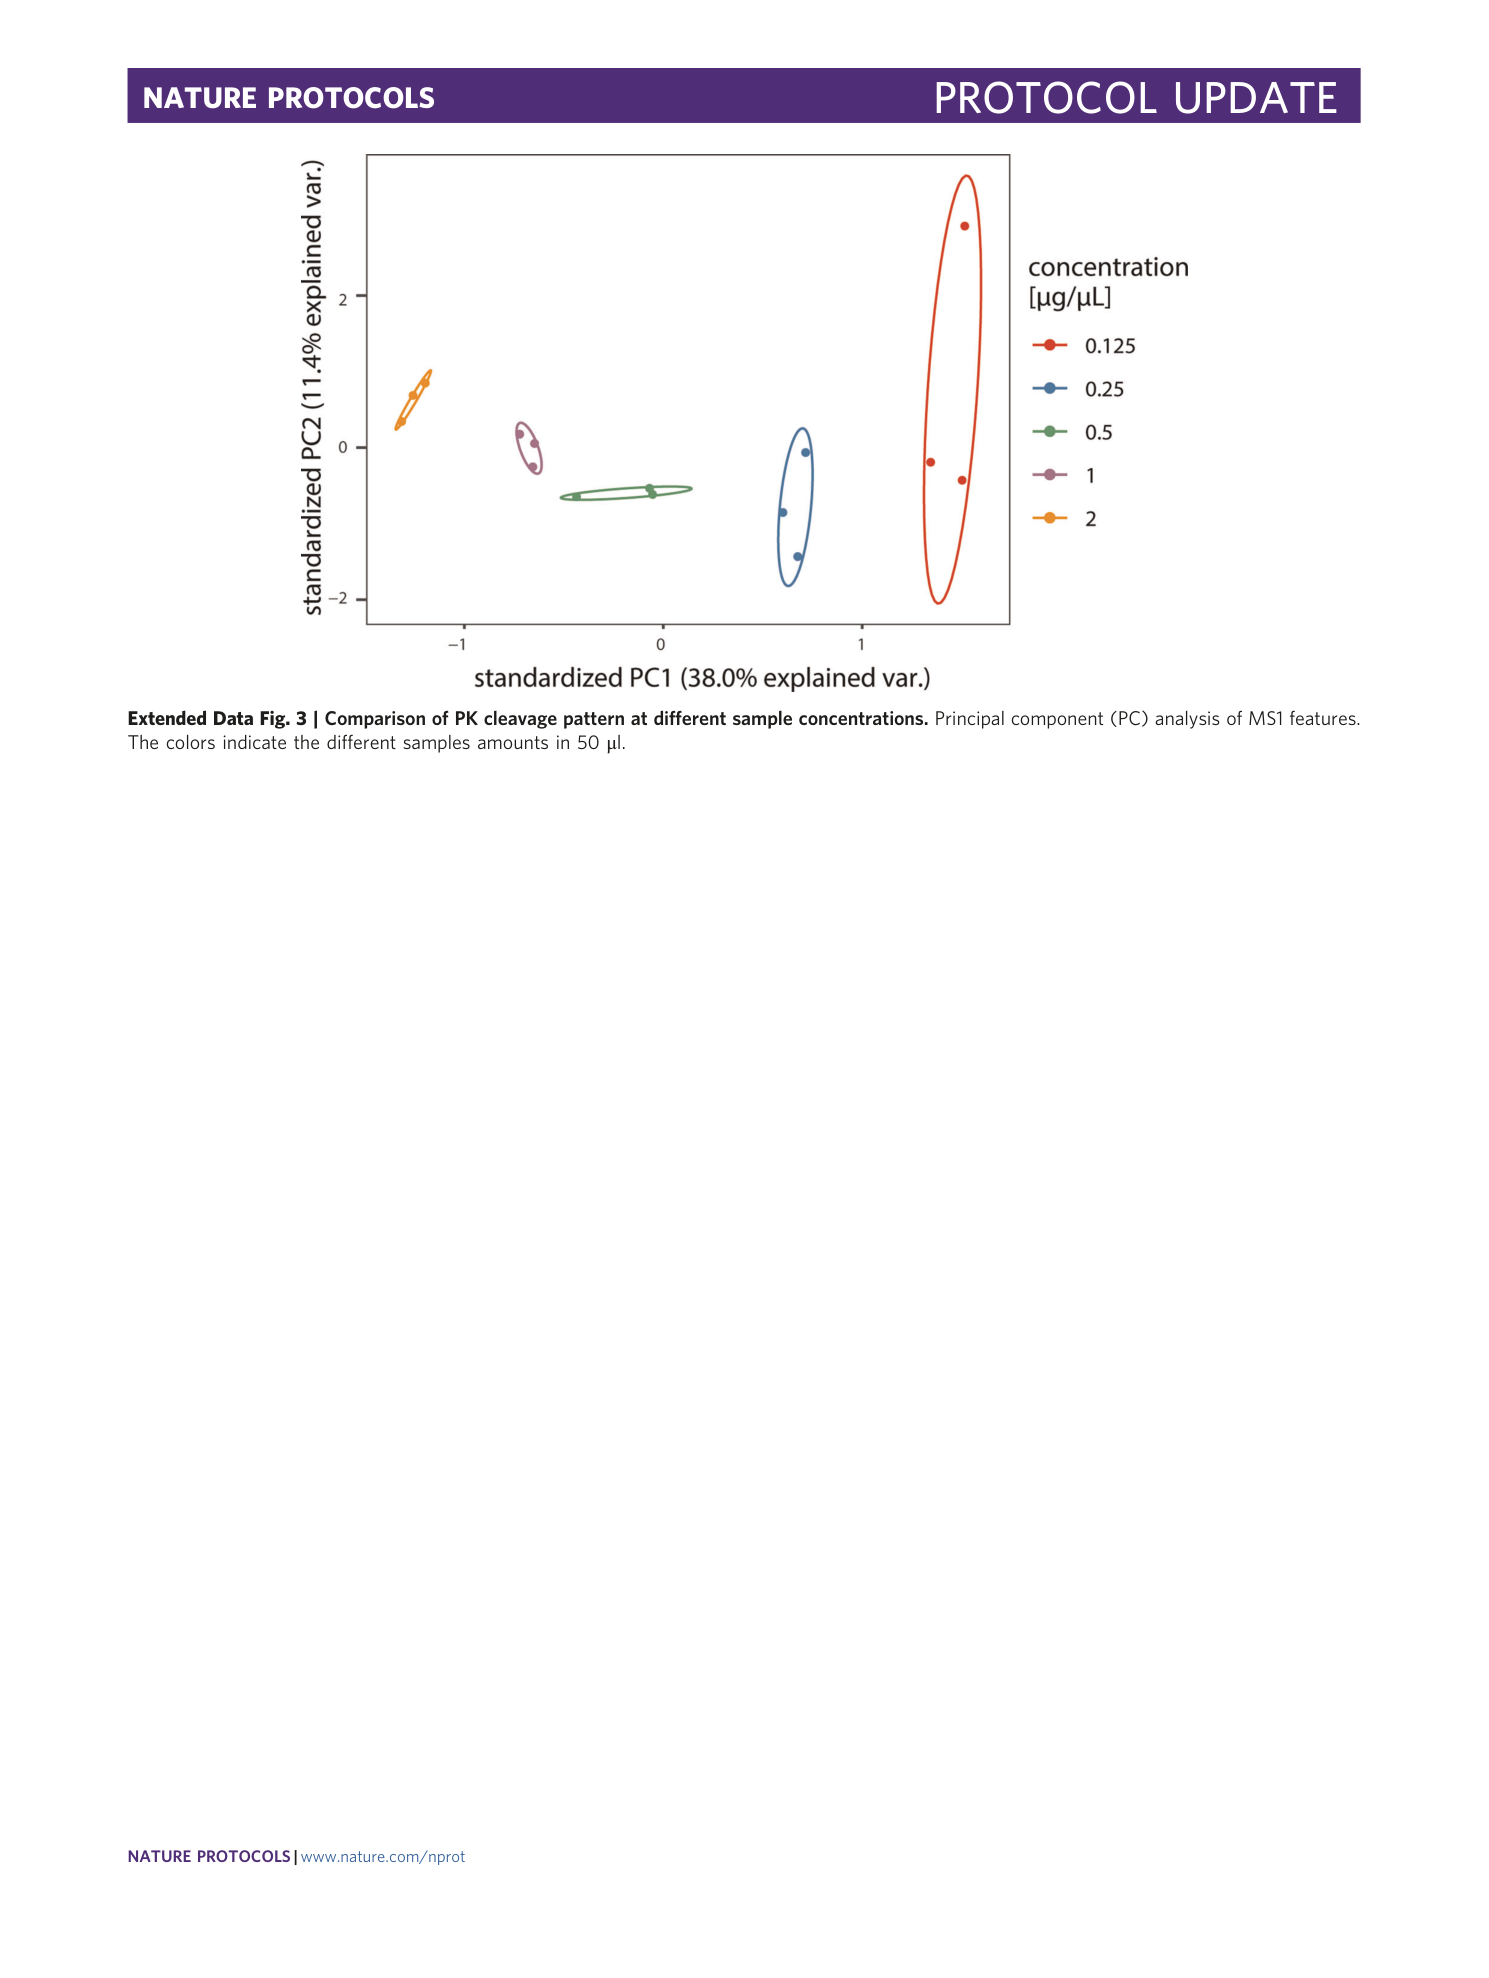
Extended Data Fig. 3 Comparison of PK cleavage pattern at different sample concentrations.
Principal component (PC) analysis of MS1 features. The colors indicate the different samples amounts in 50 μl.
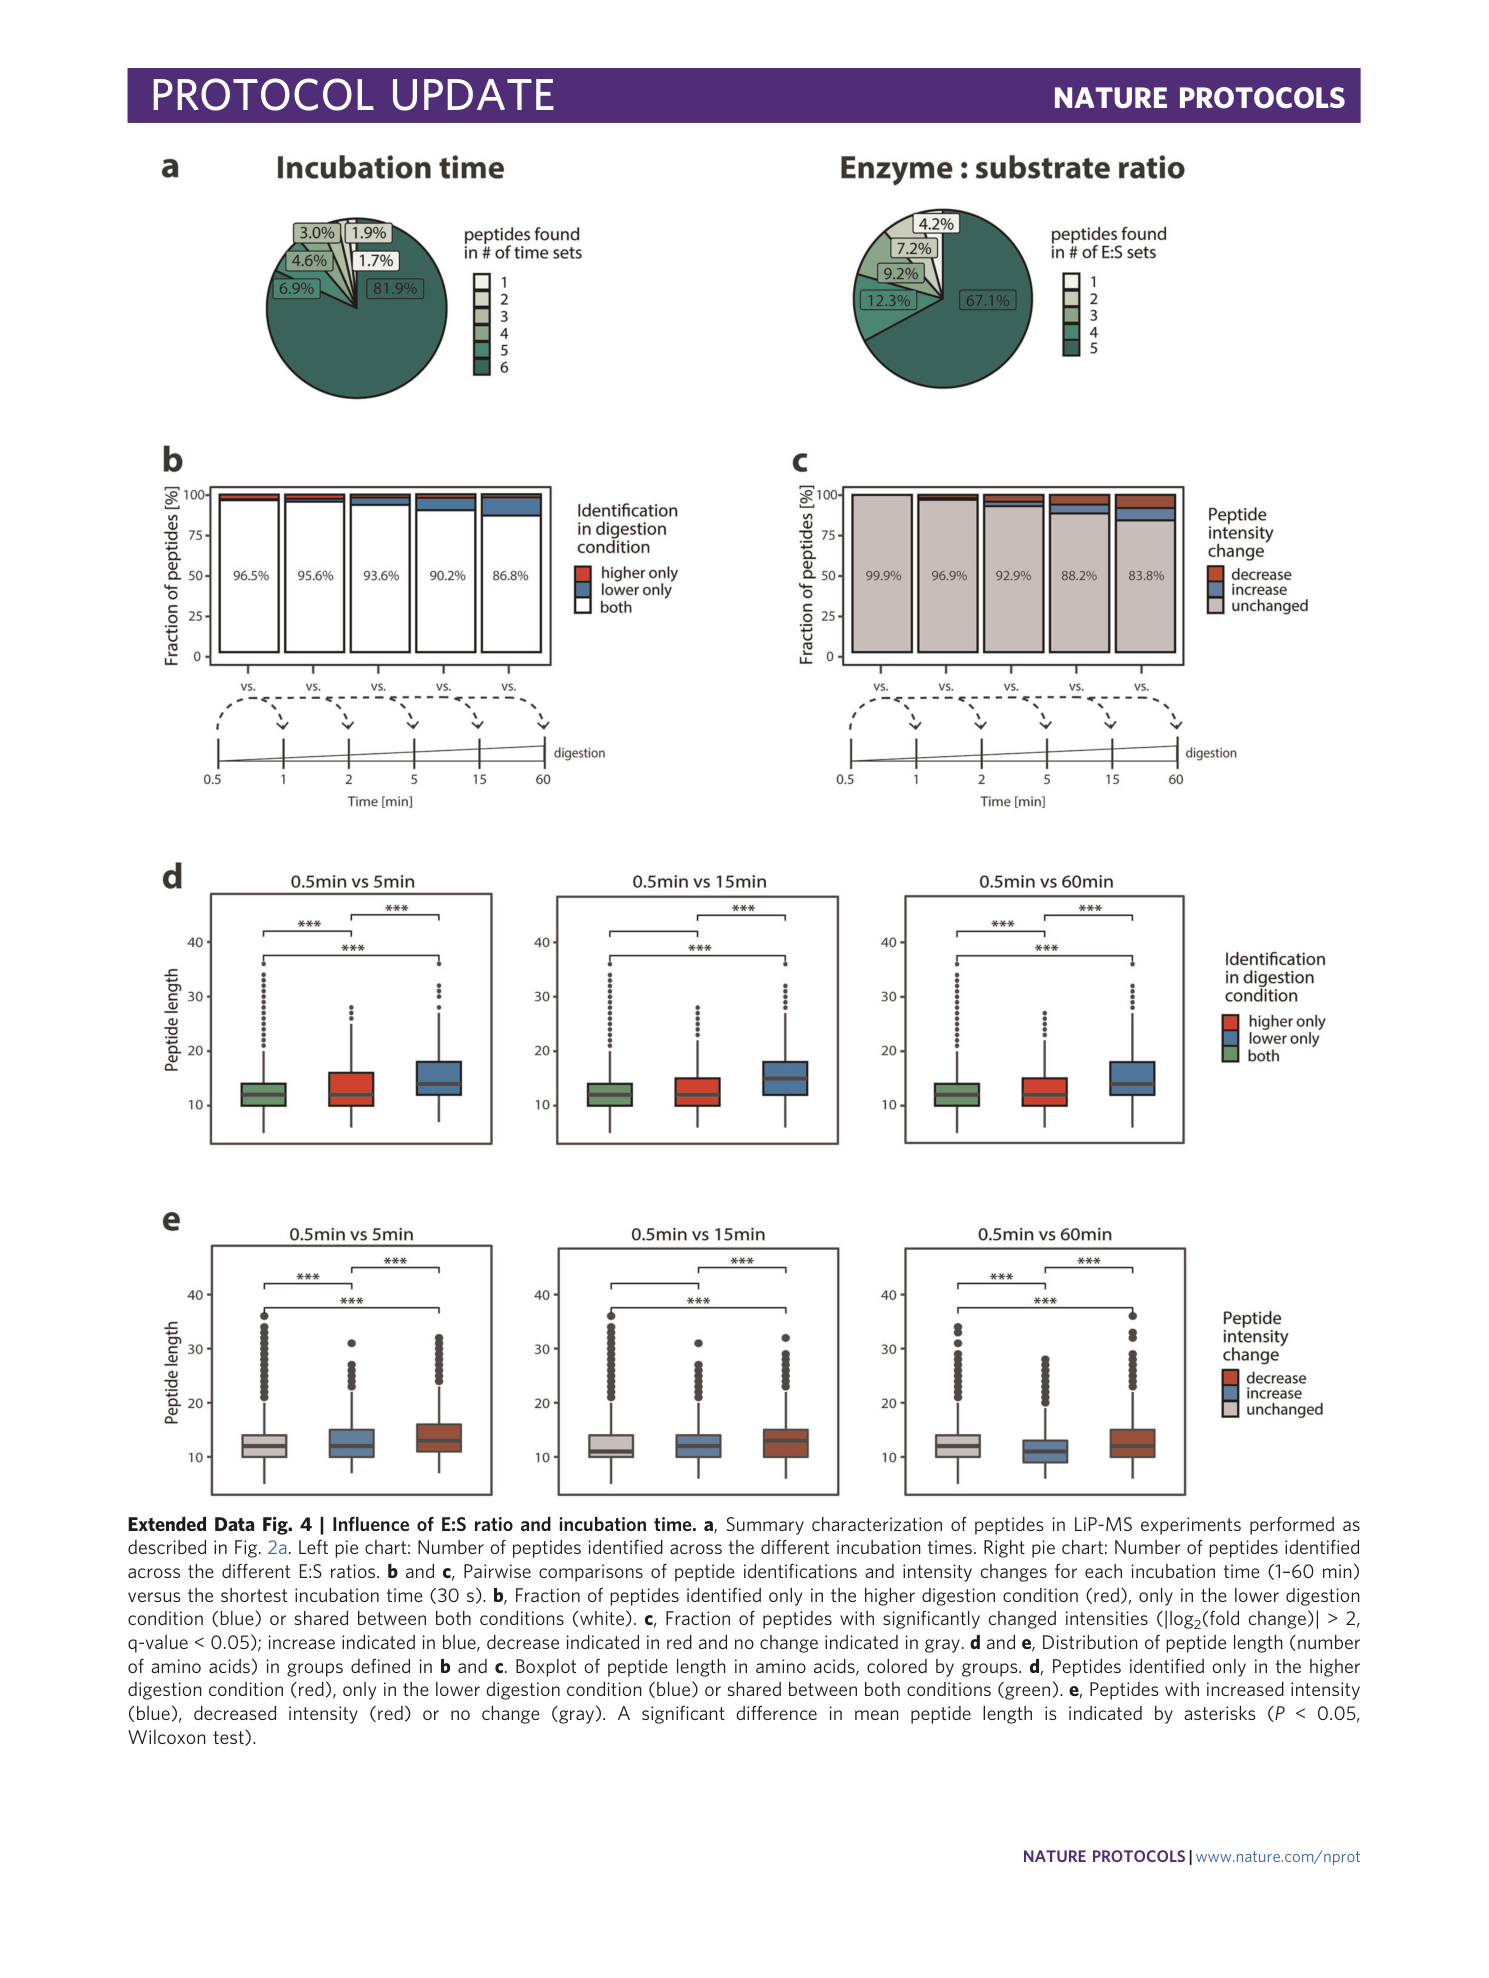
Extended Data Fig. 4 Influence of E:S ratio and incubation time.
a , Summary characterization of peptides in LiP-MS experiments performed as described in Fig. 2a . Left pie chart: Number of peptides identified across the different incubation times. Right pie chart: Number of peptides identified across the different E:S ratios. b and c , Pairwise comparisons of peptide identifications and intensity changes for each incubation time (1–60 min) versus the shortest incubation time (30 s). b , Fraction of peptides identified only in the higher digestion condition (red), only in the lower digestion condition (blue) or shared between both conditions (white). c , Fraction of peptides with significantly changed intensities (|log 2 (fold change)| > 2, q-value < 0.05); increase indicated in blue, decrease indicated in red and no change indicated in gray. d and e , Distribution of peptide length (number of amino acids) in groups defined in b and c . Boxplot of peptide length in amino acids, colored by groups. d , Peptides identified only in the higher digestion condition (red), only in the lower digestion condition (blue) or shared between both conditions (green). e , Peptides with increased intensity (blue), decreased intensity (red) or no change (gray). A significant difference in mean peptide length is indicated by asterisks ( P < 0.05, Wilcoxon test).
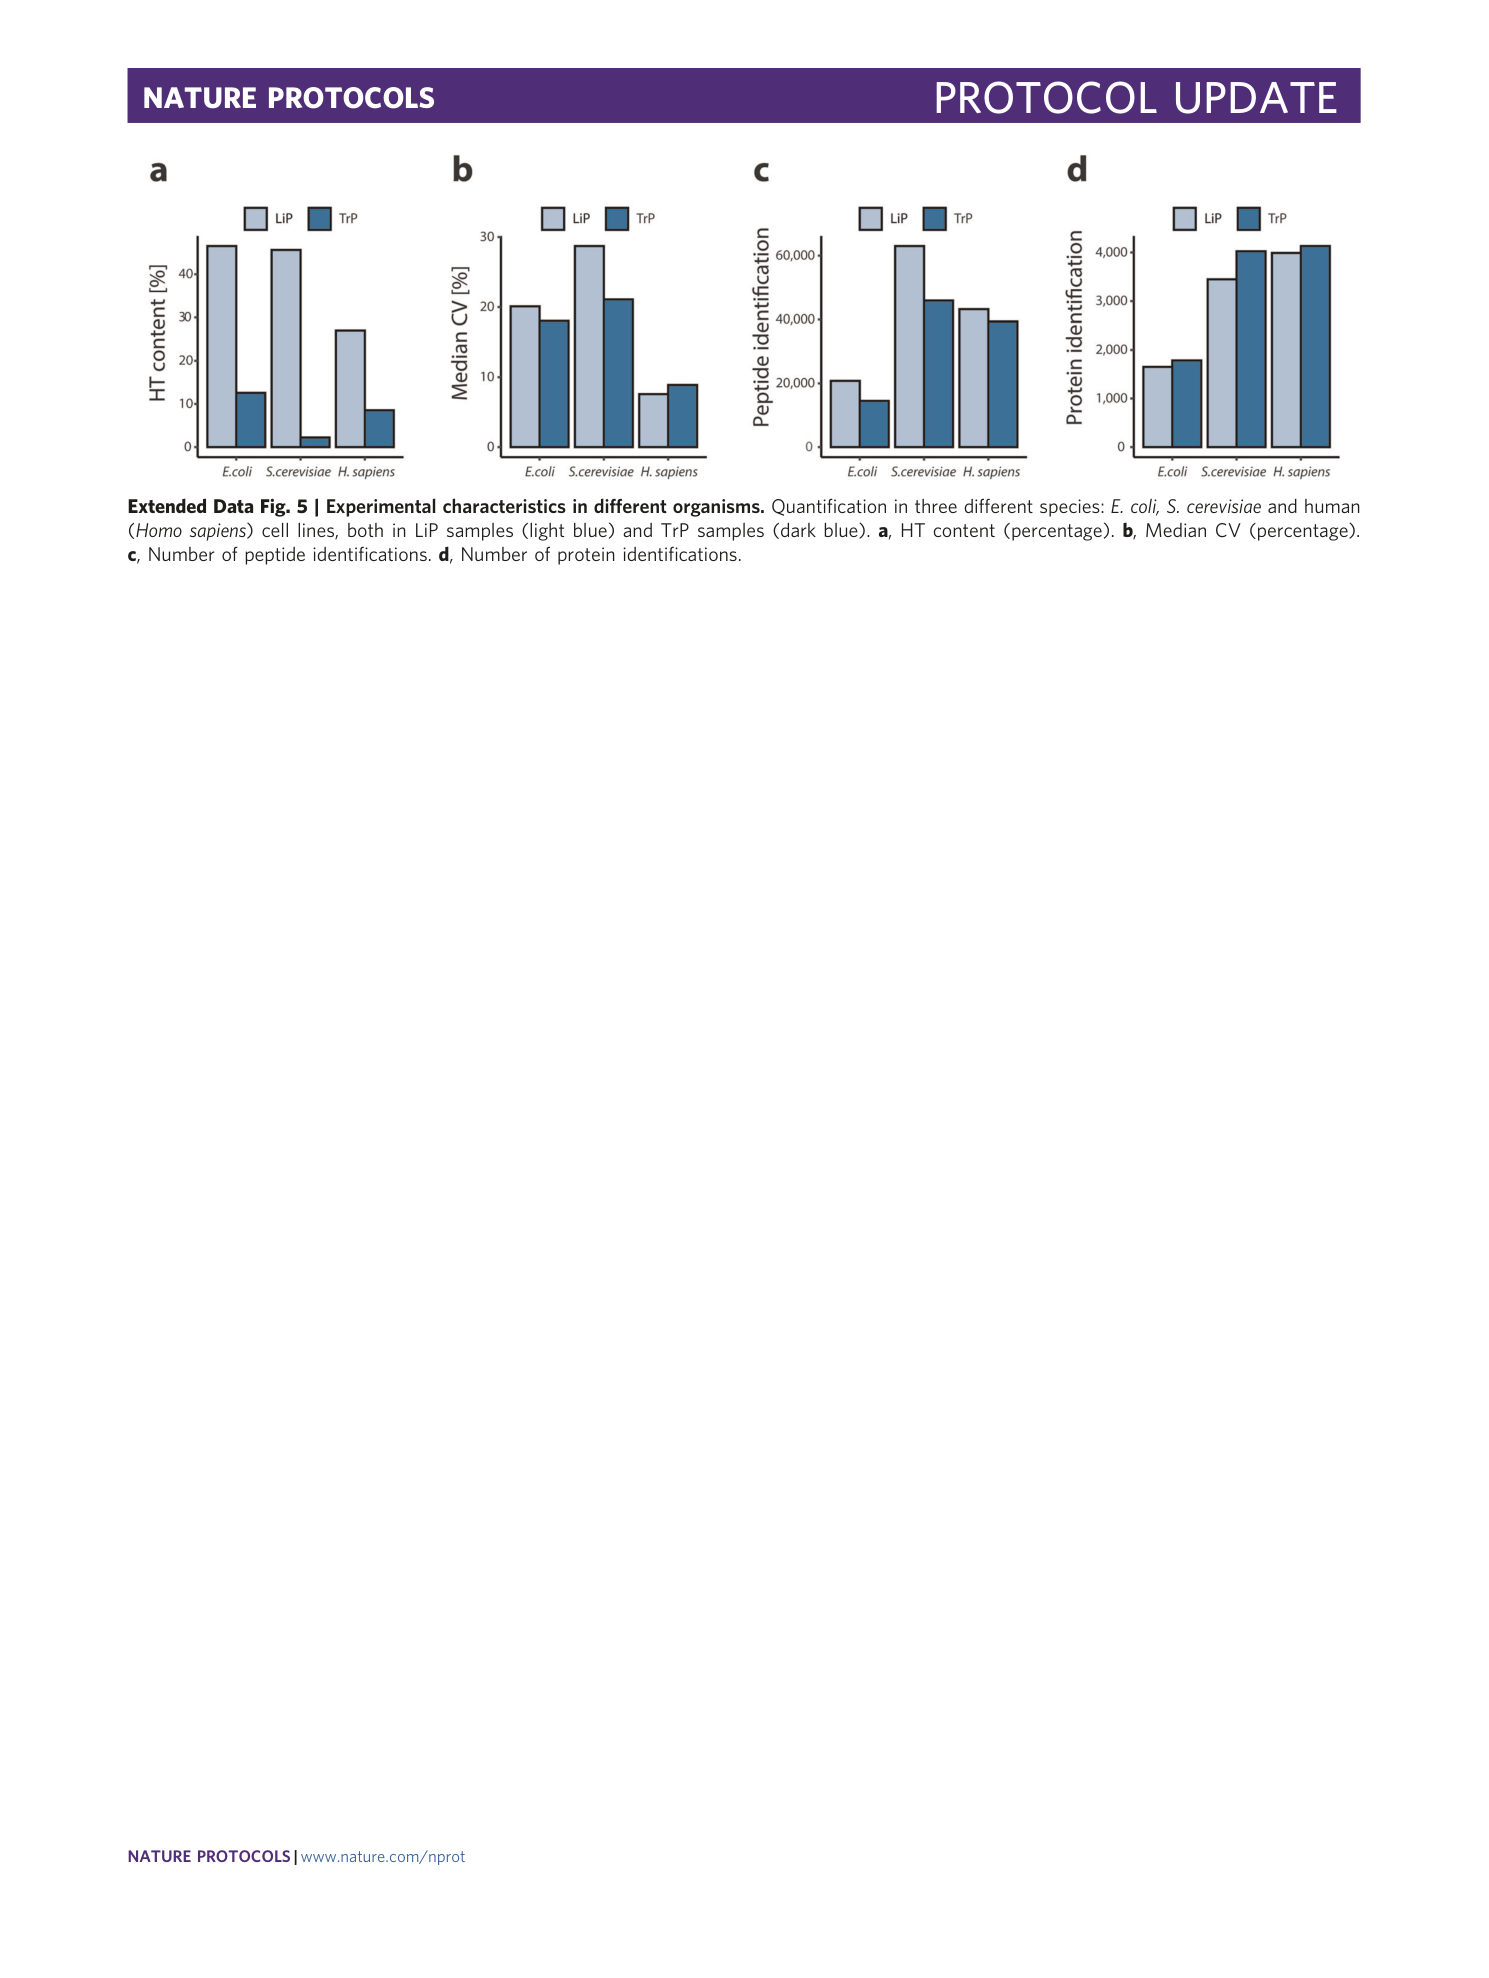
Extended Data Fig. 5 Experimental characteristics in different organisms.
Quantification in three different species: E. coli, S. cerevisiae and human ( Homo sapiens ) cell lines, both in LiP samples (light blue) and TrP samples (dark blue). a , HT content (percentage). b , Median CV (percentage). c , Number of peptide identifications. d , Number of protein identifications.
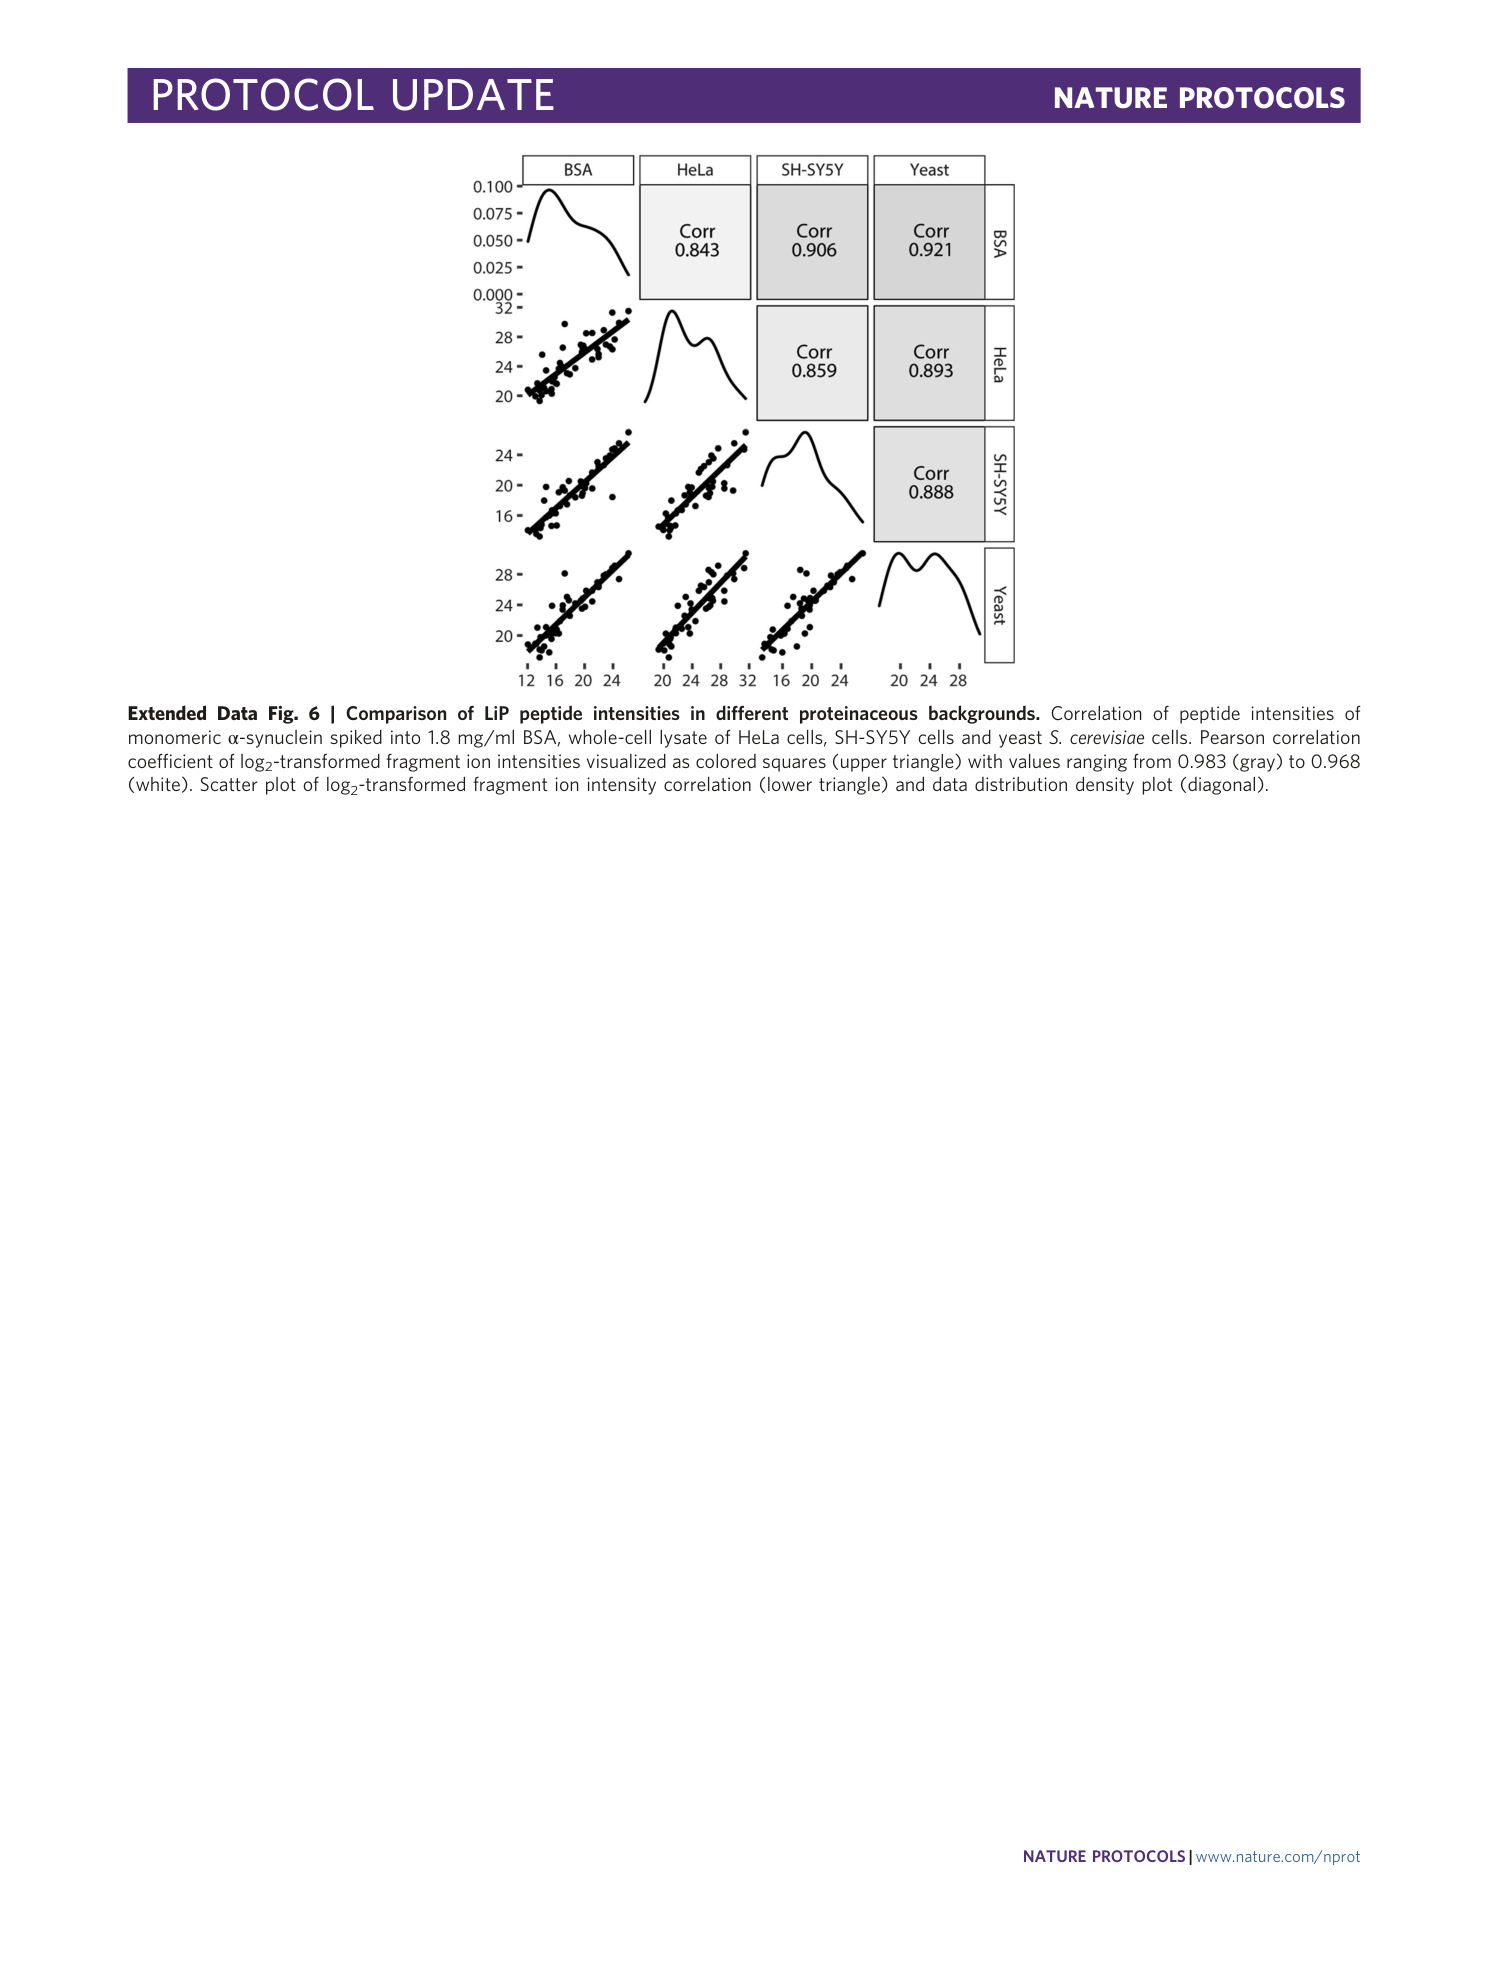
Extended Data Fig. 6 Comparison of LiP peptide intensities in different proteinaceous backgrounds.
Correlation of peptide intensities of monomeric α-synuclein spiked into 1.8 mg/ml BSA, whole-cell lysate of HeLa cells, SH-SY5Y cells and yeast S. cerevisiae cells. Pearson correlation coefficient of log 2 -transformed fragment ion intensities visualized as colored squares (upper triangle) with values ranging from 0.983 (gray) to 0.968 (white). Scatter plot of log 2 -transformed fragment ion intensity correlation (lower triangle) and data distribution density plot (diagonal).
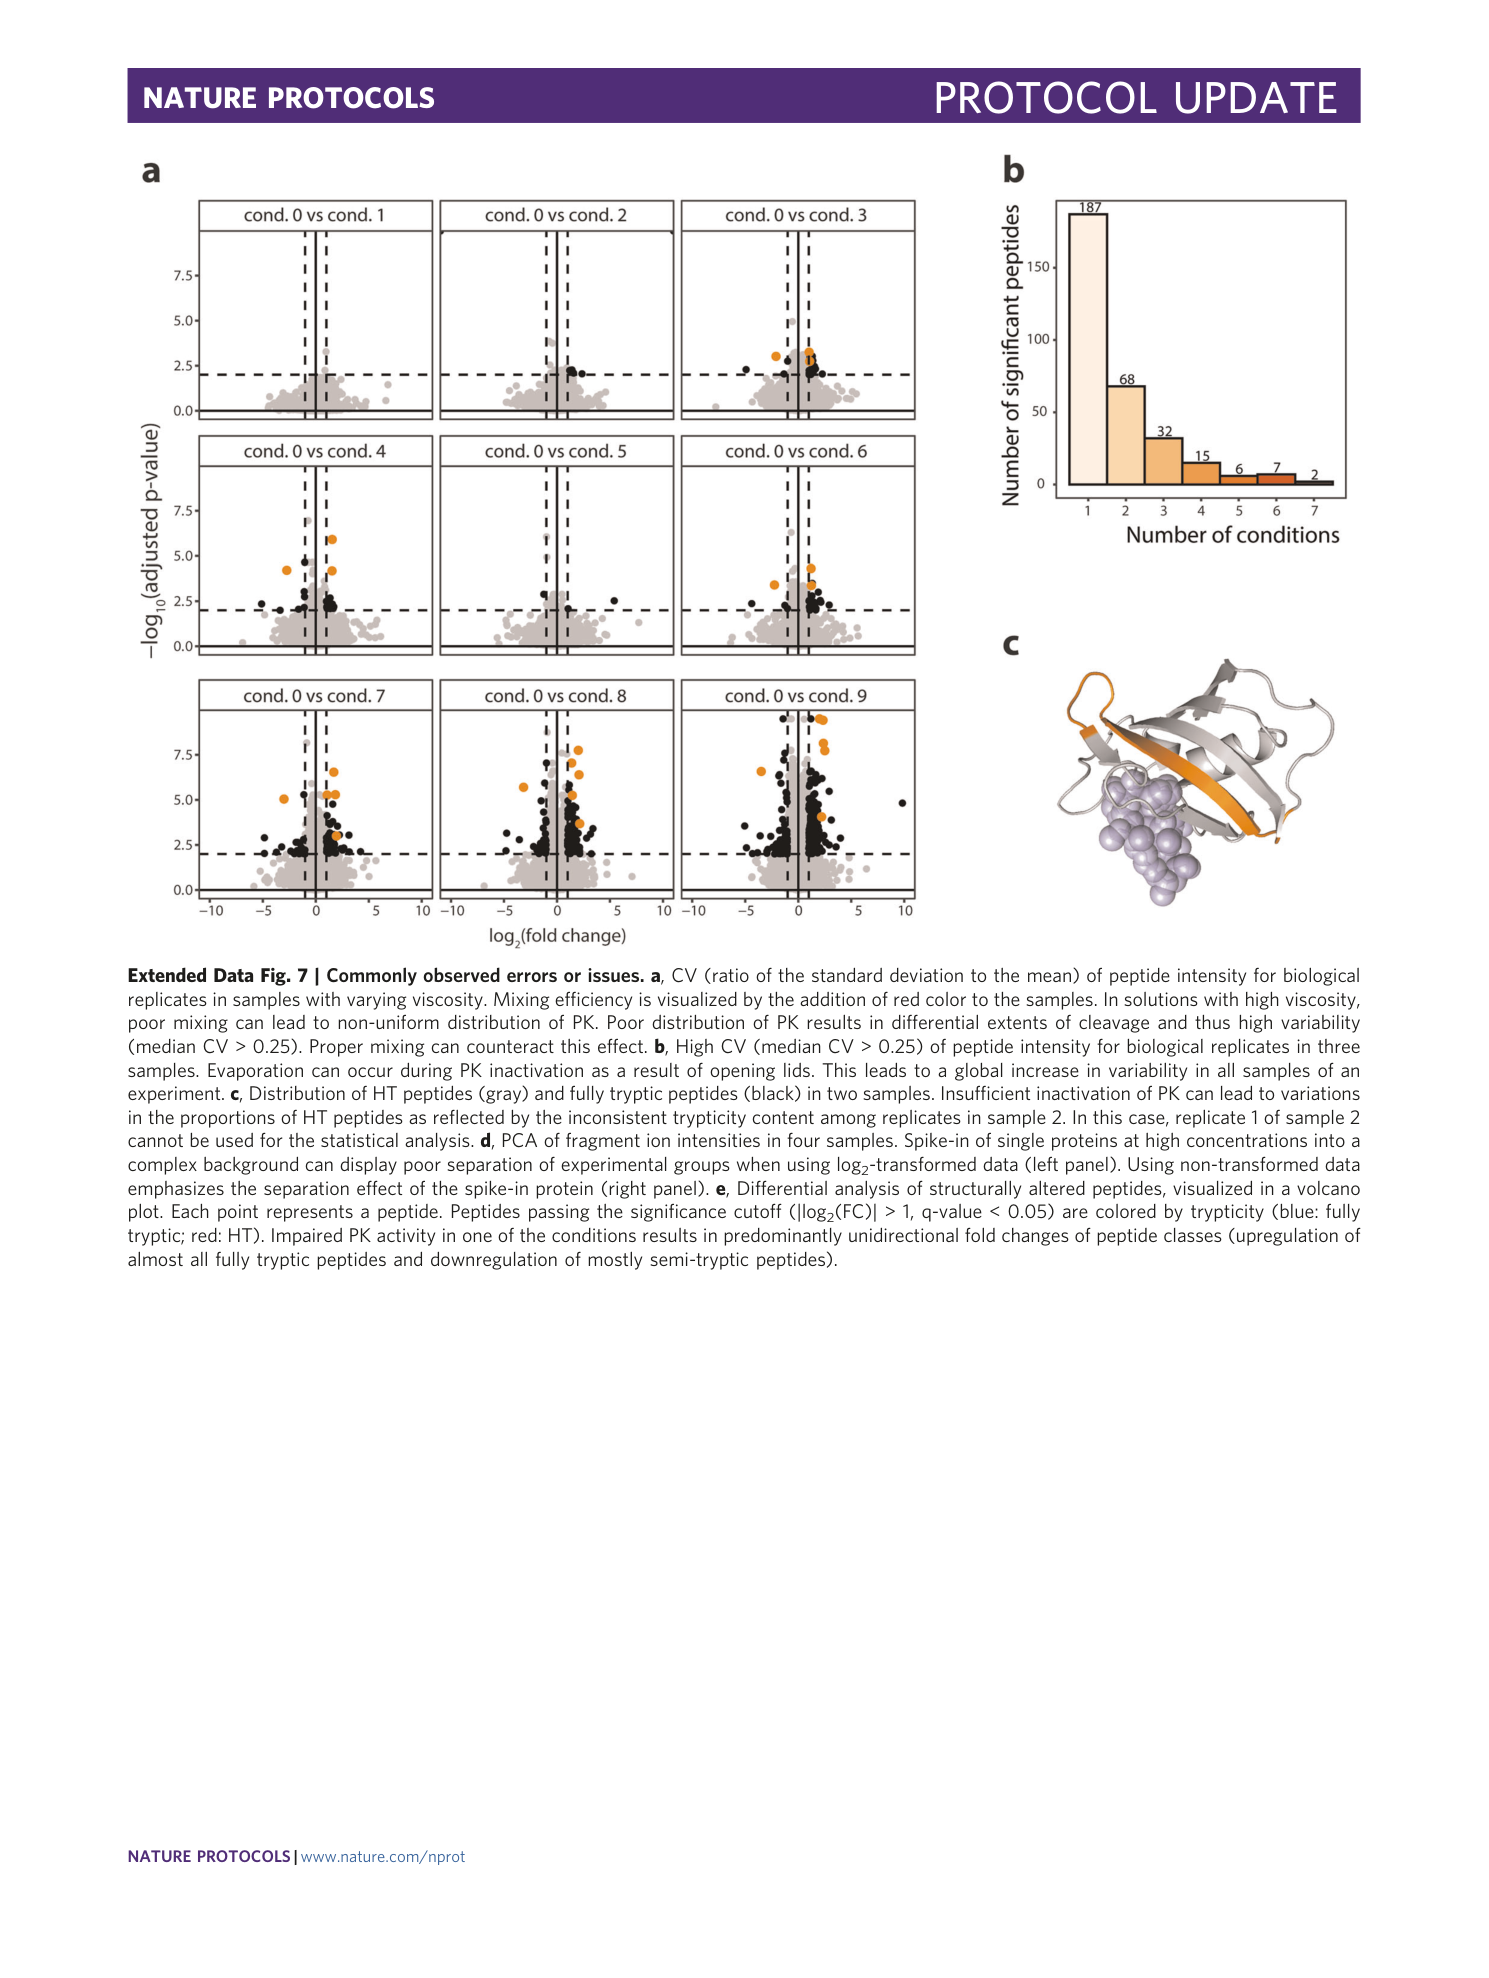
Extended Data Fig. 7 Commonly observed errors or issues.
a , CV (ratio of the standard deviation to the mean) of peptide intensity for biological replicates in samples with varying viscosity. Mixing efficiency is visualized by the addition of red color to the samples. In solutions with high viscosity, poor mixing can lead to non-uniform distribution of PK. Poor distribution of PK results in differential extents of cleavage and thus high variability (median CV > 0.25). Proper mixing can counteract this effect. b , High CV (median CV > 0.25) of peptide intensity for biological replicates in three samples. Evaporation can occur during PK inactivation as a result of opening lids. This leads to a global increase in variability in all samples of an experiment. c , Distribution of HT peptides (gray) and fully tryptic peptides (black) in two samples. Insufficient inactivation of PK can lead to variations in the proportions of HT peptides as reflected by the inconsistent trypticity content among replicates in sample 2. In this case, replicate 1 of sample 2 cannot be used for the statistical analysis. d , PCA of fragment ion intensities in four samples. Spike-in of single proteins at high concentrations into a complex background can display poor separation of experimental groups when using log 2 -transformed data (left panel). Using non-transformed data emphasizes the separation effect of the spike-in protein (right panel). e , Differential analysis of structurally altered peptides, visualized in a volcano plot. Each point represents a peptide. Peptides passing the significance cutoff (|log 2 (FC)| > 1, q-value < 0.05) are colored by trypticity (blue: fully tryptic; red: HT). Impaired PK activity in one of the conditions results in predominantly unidirectional fold changes of peptide classes (upregulation of almost all fully tryptic peptides and downregulation of mostly semi-tryptic peptides).
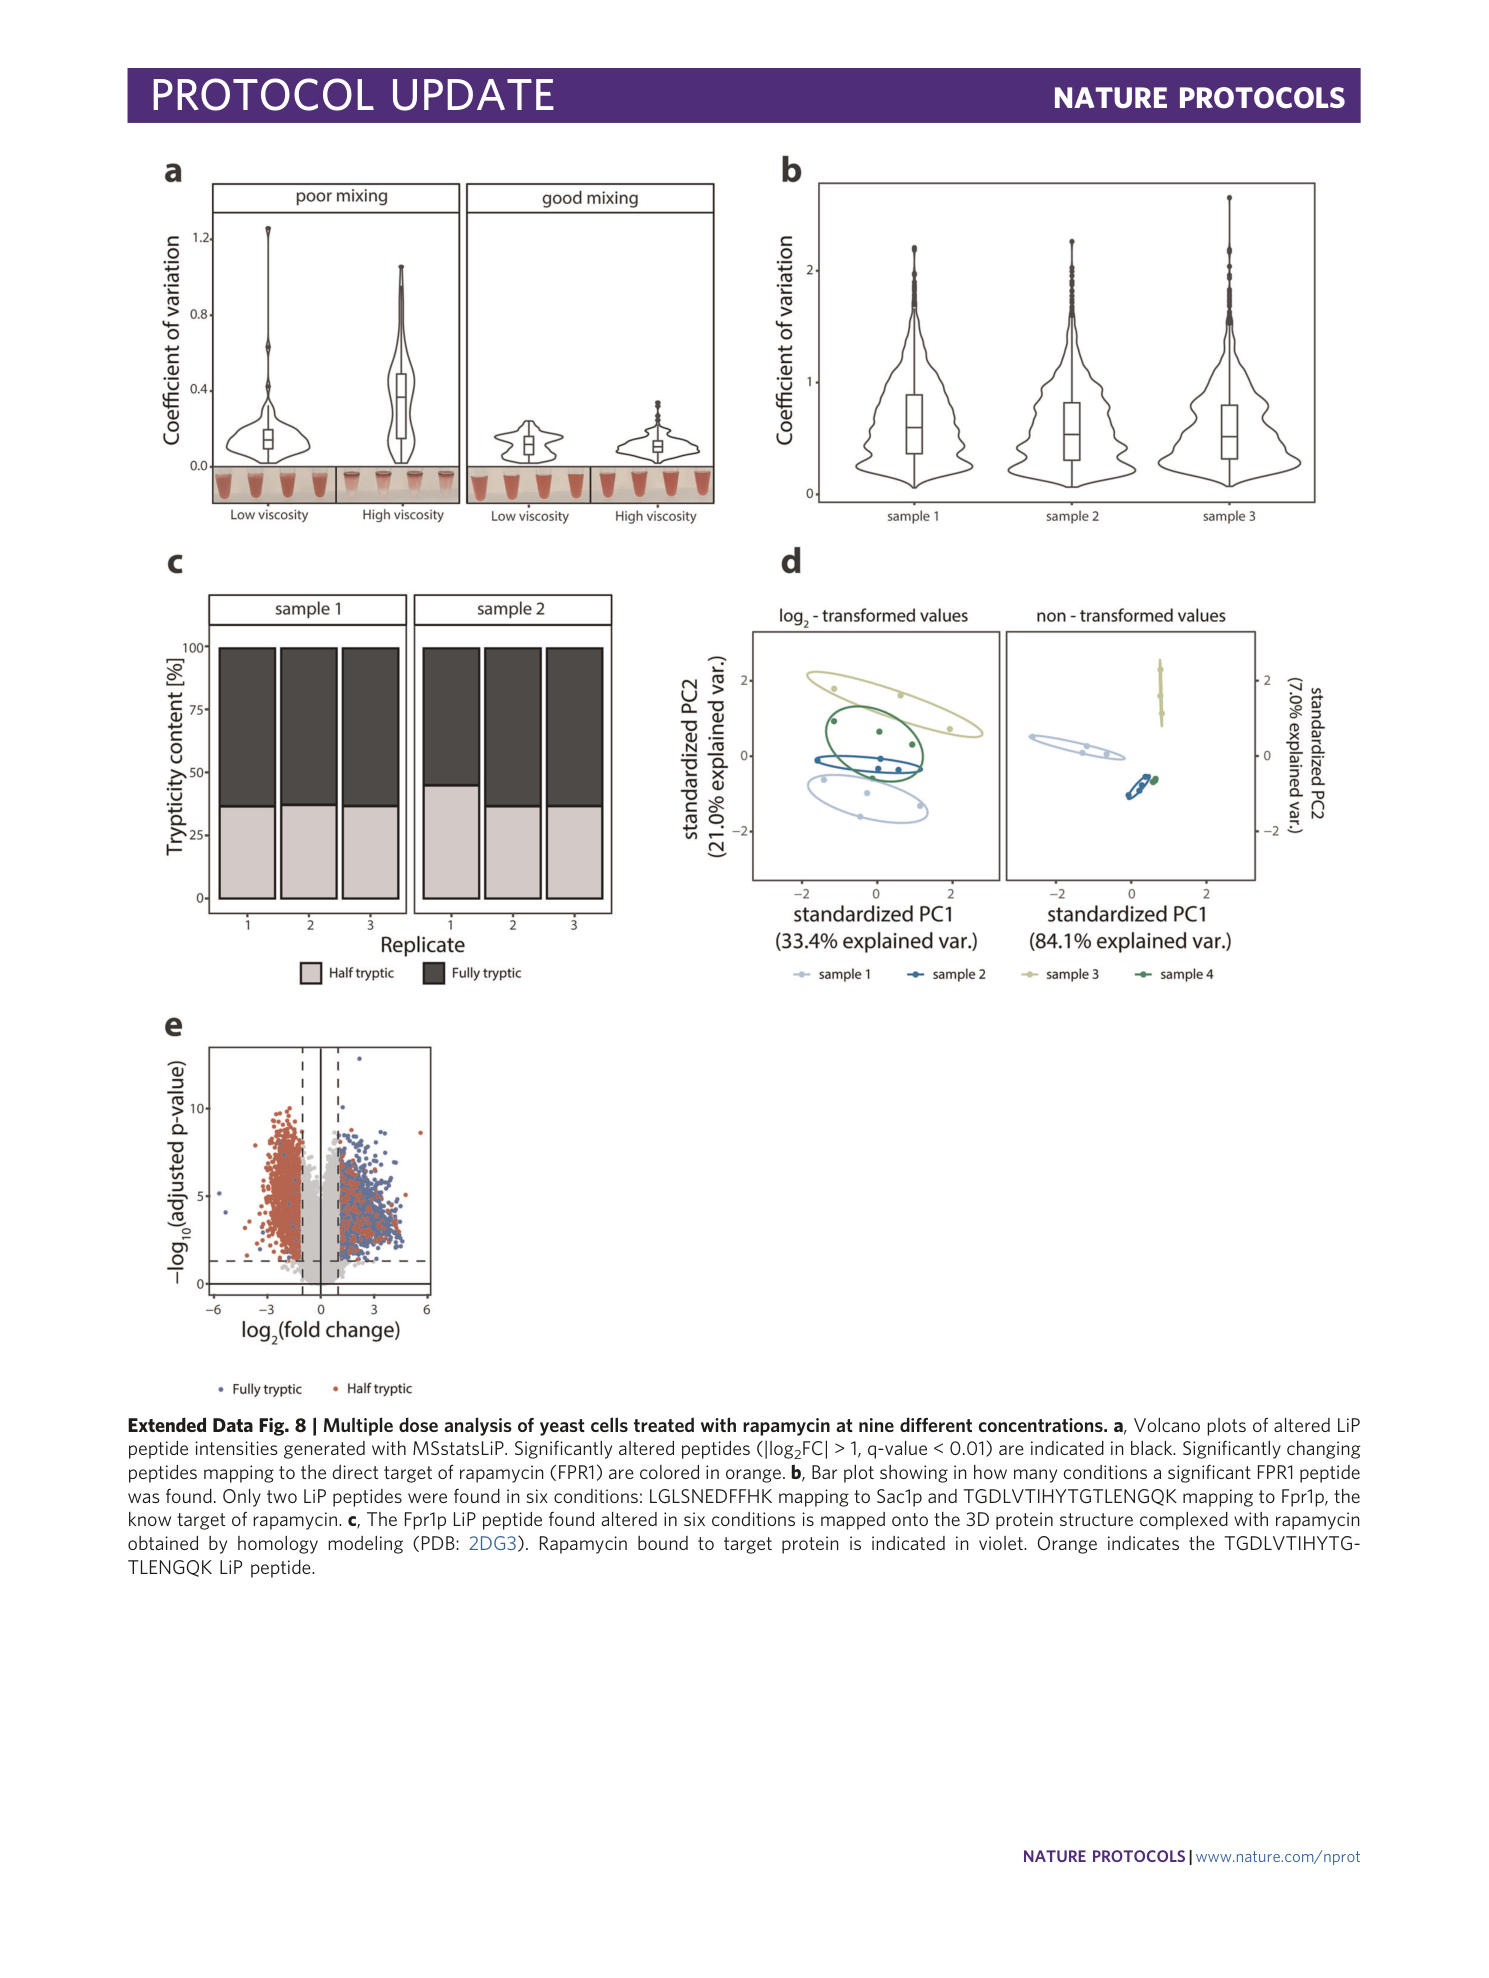
Extended Data Fig. 8 Multiple dose analysis of yeast cells treated with rapamycin at nine different concentrations.
a , Volcano plots of altered LiP peptide intensities generated with MSstatsLiP. Significantly altered peptides (|log 2 FC| > 1, q-value < 0.01) are indicated in black. Significantly changing peptides mapping to the direct target of rapamycin (FPR1) are colored in orange. b , Bar plot showing in how many conditions a significant FPR1 peptide was found. Only two LiP peptides were found in six conditions: LGLSNEDFFHK mapping to Sac1p and TGDLVTIHYTGTLENGQK mapping to Fpr1p, the know target of rapamycin. c , The Fpr1p LiP peptide found altered in six conditions is mapped onto the 3D protein structure complexed with rapamycin obtained by homology modeling (PDB: 2DG3 ). Rapamycin bound to target protein is indicated in violet. Orange indicates the TGDLVTIHYTGTLENGQK LiP peptide.
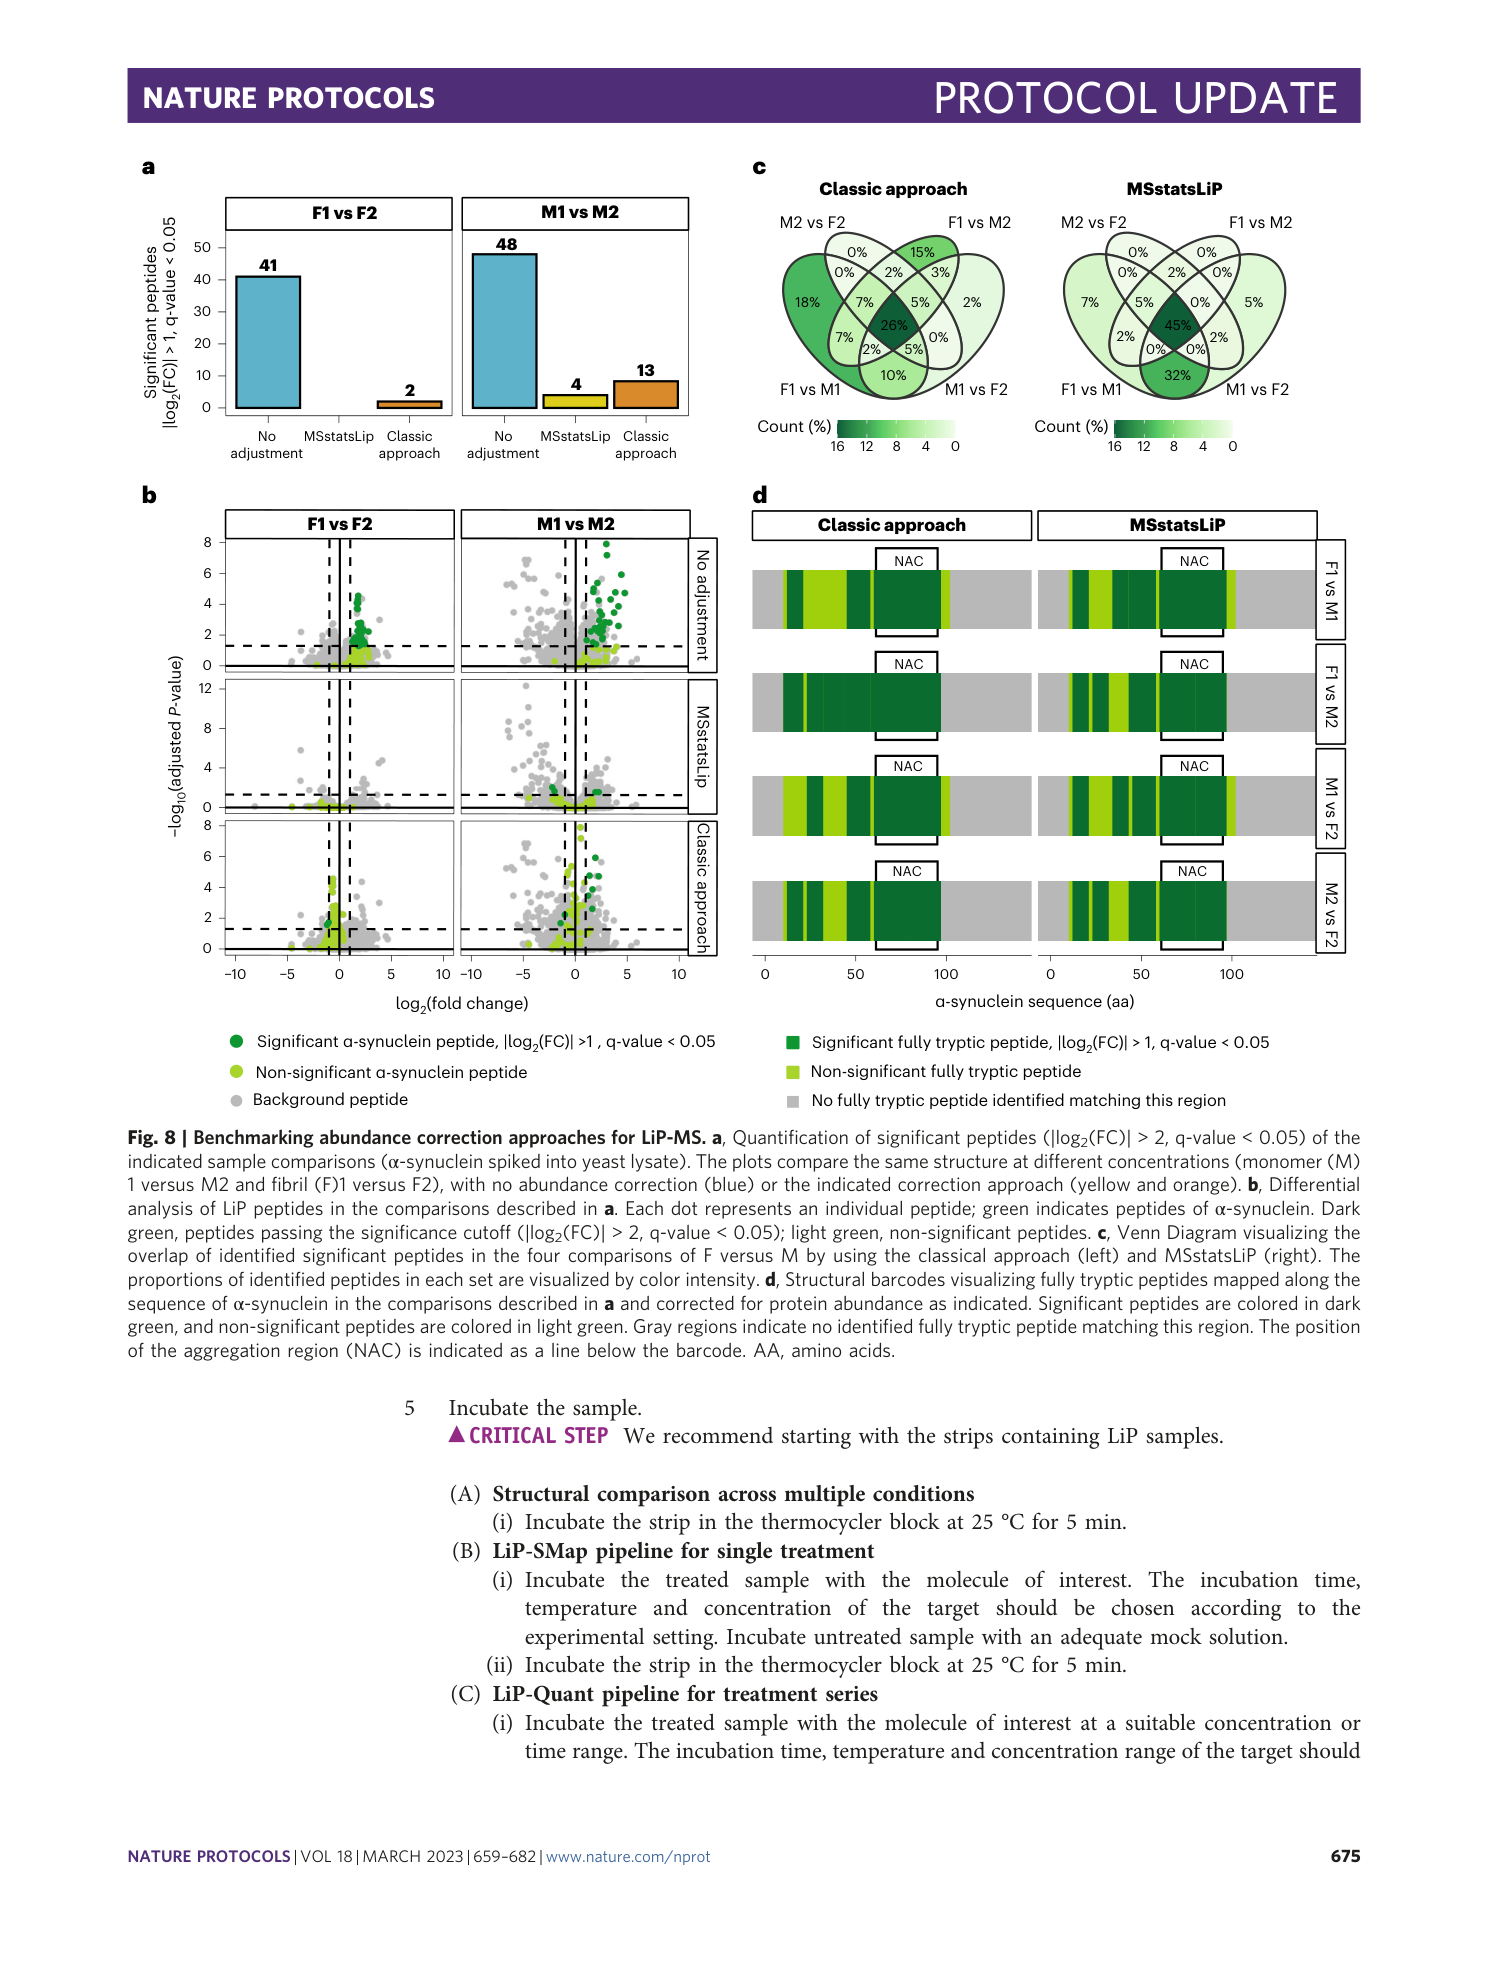
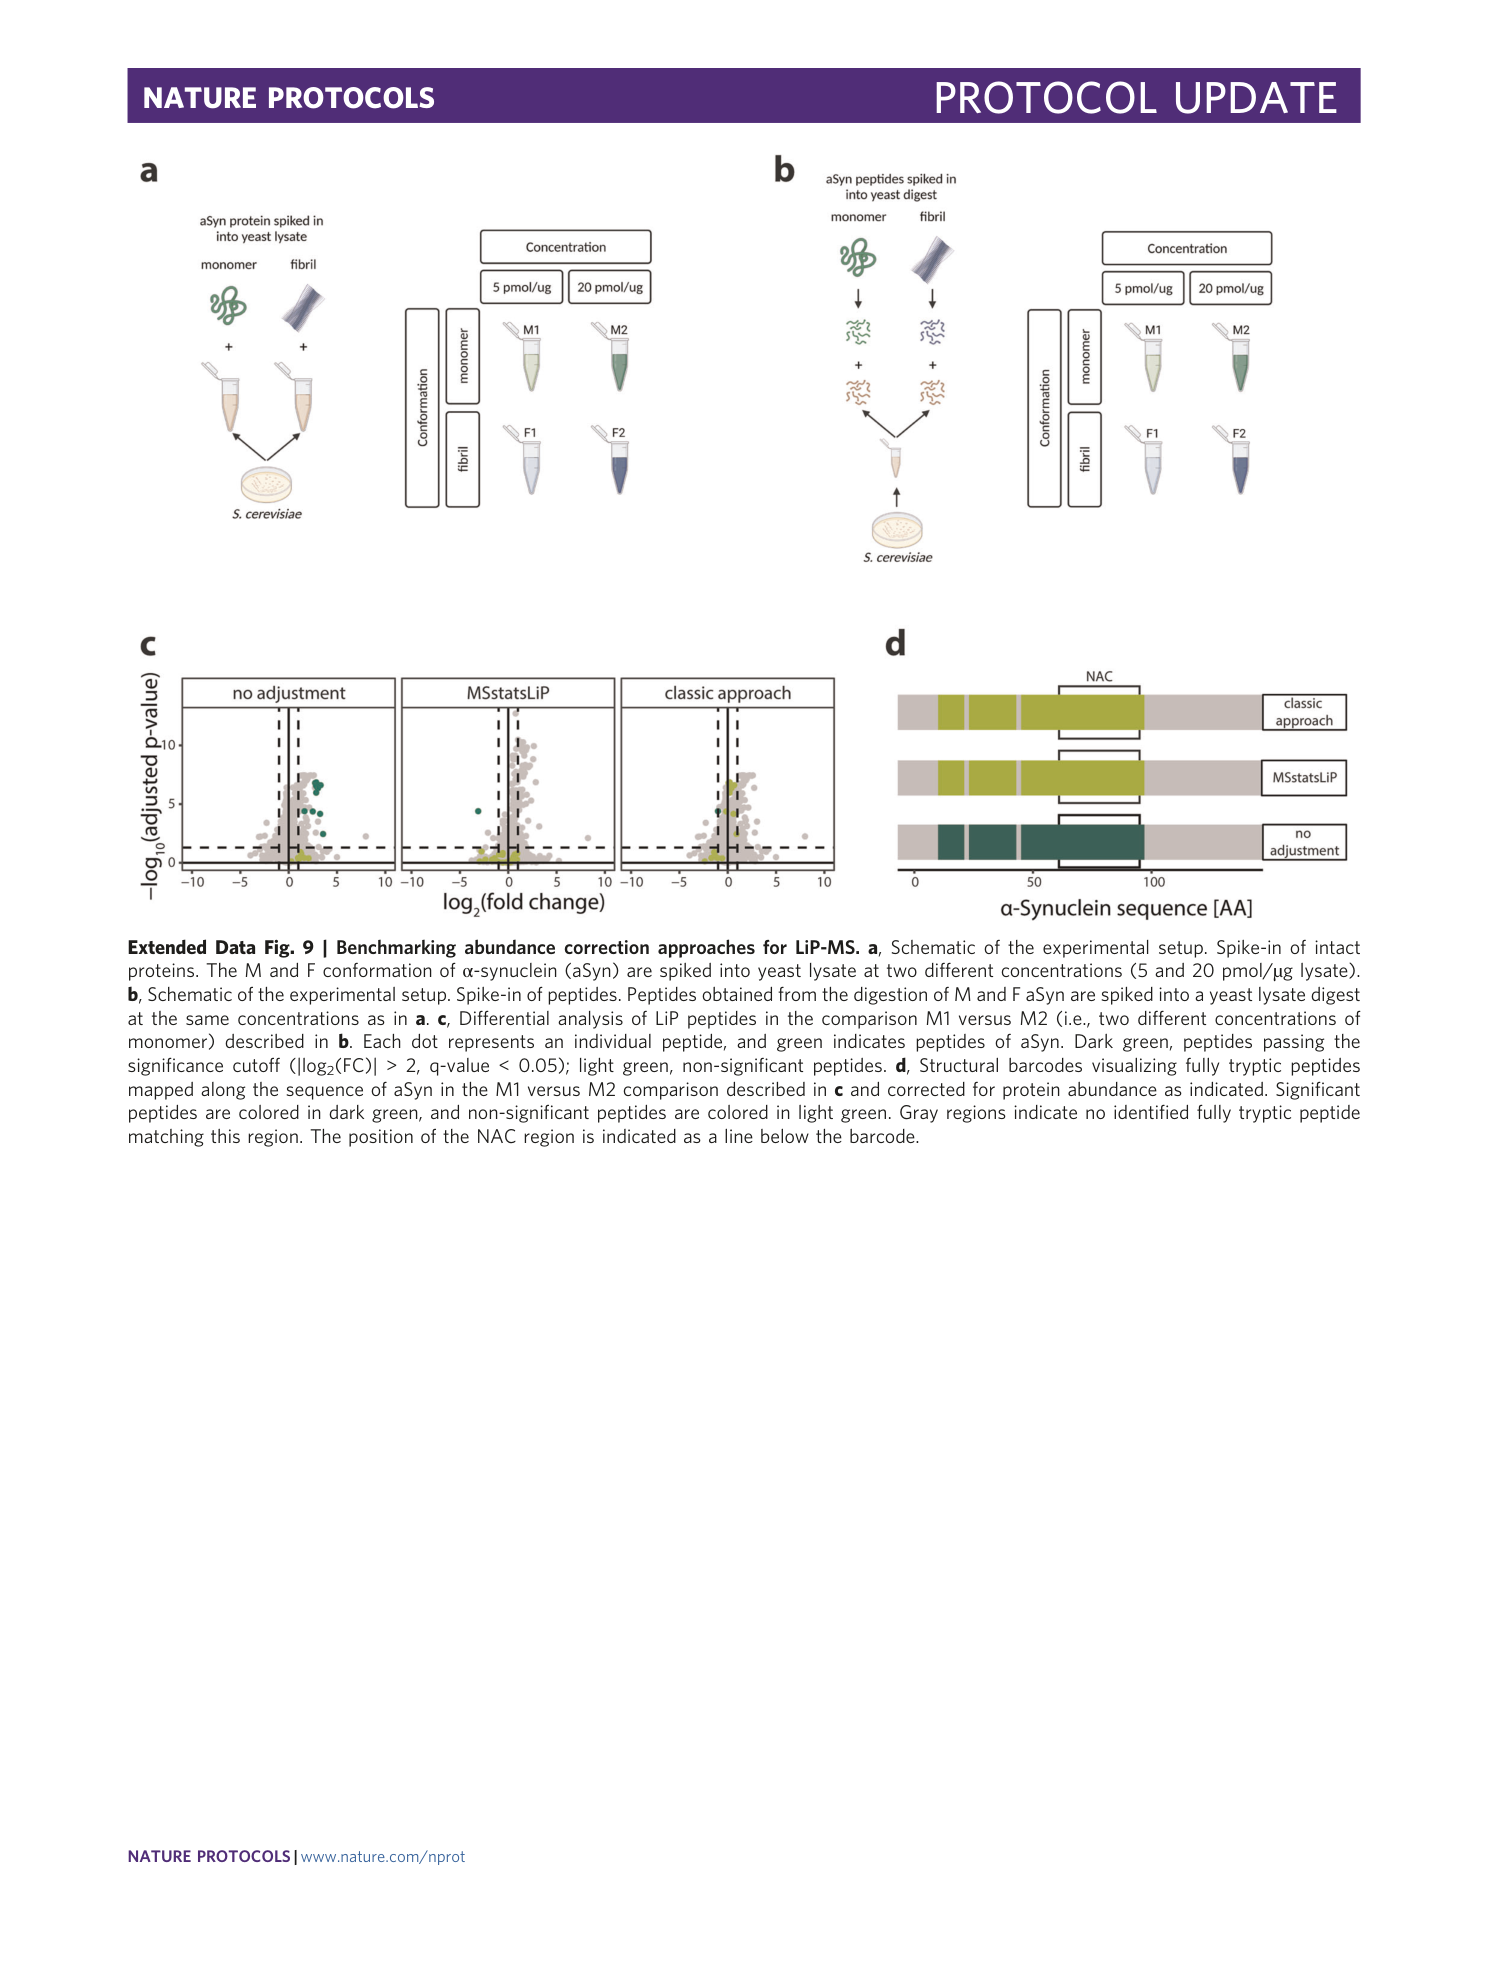
Extended Data Fig. 9 Benchmarking abundance correction approaches for LiP-MS.
a , Schematic of the experimental setup. Spike-in of intact proteins. The M and F conformation of α-synuclein (aSyn) are spiked into yeast lysate at two different concentrations (5 and 20 pmol/µg lysate). b , Schematic of the experimental setup. Spike-in of peptides. Peptides obtained from the digestion of M and F aSyn are spiked into a yeast lysate digest at the same concentrations as in a . c , Differential analysis of LiP peptides in the comparison M1 versus M2 (i.e., two different concentrations of monomer) described in b . Each dot represents an individual peptide, and green indicates peptides of aSyn. Dark green, peptides passing the significance cutoff (|log 2 (FC)| > 2, q-value < 0.05); light green, non-significant peptides. d , Structural barcodes visualizing fully tryptic peptides mapped along the sequence of aSyn in the M1 versus M2 comparison described in c and corrected for protein abundance as indicated. Significant peptides are colored in dark green, and non-significant peptides are colored in light green. Gray regions indicate no identified fully tryptic peptide matching this region. The position of the NAC region is indicated as a line below the barcode.
Supplementary information
Supplementary Information
Supplementary Discussion and Tables 1 and 2
Supplementary Data 1
FASTA file containing a list of known contaminants
