Novel Transmission Electron Microscopic Method to Quantify Protein Clustering on the Cell Surface
József Kormos, József Kormos, Lajos Daróczi, Lajos Daróczi, János Szöllősi, János Szöllősi, László Mátyus, László Mátyus, Attila Jenei, Attila Jenei
chemical thinning
clustering of proteins
critical-point drying
immunogold labeling
pair correlation and pair cross-correlation functions
transmission electron microscopy
Abstract
The cell surface distribution patterns (clustering) of membrane proteins have been widely investigated in cell biology. Here we describe a novel transmission electron microscopic (TEM) protocol designed to improve the quality of information obtained about the protein distribution patterns detected. This novel method makes it possible to study the clustering of all transmembrane proteins on one half of the cytoplasmic membrane of a whole cell. To achieve better imaging, we combine various methods, including critical-point drying, fixation of gold beads with a carbon layer, and a newly developed chemical thinning method. In addition, in our image-processing algorithm, we implemented pair correlation and pair cross-correlation functions, providing more details and better quantitative accuracy in characterizing the size and numbers of possible protein clusters. © 2024 The Authors. Current Protocols published by Wiley Periodicals LLC.
Basic Protocol 1 : Sample preparation and transmission electron micrography
Alternate Protocol : Direct cell labeling for transmission electron micrography
Basic Protocol 2 : Analysis of TEM images to detect immunogold-labeled proteins
INTRODUCTION
Studying receptor distribution patterns is important for investigating receptor systems and characterizing them as potential therapeutic targets. Cell surface distribution studies characterize the potential roles of candidate receptors in normal physiology or in disease and can indicate possible adverse effects of targeting those receptors. Drug-discovery investigations that reveal quantitative target engagement (e.g., percentage of receptor occupancy) help researchers formulate pharmacokinetic/pharmacodynamic (PK/PD) hypotheses for various compounds. In addition, receptor distribution and quantitative target engagement studies can validate truly translational technologies, such as positron emission tomography (PET) ligands and pharmaco-EEG paradigms connecting preclinical/clinical interfaces. The fluid mosaic membrane model explains various observations regarding the structure of functional cell membranes (Nicolson & Ferreira de Mattos, 2022; Vereb et al., 2003). According to this biological model, the cell membrane comprises a lipid bilayer (a two-molecule-thick layer consisting primarily of amphipathic phospholipids) in which protein molecules are embedded. The lipid bilayer provides the membrane with fluidity and elasticity. Studying lipid rafts present on cell surface proteins can provide detailed information on their functionality, e.g., T-cell signaling, treatment of viral infection, receptor-mediated channel activity, and therapeutic targets for cancer (Bobkov & Semenova, 2022; Carletti et al., 2017; Codini et al., 2021; Gold & Reth, 2019; Li et al., 2022; Magee et al., 2002; Nagy et al., 2001).
In recent decades, significant advances in nanotechnology have been achieved, enabling us to measure different nanoscale properties of membranes. New developments in various microscopic techniques have made it possible to study the fine structure of cells and the cell surface distribution patterns of membrane proteins using fluorescence microscopes and their ultra-high-resolution versions. When higher resolution is needed, especially to observe individual proteins, conventional light-microscopy methods are not applicable due to their resolution limit. In these cases, transmission electron microscopy (TEM; Petralia & Wang, 2021; Piludu et al., 2018) and other super-resolution techniques, such as high-resolution scanning electron microscopy (SEM; Goldberg, 2008; Ou et al., 2015), stochastic optical reconstruction microscopy (STORM; Fish, 2022; Scalisi et al., 2023), photoactivated localization microscopy (PALM; Butler et al., 2022), total internal reflection fluorescence microscopy (TIRF; Fish, 2022), stimulated emission depletion (STED; Sahl & Hell, 2019), and so on, can be used to obtain more detailed information.
Here, we describe a novel TEM analysis method, providing two basic protocols for studying the cell surface distribution of membrane proteins with increased sensitivity and statistical accuracy.
Basic Protocol 1 deals with sample preparation and TEM imaging. Cells are labeled in suspension and chemically fixed with glutaraldehyde, and then the cell suspension is placed on a gold support grid used as the TEM sample holder, which has previously been coated with a collodion film and treated with poly-L-lysine. The sample is then subjected to critical-point drying, which preserves the original spatial morphology. The sample is then coated with a thin (∼10-nm) carbon film using a vacuum evaporator; this physically anchors the gold beads in their original position in the protein matrix and provides mechanical stability. The collodion membrane is then dissolved with amyl acetate and washed several times. In the next step, chemical etching with 100 g/L sodium hydroxide solution is performed, followed by thorough washing. Finally, TEM images are taken from the prepared samples.
In the Alternate Protocol, we present an alternative direct immunogold labeling protocol using a conjugation kit. This involves less washing, which will reduce the chance of gold beads being washed off.
Basic Protocol 2 details the image analysis process. In this protocol, we identify gold beads on the digitized TEM images using the ClickOnGold program, and then analyze the data using the Gold software to determine the pair correlation function and pair cross-correlation function.
CAUTION : Hydrogen fluoride is a strong acid that is deadly if inhaled or ingested. Skin contacts cause severe burns and eye damage. Use this chemical under fume hood.
CAUTION : Chromosulfuric acid is a very toxic, strong oxidizing agent! Protective gloves, protective clothing, eye protection, and face protection are mandatory when using this.
CAUTION : Amyl acetate is organic solvent of collodion. When using collodion solution, or dissolving dried collodion with amyl acetate, the resulting vapor or aerosol should not be inhaled. Avoid contact with the material. Appropriate ventilation should be utilized. Keep the solvent away from heat and sources of ignition.
Basic Protocol 1: SAMPLE PREPARATION AND TRANSMISSION ELECTRON MICROGRAPHY (TEM)
In this section, we describe the step-by-step process of TEM sample preparation for analysis of the distribution pattern of proteins on the cell surface. We detail sample holder preparation, cell labeling with immunogold beads, critical-point drying, coating of the bead with a thin carbon film, and thinning of the sample in preparation for TEM.
Materials
-
47%-51% hydrofluoric acid (VWR, cat. no. BDH3040-500MLP; optional)
-
Chromosulfuric acid (VWR, cat. no. 18040502)
-
Double-distilled water (ddH2O)
-
2% collodion solution (Sigma Aldrich, cat. no. 09817-100 ML)
-
Poly-L-lysine, EM grade (VWR, cat. no. 103701-192)
-
JY cells (American Type Culture Collection, cat. no. 77441)
-
RPMI 1640 medium (Merck, cat. no. R8758)
-
10% fetal bovine serum (FBS; Merck, cat. no. F7524)
-
Glutamine (Sigma Aldrich, cat. no. 1294808)
-
Penicillin-streptomycin (Merck, cat. no. P4333)
-
10 µg/ml gentamycin (Merck, cat. no. G1272)
-
Phenol red indicator (Merck, cat. no. 114529)
-
Phosphate-buffered saline (Merc, cat. no. P5493)
-
50% glutaraldehyde (EMS, cat. no. 16520)
-
Antibody W6/32 (Abcam, cat. no. ab22432)
-
Antibody HLADQ (Abcam, cat. no. ab20173)
-
Anti-MHC class II antibody (Abcam, cat. no. ab157210)
-
Absolute ethanol (VWR, cat. no. 20816.298)
-
Immunogold reagents:
- InnovaCoat GOLD Anti-Mouse IgG-10 nm (Innova Biosciences, cat. no. 214-1000)
- InnovaCoat GOLD Anti-Mouse IgG-20 nm (Innova Biosciences, cat. no. 215-1000)
- InnovaCoat GOLD Anti-Rabbit IgG-10 nm (Innova Biosciences, cat. no. 218-1000)
- InnovaCoat GOLD Anti-Rabbit IgG-20 nm (Innova Biosciences, cat. no. 219-1000)
-
Carbon rods, length 12 inches (304 mm), diameters ⅛ inch (3 mm) and ¼ inch (6.2 mm) (EMS, cat. nos. 70210 and cat. no. 70212)
-
60% amyl acetate (EMS, cat. no. 10800)
-
Sodium hydroxide (VWR, cat. no. 05022312)
-
76 × 26-mm microscope slides (Thermo Scientific)
-
Engraving tools
-
Beaker (VWR 10754-700)
-
Ultrasonicator (Elmasonic S30H)
-
Hood or laminar-flow box
-
Tweezers (EMS, 72864-D)
-
Buchner funnel: Buchner Filter Funnel, Chemglass (VWR, cat. no. 80068-282)
-
TEM grid: 200- to 400-mesh square AU (EMR, lot no. 200305)
-
Lint-free filter paper (VWR, 400 mm × 570 mm, 516-0880)
-
15-ml centrifuge tubes (VWR, 21008-189)
-
Centrifuge (Rotina 46R)
-
Lint-free filter paper: 400 mm × 570 mm (VWR, cat. no. 516-0880)
-
Pipets
-
Pipet tips
-
8-well square plate (Thermo Scientific Nunc, lot no. 1217270, 267062)
-
Critical-point dryer (CPD; Bal-Tec CPD030)
-
Vacuum evaporator system
-
Needle
-
Fine-tip tweezers (EMS, 72864-D)
-
40-mm-diameter, 12-mm-high glass petri dish (Merc, BR455701)
-
Transmission microscope (JEOL 2000FX)
Preparation of sample carrier glass surface
1.Cut rectangle glass slides (∼25 mm × 10 mm) using microscope slides and mark the sample IDs onto the surface of the slides using an ethanol- and acetone-resistant technique. This can be achieved through scratching (with engraving tools) or etching (with hydrogen fluoride).
2.Degrease the slides for 30 min in an ultrasonic device with 15 ml chromosulfuric acid in 20-ml beaker, and then rinse three times with 15 ml filtered ddH2O in 20-ml beaker for 5 min. Air-dry the slides in a dust-free environment (hood or laminar-flow box).
Preparation of collodion membrane
3.Close the valve of the Büchner funnel, fill it with filtered ddH2O, and place the glass plates on a suitable stand at the center of the funnel using tweezers. The glass plate must be under the water. Place the gold TEM grids very carefully on the glass using fine-tip tweezers (see details in the Supplemental Information).
4.Place a drop of 2% collodion solution of ∼15 µl in the center of the water surface using a pipet. Wait ∼20 min for the solvent to evaporate completely, preferably under a fume hood.
5.When the solvent has completely disappeared, carefully open the valve of the funnel and release the water under the carrier glass. Then remove the carrier glass plate from the funnel and place it on dust- and lint-free filter paper until it dries.
6.When the plate is completely dry, drop ∼10 µl of EM-grade poly-L-lysine solution onto the surface of the collodion-coated grid.
Cell culture
7.Culture JY cells according to their specifications in RPMI-1640-based medium (see Reagents and Solutions) supplemented with phenol red indicator in a humidified, 5% CO2 incubator at 37°C. Passage cells every second day. Test cells regularly for mycoplasma. Harvest 1 × 10⁶ cells freshly and wash them twice, each time by resuspending the cells in 4 ml ice-cold PBS (pH 7.4) in a 15-ml centrifuge tube and centrifuging for 10 min at 200 × g , 4°C, in preparation for immunogold labeling.
Indirect immunogold labeling
8.Resuspend cells by pipetting up and down in a 15-ml centrifuge tube in 4 ml PBS and centrifuge for 10 min at 200 × g , 4°C.
9.Pour off or aspirate supernatant from the tubes, and gently soak up the residual liquid from the mouth of the tube with a paper towel, if needed.
10.Resuspend the cell pellet in 50 µl PBS by pipetting up and down and add 50 µl primary antibodies (W6/32 and anti-HLADQ; to a final primary antibody concentration of 10 µg/ml).
11.Incubate the cells for 40 min at 4°C.
12.Wash the samples with 4 ml PBS in a centrifuge tube for 10 min at 200 × g , 4°C.
13.Remove the supernatant from the tubes by aspiration, and gently soak up the residual liquid from the mouth of the tube with a paper towel.
14.Resuspend the cell pellet in 50 µl PBS by pipetting up and down and add 50 µl secondary antibodies (Anti-Mouse IgG-10 nm and Anti-Rabbit IgG-20 nm or Anti-Mouse IgG-20 nm and Anti-Rabit IgG-10 nm; to a final secondary antibody concentration of 10 µg/ml).
15.Incubate the cells for 40 min at 4°C.
16.Wash with 4 ml PBS in a centrifuge tube for 10 min at 200 × g , 4°C.
17.Remove the supernatant from the tubes by aspiration, and gently soak up the residual liquid from the mouth of the tube with a paper towel.
Critical-point drying
18.The labeled cells should be in suspension at ∼106 cell/ml concentration. Place ∼15 µl of this cell suspension on the TEM grid, working carefully to avoid damaging the collodion membrane.
19.Place the sample holder glass with the cells in an 8-well square plate for fluid exchange.
20.Remove the residual suspension and successively add 5 ml of increasingly concentrated solutions of aqueous ethanol (10%, 30%, 50%, 50%, 70%, and 100%). After adding each solution, incubate for 10 min and then aspirate residual solution before adding the next one. With the final ethanol concentration (100%), repeat this process twice.
21.Place the samples in the pressure chamber of the CPD instrument and cover the samples with replacement fluid (100% ethanol) to prevent air leakage.
22.Cool the critical-point chamber to 10°C.
23.Inject liquid CO2 into the precooled pressure chamber and let stand for ∼20 min.
24.Release the replacement fluid from the pressure chamber and add fresh CO2. Repeat this cycle until the alcohol solution is completely replaced by CO2.
25.Next, replace the previous replacement fluid with liquid CO2 and start the heating process.
26.Carefully open the gas vent valve at a constant temperature (with continuous temperature control of the chamber) and then reduce the pressure very slowly to 1 atm. The most important requirement in this step is that the temperature never fall below 31°C (the critical point of CO2).
Coating of sample with carbon layer
27.Using a carbon vacuum evaporator equipped with a resistant, heated thermal carbon source and carbon rods, coat the sample from step 26 with a few thin carbon layers of ∼10-20 nm. The typical pressure and heating current used are ∼5-10 mbar and 50-100 amp, respectively. The source-sample distance should be ∼30 cm to keep the sample from overheating.
Removal of grids from the glass plate
28.Scratch around the perimeter of the grids with a sharp needle, and then use tweezers to remove the grids from the glass plate.
Dissolution of collodion film under the cells
29.Carefully place the grids on the amyl-acetate-impregnated filter paper placed in the petri dish with tweezers and let stand for 30 min.
30.Prepare other petri dishes with clear filter paper. Transfer the grids to these prepared petri dishes, soak up the remaining liquid with lint-free filter paper, and air dry on dry lint-free paper.
Sample thinning
31.Place lint-free filter paper in the bottom of the petri dish and soak with 5 ml of freshly prepared 100 g/L sodium hydroxide solution.
32.Carefully place the grids on the previously prepared petri dish. Incubate overnight.
33.Rinse the samples thoroughly with ddH2O. Place the filter paper impregnated with ddH2O in a petri dish and place the samples on the top of filter paper. After 5 min, remove the sample with fine-tip tweezers and soak up the unnecessary water with dry filter paper. Then, return the paper to the petri dish. Repeat this step 10 times.
34.Transfer the samples to a clean filter paper with fine-tip tweezers and allow it to completely air dry, which will take ∼1 hr. The sample will then be ready for TEM imaging.
TEM analysis
35.Take TEM images with transmission electron microscope.
Alternate Protocol: DIRECT CELL LABELING FOR TRANSMISSION ELECTRON MICROGRAPHY
As an alternative to the indirect labeling method presented in Basic Protocol 1, cells can be directly immunogold labeled using a conjugation kit. This reduces the number of steps in the labeling process, which minimizes the loss of gold beads.
Additional Materials (also see Basic Protocol 1)
- Immunogold conjugation kit: Gold Conjugation Kit 10 nm, 20 OD (Abcam, cat. no. ab201808) or Gold Conjugation Kit 20 nm, 20 OD (Abcam, cat. no. ab201808)
Direct immunogold labeling
1.Wash cells with 4 ml PBS in a 15-ml centrifuge tube and centrifuge tube for 10 min at 200 × g , 4°C.
2.Remove the supernatant from the tubes by aspiration, and gently soak up the residual liquid with a paper towel from the mouth of the tube.
3.Prepare gold-conjugated antibody following the manufacturer's protocol (Abcam).
4.Resuspend the cell pellet in 50 µl PBS by pipetting up and down and add 50 µl gold-conjugated primary antibodies (to a final primary antibody concentration of 10 µg/ml).
5.Incubate the cells for 40 min at 4°C
6.Wash with 4 ml PBS in a centrifuge tube for 10 min at 200 × g , 4°C.
7.Remove the supernatant from the tubes by aspiration, and gently soak up the residual liquid with a paper towel from the mouth of the bottle.
8.Proceed to Basic Protocol 1 and perform steps 18-35.
Basic Protocol 2: ANALYSIS OF TEM IMAGES TO DETECT IMMUNOGOLD-LABELED PROTEINS
Here we analyze the digitized TEM micrographs to identify the gold beads using a proprietary program we designed (ClickOnGold). Then we apply the pair correlation function (PCF) or pair cross-correlation function (PCCF) using the Gold software.
Materials
- Image-processing software (recommended: Adobe Photoshop, Adobe)
- ClickOnGold software (available for free download; see Internet Resources)
- Gold software (available for free download; see Internet Resources)
- TEM images files
- Recommended system requirements:
- Multicore Intel® or AMD processor (2 GHz or faster processor with SSE 4.2 or later) with 64-bit support
- Windows 10, 64 bit (version 21H2 or later; LTSC versions are not supported)
- 16 GB or more
- GPU with DirectX 12 support (feature level 12_0 or later)
- 4 GB of GPU memory for 4K-resolution displays and larger
- 1920 × 1080 or larger display at 100%
- 100 GB of available hard disk space
1.Use digitized image for analysis. If TEM images are registered on traditional photo plate, digitize these image plates.
2.Crop out the maximum possible area of rectangular shape from the region of interest (ROI) portion of the raw image using image-processing software.
3.Convert the pictures to monochrome bitmap (BMP) format with the image-processing software.
4.Find the nanoparticles (black spots in the images) with the computer program. We perform this analysis using a proprietary program (ClickOnGold) in which we can manually correct any hit errors and sort them into different groups depending on the size of the beads (see details in the Supplemental Information).
5.Save the coordinate position of the spot to digital format for further processing in a *.txt file.
6.Execute a Monte Carlo simulation to determine the pair correlation function (PCF) or pair cross correlation function (PCCF). We performed this analysis using the Gold software (see details in the Supplemental Information).
REAGENTS AND SOLUTIONS
Cell culture buffer
- 10% (v/v) fetal bovine serum (FBS; Merck, cat. no. F7524)
- 10 µg/ml (w/v) penicillin-streptomycin (Merck, cat. no. P4333) or 10 µg/ml (w/v) gentamycin (Merck, cat. no. 345815)
- 15 mg/ml (w/v) phenol red indicator (Merck, cat. no. 114529)
- Store at −20°C
COMMENTARY
Critical Parameters
During sample holder preparation (Basic Protocol 1), the slides must be free of grease and dust during the coating of the collodion membrane, and the ddH2O must be clear (filtered); otherwise, the membrane will not be homogeneous. To ensure that the water and funnel remain pure, ddH2O should only be used up to five times without being changed or cleaned; otherwise, the membrane will also not be homogeneous.
During critical-point drying (Basic Protocol 1, steps 18-26), due to the small volume of the sample, it can easily become dry, which must be avoided.
During the sample thinning (Basic Protocol 1, steps 31-35), the sodium hydroxide should be fresh during every experiment, as otherwise, the sodium hydroxide precipitates and its concentration changes.
Troubleshooting
The main possible problems with these protocols are shown in Table 1, along with likely causes and solutions.
| Problem | Possible cause | Solution |
|---|---|---|
| The grid contains an insufficient number of cells | The concentration of the cell suspension was insufficient | Double the cell concentration: the acceptable range is 5 × 10⁵-2 × 10⁶ cells/ml; increase the incubation time. |
| The washing or liquid changing steps were performed too roughly | Perform the dehydration procedure with more care. | |
| The sample was too thick and not transparent to the electron beam | The etching of the inner part of the cell etching is not appropriate and the etching time was insufficient | Increase the etching time or increase the concentration of sodium hydroxide solution. |
| The quality of the carbon layer was poor | The quality of the vacuum was poor or the sample was contaminated | Use higher vacuum level and carbon rods of greater purity. |
| The collodion layer was ragged | ddH2O was contaminated | Filter the water to eliminate dust and other pollutants. |
| The thickness of the sample did not change after thinning | The collodion layer was not fully dissolved | Dissolve the collodion layer with amyl acetate for a longer time. |
Statistical Analysis
Image analysis
We detect the gold beads on TEM images using software called ClickOnGold that our team developed previously. This software can capture the center of the beads and save these in a *.txt file. We perform statistical analysis of data stored in the *.txt file with the help of software called Gold. The analysis produces a pair correlation function and pair cross-correlation function.
The use of the ClickOnGold and Gold programs is described in detail in the Supplemental Information. The ClickOnGold program is available free and downloadable—see the Internet Resources section below.
Understanding Results
Previously we applied TEM to describe the pattern of the cell surface protein. That method is illustrated in a flow chart provided in Figure 1.

That relatively simple procedure shown in Figure 1 has several shortcomings, however. The most critical issue is the size of the observable area, which we found was severely limited because only a thin ring at the edge of the cell was transparent to the electron beam due to the excessive thickness of the cell. Therefore, because of the low number of detected objects, the statistical description is very uncertain (see Fig. 2A-C).
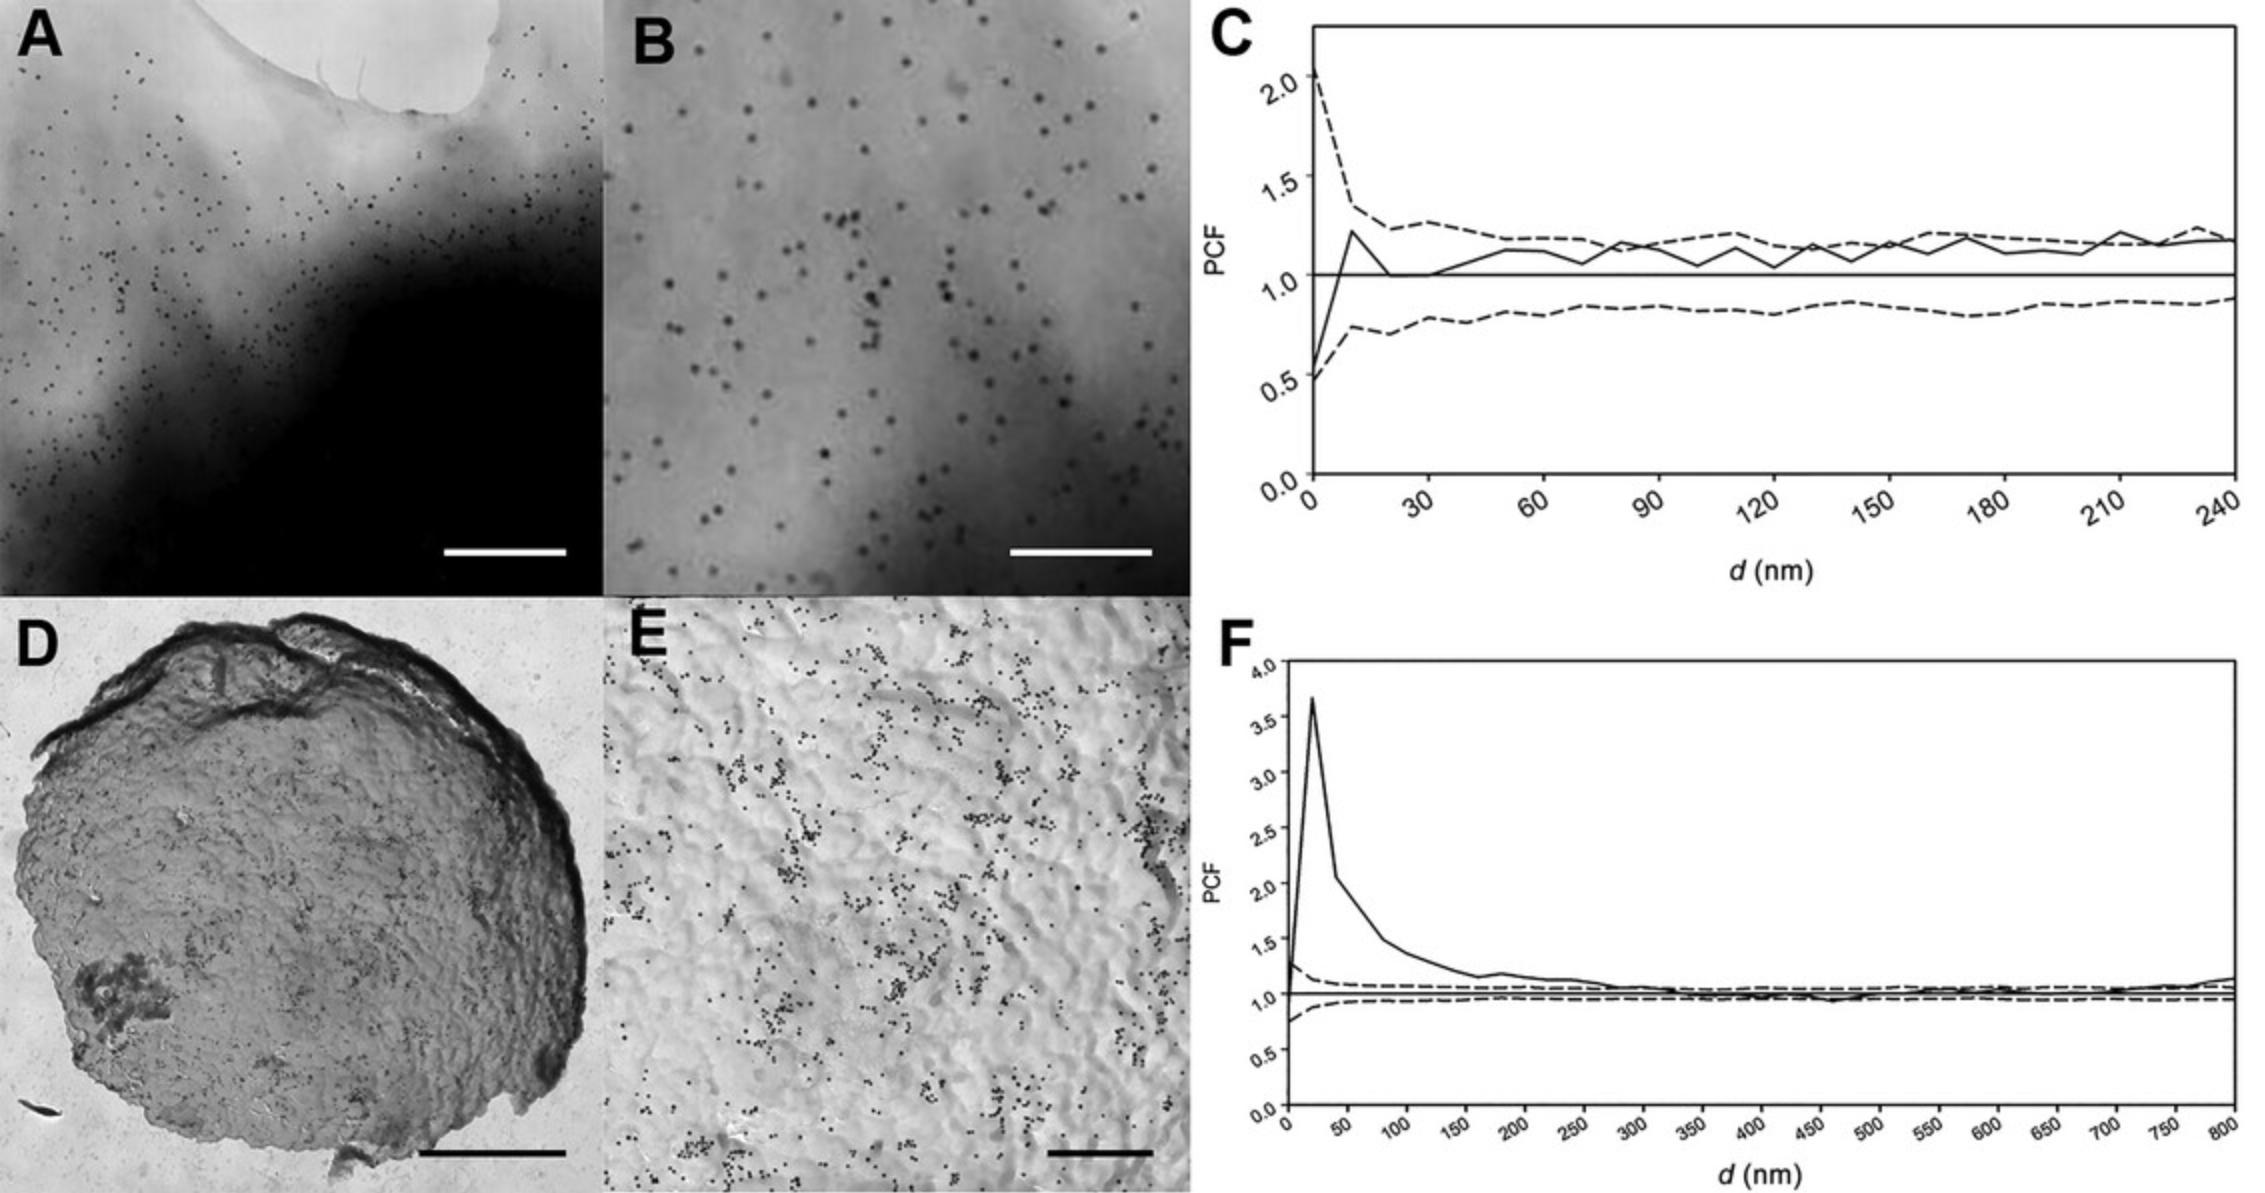
Figure 2 shows the differences between the results obtained by the traditional procedure and the new one we describe in the protocols above. Considered numerically, the dimensions of the picture prepared with the traditional technique are 883 nm × 896 nm (see Fig. 2B), whereas the dimensions of the picture prepared with the novel technique are 2883 nm × 2918 nm (see Fig. 2E). Therefore, the new protocol enables us to observe a much larger area of the region of interest (ROI). We characterized the distribution with pair-correlation function (see Statistical Analysis section). The statistical accuracy can be well characterized by the confidence intervals. The confidence interval is proportional to the reciprocal of the square root of the numbers of events: for example, in Figure 2C, the average confidence interval is ∼0.32, whereas in Figure 2F, it is ∼0.12 in the same “ d ” interval (from 0 to 450 nm). More than eight times more gold beads can be detected with the new protocol at the same density, so the statistical accuracy can be increased significantly. In addition, the observation area is increased, so the detection of any larger structures is ten times more probable with the new method than with the traditional approach.
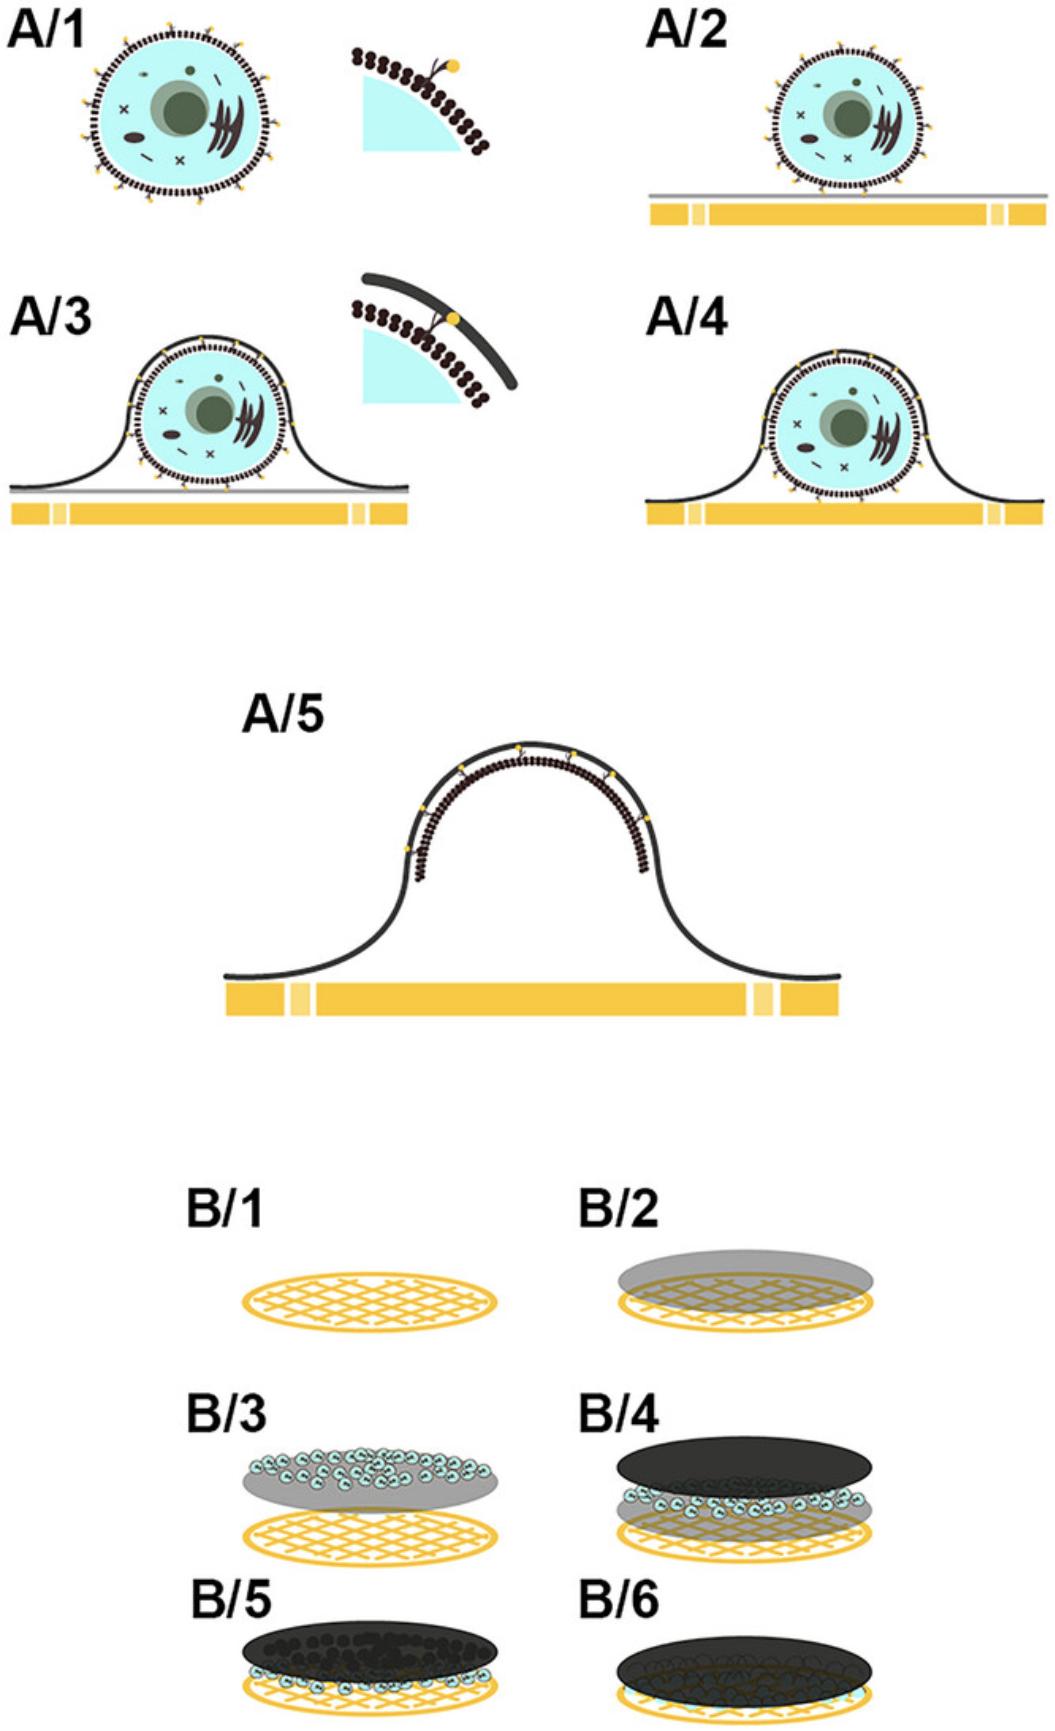
Coating the carbon layer by vacuum evaporation increases the resistance of the sample; thus, a higher accelerating voltage can be applied, which provides better contrast for the beads and allows for a higher sample thickness and resolution. A flow chart of the new procedure is shown in Figure 3.
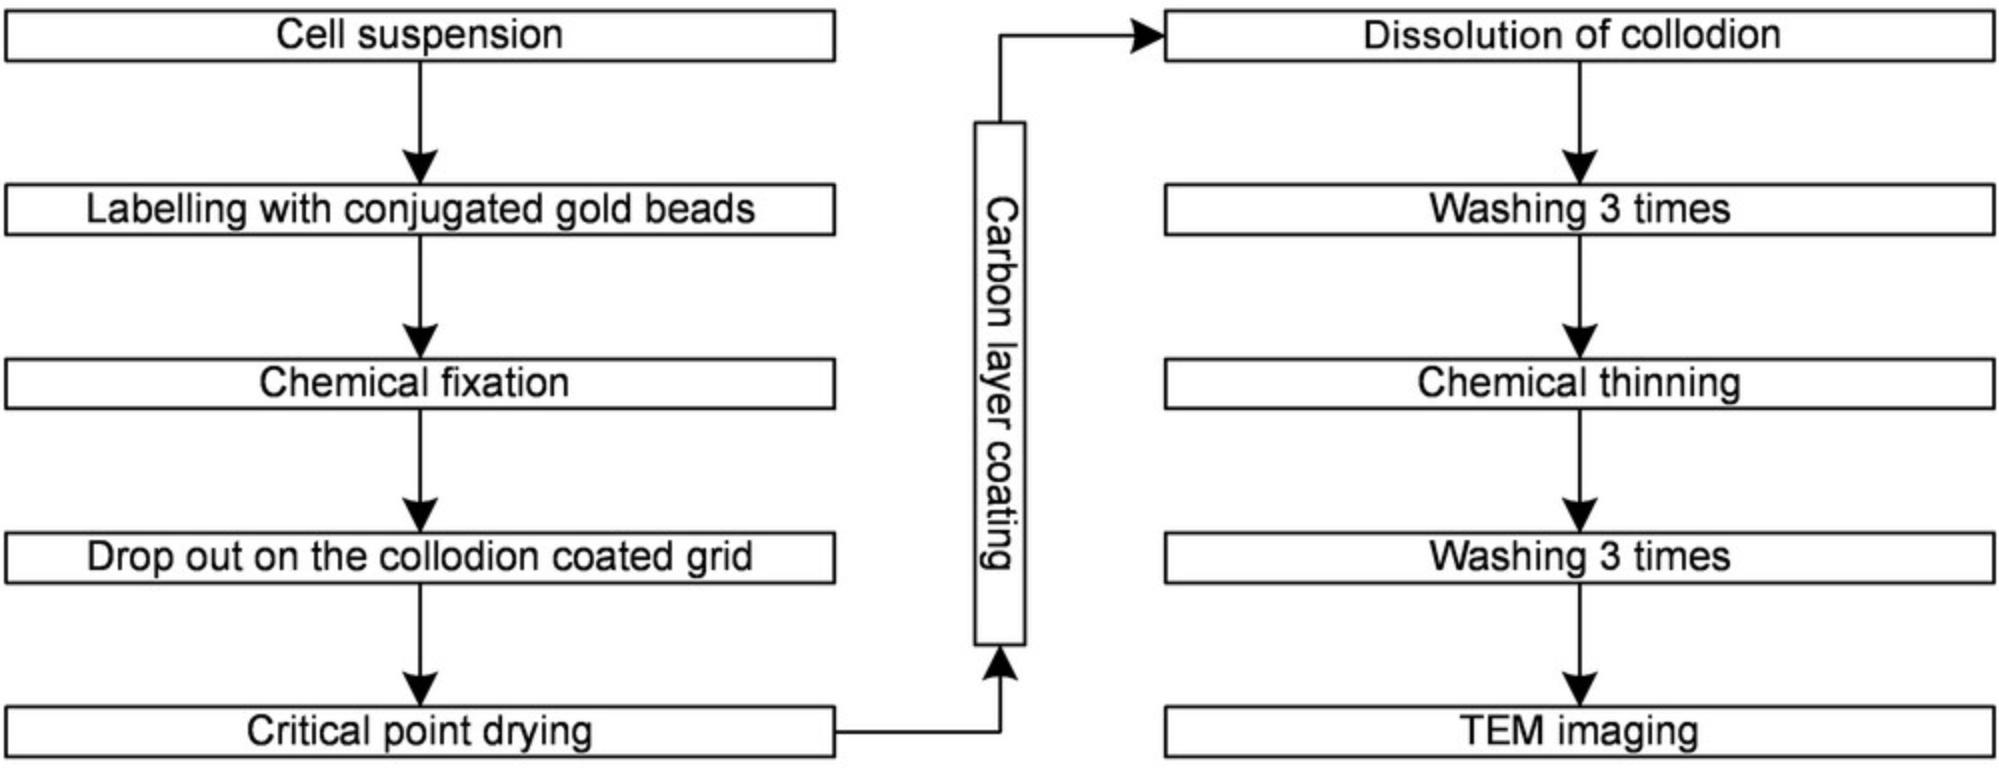
Figure 4 shows the effects of our new protocol for one cell (microscopic; Fig. 4, A/1-A/5) and for one grid (macroscopic; Fig. 4, B/1-B/6).
Having improved our previous traditional sample preparation protocol, we aimed to describe the distribution pattern of membrane proteins more accurately. There are basically three types of point patterns: complete spatial randomness (CSR), uniform or segregated, and clustered (Fig. 5). In the first case, no interaction occurs between points; in the second case, a repulsive interaction occurs; and in the third case, attractive interactions can be observed. There are different ways to evaluate the distribution of the point patterns: second-order analysis and the use of the pair correlation function PCF(r). PCR(r), also known as the radial distribution function g(r), is widely used in various fields, such as biology, geology, economics, and astronomy. This function can describe the type of distribution and can estimate the sizes and numbers of clusters (Ripley, 1981, 1988).
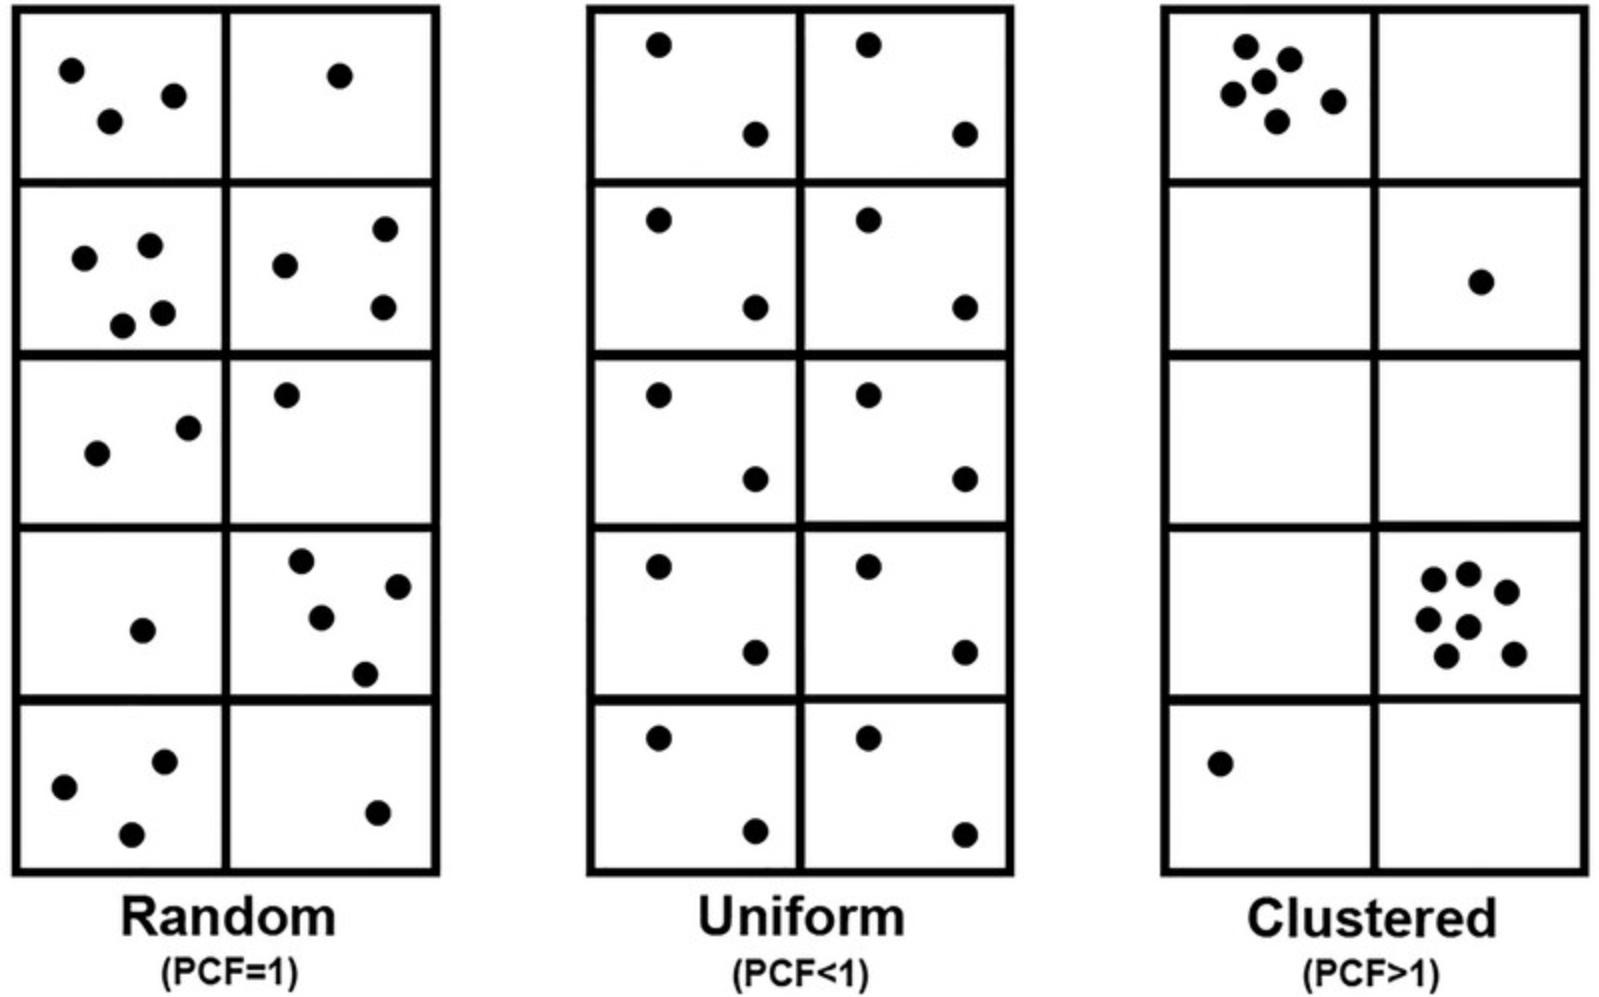
The values of PCF(r) in these three cases are as follows:
Random: PCF(r) = 1 Uniform or segregated: PCF(r) < 1: Clustered point pattern: PCF(r) > 1
To clarify the information, we generated an artificial image with a nonrandom clustered point pattern and its PCF (Fig. 6).
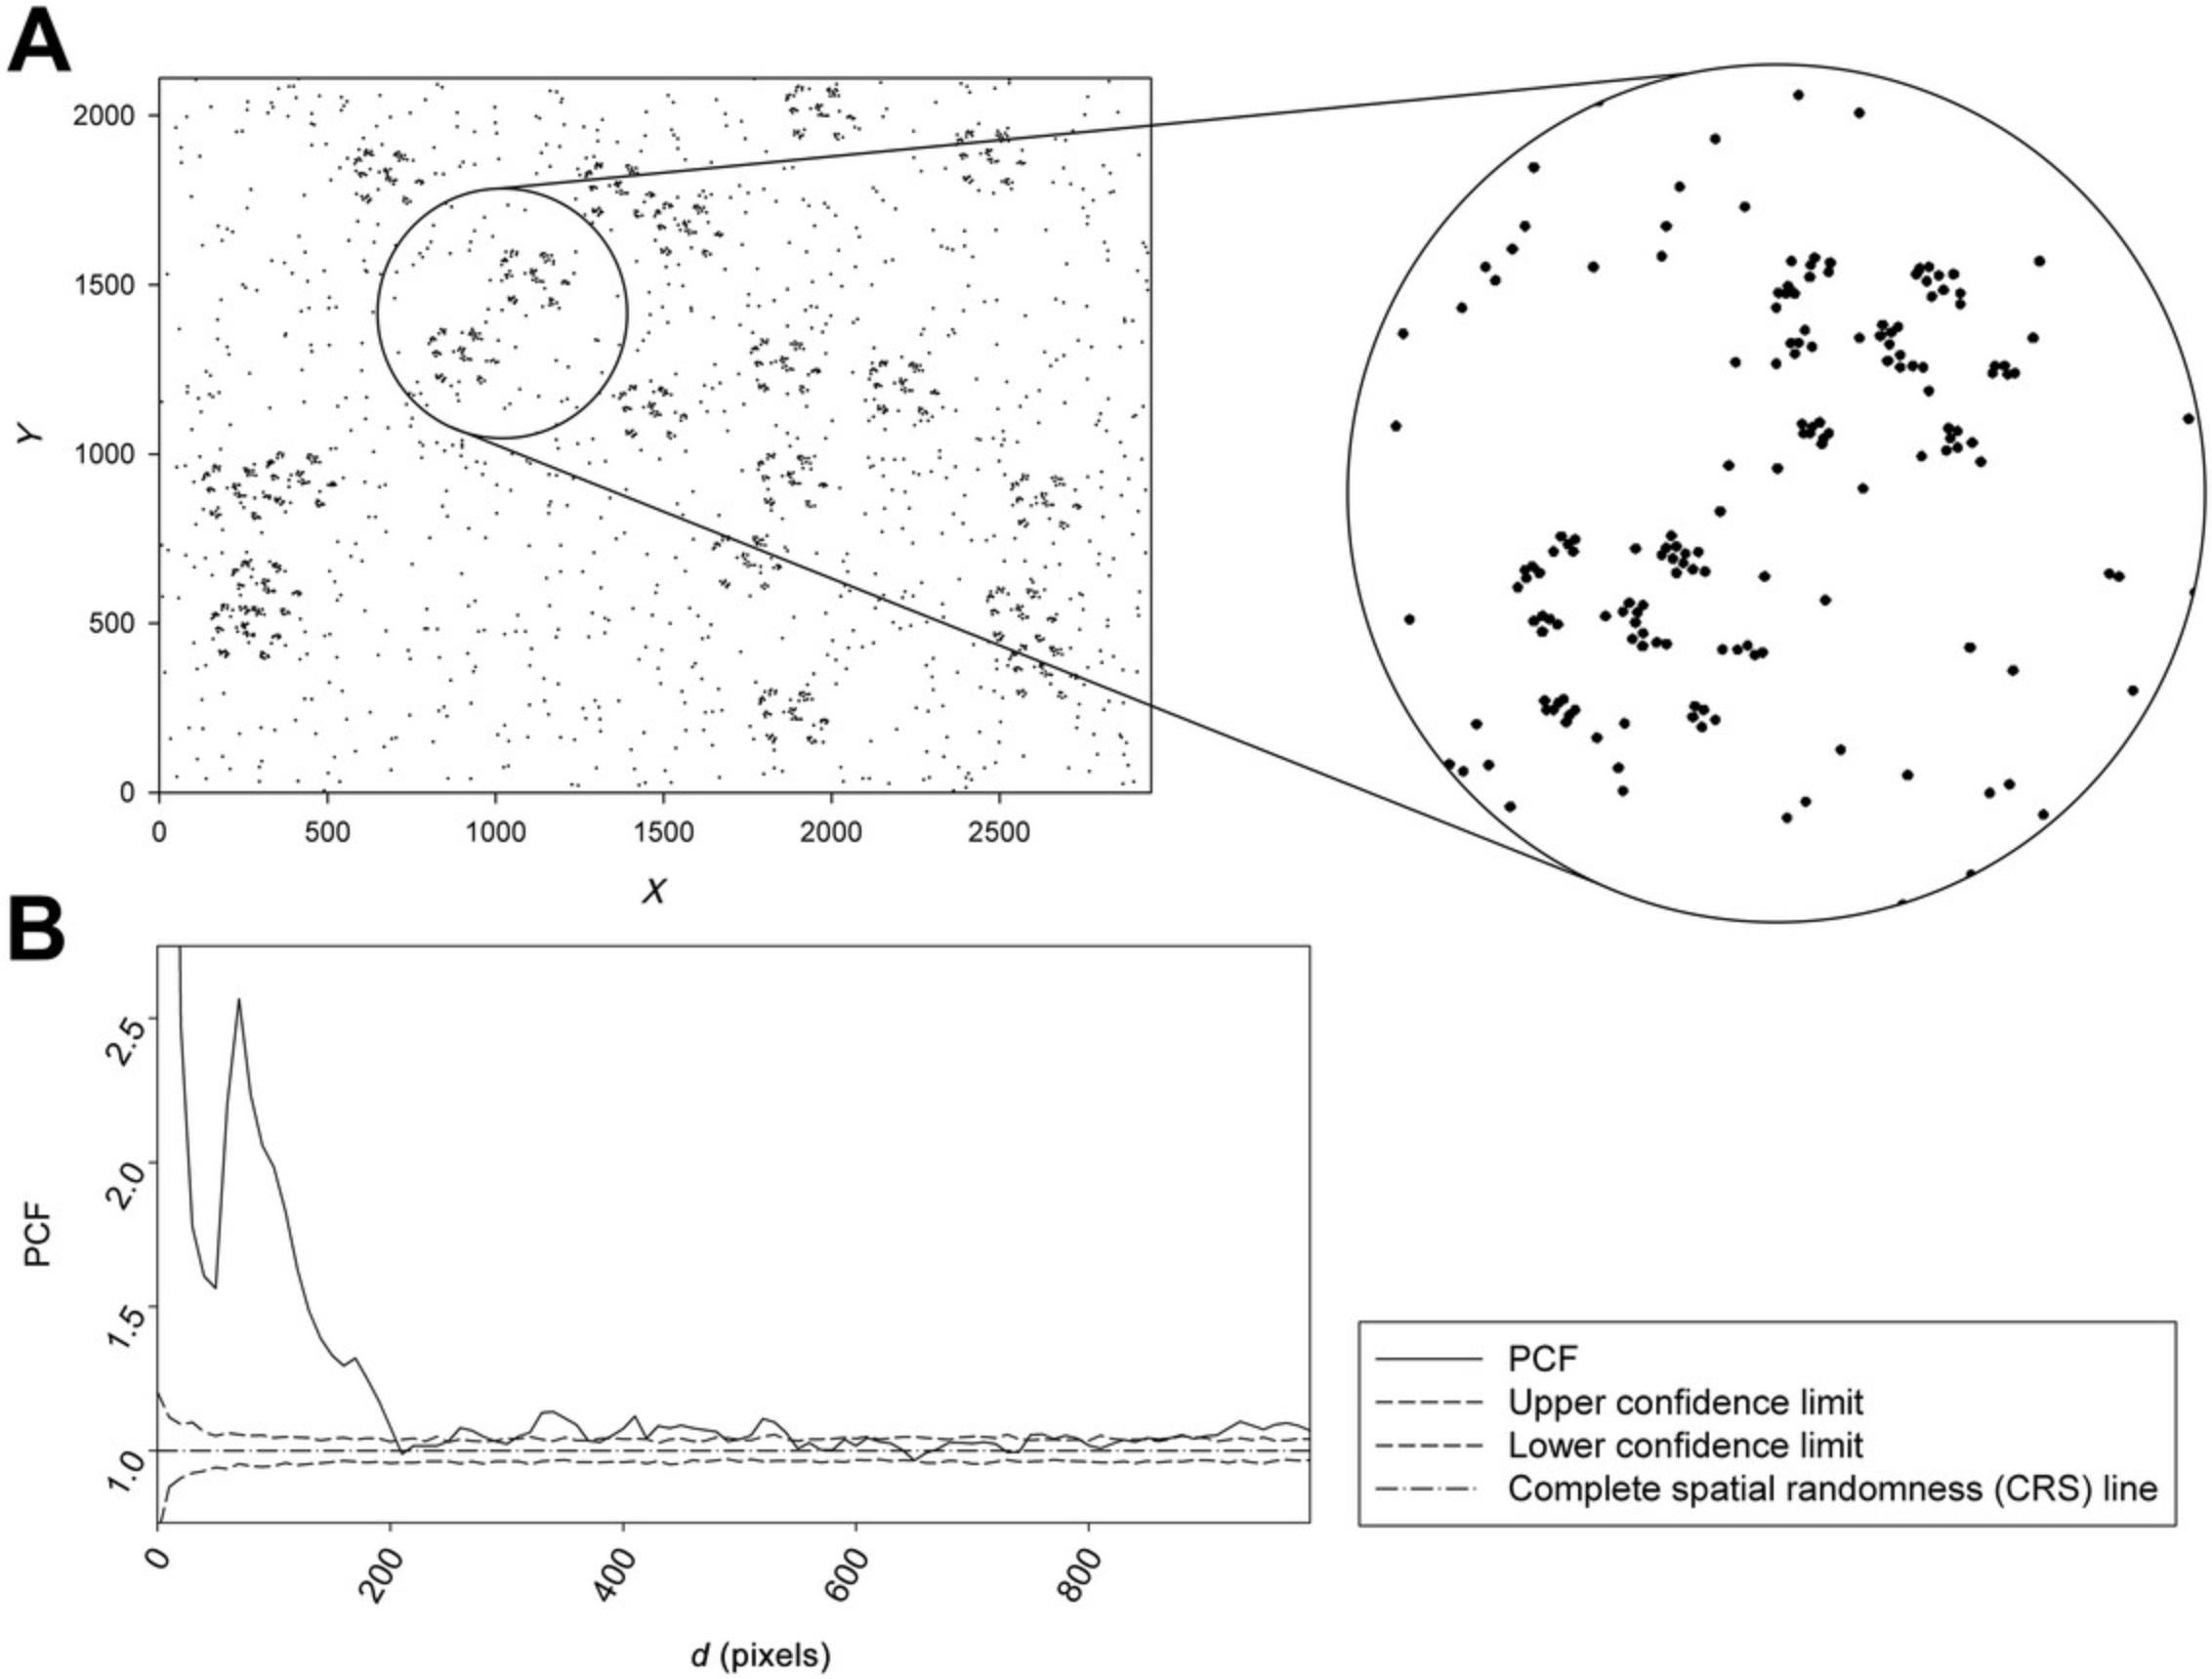
In Figure 6B, the solid line presents the PCF values of the observed point pattern panel (Fig. 6A). The two dashed lines are the upper (thick dashed line) and lower (thin dashed line) confidence intervals of the PCF, and the dotted dashed line is the baseline, the exact PCF value of the complete spatial randomness. When the PCF value crosses the confidence lines, the distribution of the point pattern is nonrandom. If the PCF value is higher than the upper confidence interval (upper thick dashed line), the distribution is clustered; if it is lower than the lower confidence interval (lower thin dashed line), the distribution is segregated or uniform. Basically, there are several different clusters with different sizes and quantities. There are few clusters with various sizes, such as d ~10, d ~100, d ~370, and d ~550 pixels. The value of PCF is proportional to the number of a given size cluster. The peaks have different heights, which indicate the number of clusters of various sizes. For example, as shown in Figure 6, the clusters with the smallest size have a relatively large PCF value and therefore occur in greater numbers as well, which is significantly higher than the PCF value of the larger clusters with smaller quantities. The PCF function is determined by Monte Carlo simulation using computer software (GOLD software) (Philimonenko et al., 2000).
One technique used to visualize cell membrane proteins and describe their distribution is immunogold labeling, which is among the most sensitive methods possible for performing these studies on a nanometer scale. In contrast with other methods, this method does not require special equipment (e.g., working at ultralow temperature) and can avoid the large area loss due to ultrathin slicing, in which the contiguous cell membrane is relatively small. Typical results from immunogold labeling are shown in Figure 7A, where TEM micrographs of double-immunogold-labeled proteins (MHCI and MHCII) on the cell membrane of a JY cell with 10 and 20 nm gold beads are presented. Figure 7B and C present the pair correlation functions (PCFs) of MHCI and MHCII, respectively, and Figure 7D shows the pair cross-correlation function (PCCF) or co-localization of MHCI and MCHII proteins.
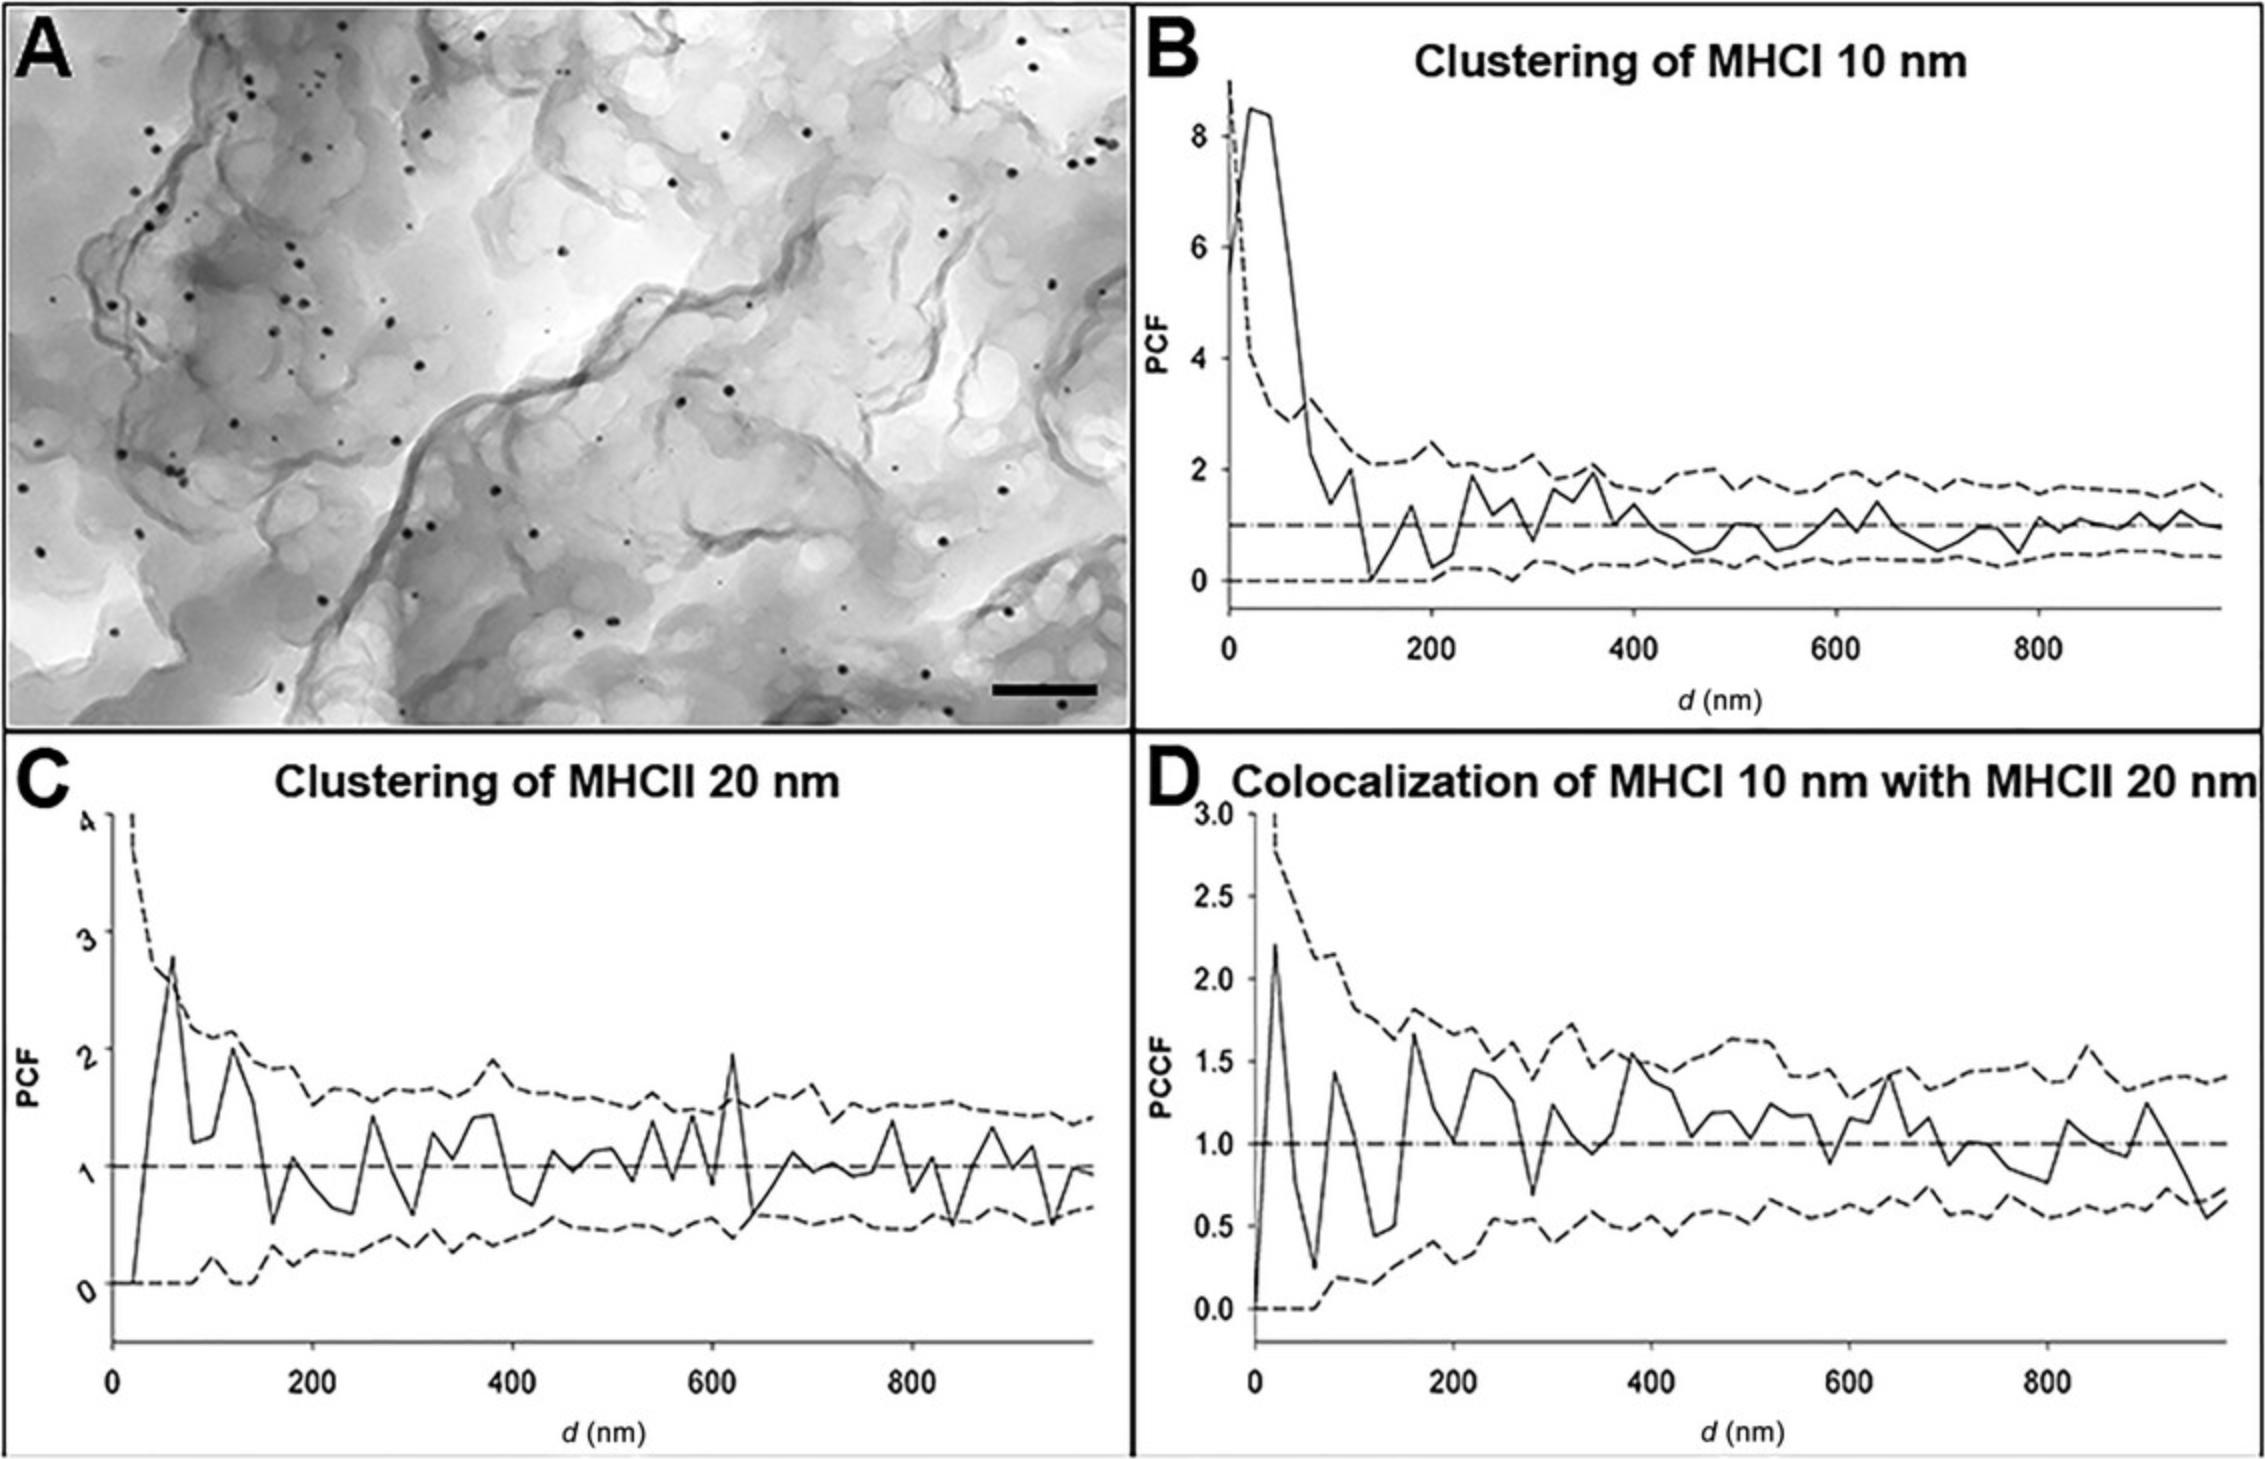
Combining this protocol with second-order evaluation functions, such as PCF and/or PCCF, generates a very powerful tool to accurately describe the distribution of cell surface proteins. Compared to the traditional protocol, this novel method covers a larger study area, allowing us to map the pattern of cell surface proteins and their interaction with each other from the nanometer to the micrometer range.
Limitations
With this novel protocol, only half of the cell surface can be examined due to the chemical thinning technique. Furthermore, the protocol can only describe the pattern of cell surface proteins and is therefore not suitable for analyzing association patterns to intracellular proteins. At a proximity of less than ∼10 nm, the results are strongly influenced by the physical size of the immunogold particles because of the so-called umbrella effect, which can be significant in this case. Because of their physical extent, the gold beads overshadow the area underneath, and therefore that area cannot be labeled, so no information can be collected from that region.
Our protocol has been successfully applied to the investigation of MHCII-deficient bare lymphocyte syndrome BLS1 cells. BLS1 cells not expressing MHCII molecules on the cell surface were transfected with appropriate genes, and the MHCII molecules were detected on the cell surface (Kormos et al., 2023). With our novel protocol, it was shown that both the MHCI and MHCII molecules formed clusters on the cell surface of the transfected cells, and the de novo -synthesized MHCII clusters did not intersperse with MHCI clusters within the timeframe of 2-3 weeks. In the case of the JY cell line, the MHCI and MHCII clusters are partially interspersed, as shown by double-immunogold labeling.
Time Considerations
The full procedure takes ∼4 days. The detailed timing for the protocols is shown in Table 2.
| Basic Protocol 1 | 20-24 hr |
| Basic Protocol 1 + Alternate Protocol (direct labeling) | 24-29 hr |
| Basic Protocol 2 | 7-8 hr |
Acknowledgments
Funding for open-access publication was provided by University of Debrecen. The work was financially supported by the Hungarian Research Network and supported by the University of Debrecen Program for Scientific Publication.
Author Contributions
József Kormos : Data curation; investigation; methodology; writing—original draft. Lajos Daróczi : Investigation; visualization. János Szöllősi : Supervision; writing—original draft; writing—review and editing. László Mátyus : Supervision; writing—review and editing. Attila Jenei : Project administration; supervision; writing—review and editing.
Conflict of Interest
The authors have no conflicts of interest.
Open Research
Data Availability Statement
Data available upon request from the authors.
Supporting Information
| Filename | Description |
|---|---|
| cpz11045-sup-0001-FigureS1-S3.docx1 MB | Supplementary methodology and Supplementary Figures 1–3. |
Please note: The publisher is not responsible for the content or functionality of any supporting information supplied by the authors. Any queries (other than missing content) should be directed to the corresponding author for the article.
Literature Cited
- Bobkov, D., & Semenova, S. (2022). Impact of lipid rafts on transient receptor potential channel activities. Journal of Cellular Physiology , 237(4), 2034–2044. https://doi.org/10.1002/jcp.30679
- Butler, C., Saraceno, G. E., Kechkar, A., Bénac, N., Studer, V., Dupuis, J. P., Groc, L., Galland, R., & Sibarita, J. B. (2022). Multi-dimensional spectral single molecule localization microscopy. Frontiers in Bioinformatics , 2, 813494. https://doi.org/10.3389/fbinf.2022.813494
- Carletti, R., Tacconi, S., Mugnaini, M., & Gerrard, P. (2017). Receptor distribution studies. Current Opinion in Pharmacology , 35, 94–100. https://doi.org/10.1016/j.coph.2017.07.008
- Codini, M., Garcia-Gil, M., & Albi, E. (2021). Cholesterol and sphingolipid enriched lipid rafts as therapeutic targets in cancer. International Journal of Molecular Sciences , 22(2), 726. https://doi.org/10.3390/ijms22020726
- Fish, K. N. (2022). Total internal reflection fluorescence (TIRF) microscopy. Current Protocols , 2(8), e517. https://doi.org/10.1002/cpz1.517
- Gold, M. R., & Reth, M. G. (2019). Antigen receptor function in the context of the nanoscale organization of the B cell membrane. Annual Review of Immunology , 37, 97–123. https://doi.org/10.1146/annurev-immunol-042718-041704
- Goldberg, M. W. (2008). Immunolabeling for scanning electron microscopy (SEM) and field emission SEM. Methods in Cell Biology , 88, 109–130.
- Kormos, J., Veres, A. J., Imre, L., Mátyus, L., Benkő, S., Szöllősi, J., & Jenei, A. (2023). HLA DQ protein changes the cell surface distribution pattern of HLA proteins as monitored by Förster resonance energy transfer and high-resolution electron microscopy. Cytometry Part A: The Journal of the International Society for Analytical Cytology , 103(12), 978–991. https://doi.org/10.1002/cyto.a.24787
- Li, Y. J., Chen, C. Y., Yang, J. H., & Chiu, Y. F. (2022). Modulating cholesterol-rich lipid rafts to disrupt influenza A virus infection. Frontiers in Immunology , 13, 982264. https://doi.org/10.3389/fimmu.2022.982264
- Magee, T., Pirinen, N., Adler, J., Pagakis, S. N., & Parmryd, I. (2002). Lipid rafts: Cell surface platforms for T cell signaling. Biological Research , 35(2), 127–131. https://doi.org/10.4067/s0716-97602002000200003
- Nagy, P., Mátyus, L., Jenei, A., Panyi, G., Varga, S., Matkó, J., Szöllosi, J., Gáspár, R., Jovin, T. M., & Damjanovich, S. (2001). Cell fusion experiments reveal distinctly different association characteristics of cell-surface receptors. Journal of Cell Science , 114(Pt 22), 4063–4071. https://doi.org/10.1242/jcs.114.22.4063
- Nicolson, G. L., & Ferreira de Mattos, G. (2022). Fifty years of the fluid-mosaic model of biomembrane structure and organization and its importance in biomedicine with particular emphasis on membrane lipid replacement. Biomedicines , 10(7), 1711. Retrieved from https://www.mdpi.com/2227-9059/10/7/1711
- Ou, H. D., Deerinck, T. J., Bushong, E., Ellisman, M. H., & O'Shea, C. C. (2015). Visualizing viral protein structures in cells using genetic probes for correlated light and electron microscopy. Methods , 90, 39–48. https://doi.org/10.1016/j.ymeth.2015.06.002
- Panyi, G., Bagdány, M., Bodnár, A., Vámosi, G., Szentesi, G., Jenei, A., …, Damjanovich, S. (2003). Colocalization and nonrandom distribution of Kv1.3 potassium channels and CD3 molecules in the plasma membrane of human T lymphocytes. Proceedings of the National Academy of Sciences of the U.S.A. , 100(5), 2592–2597. doi: 10.1073/pnas.0438057100
- Petralia, R. S., & Wang, Y. X. (2021). Review of post-embedding immunogold methods for the study of neuronal structures. Frontiers in Neuroanatomy , 15, 763427. https://doi.org/10.3389/fnana.2021.763427
- Philimonenko, A. A., Janácek, J., & Hozák, P. (2000). Statistical evaluation of colocalization patterns in immunogold labeling experiments. Journal of Structural Biology , 132(3), 201–210. https://doi.org/10.1006/jsbi.2000.4326
- Piludu, M., Medda, L., Monduzzi, M., & Salis, A. (2018). Gold nanoparticles: A powerful tool to visualize proteins on ordered mesoporous silica and for the realization of theranostic nanobioconjugates. International Journal of Molecular Sciences , 19(7), 1991. https://doi.org/10.3390/ijms19071991
- Ripley, B. D. (1981). Spatial statistics. Wiley.
- Ripley, B. D. (1988). Statistical inference for spatial processes. Cambridge University Press.
- Sahl, S. J., & Hell, S. W. (2019). High-resolution 3D light microscopy with STED and RESOLFT. In J. F. Bille (Ed.), High resolution imaging in microscopy and ophthalmology: New frontiers in biomedical optics (pp. 3–32). Springer.
- Scalisi, S., Pisignano, D., & Cella Zanacchi, F. (2023). Single-molecule localization microscopy goes quantitative. Microscopy Research and Technique , 86(4), 494–504. https://doi.org/10.1002/jemt.24281
- Vereb, G., Szöllosi, J., Matkó, J., Nagy, P., Farkas, T., Vigh, L., Mátyus, L., Waldmann, T. A., & Damjanovich, S. (2003). Dynamic, yet structured: The cell membrane three decades after the Singer-Nicolson model. Proceedings of the National Academy of Sciences of the United States of America , 100(14), 8053–8058. https://doi.org/10.1073/pnas.1332550100
Internet Resources
- https://static.yanyin.tech/literature/current_protocol/10.1002/cpz1.1045/attachments/clickongold.zip
Download website for the ClickOnGold software.
Download website for the Gold software.

