Multiplatform Plant Metabolomics Analysis Protocol for Arabidopsis thaliana
Akila Wijerathna Yapa, Gabriele Netzel, Venea Dara Daygon, Terra Stark
Abstract
In the pursuit of comprehensive metabolomic profiling, a multiplatform analysis protocol has been developed for Arabidopsis thaliana , utilizing an array of analytical techniques to quantify a diverse set of intracellular metabolites. This protocol encompasses methods for the extraction and purification of metabolites, followed by their analysis using high-performance liquid chromatography (HPLC) for amino acids, liquid chromatography-tandem mass spectrometry (LC-MS/MS) for central carbon metabolism, and gas chromatography-tandem mass spectrometry (GC-MS/MS) for open profiling of amino acids, organic acids, sugars, and fatty acids. Each method is meticulously designed to ensure precise quantification and identification of metabolites critical for understanding the metabolic networks in Arabidopsis thaliana . This protocol not only outlines the steps for metabolite extraction and analysis but also details the preparation of reagents and solutions, instrumental settings, and the analytical conditions required for optimal detection and quantification. The integration of these platforms provides a robust framework for metabolic studies, contributing significantly to the field of plant metabolomics by enabling detailed metabolic profiling with high accuracy and reproducibility.
Steps
1. Extraction and Purification of Intracellular Metabolites
Weigh approximately 25 mg of freeze-dried Arabidopsis thaliana tissues into bead beating tubes. Record the exact weights. Keep samples frozen. °C
Add approximately 200 μl of 0.5 mm silica glass beads to each sample. Prechill the bead beater (OMNI Bead Ruptor Elite NE486LUA) to -1°C with ethanol and dry ice.
Extract tissue samples in the bead beater using the following settings:
- Speed: 7.00 m/s
- Pulses: 3 x 45 sec
- Interval: 30 sec between pulses
Add 1 ml methanol to the ground samples. Vortex mix.
Add 0.4 ml chloroform to the samples. Vortex mix. Sonicate in an ice bath for 10 min. ALiquot 500 μl of samples for GC-MS open profiling (Step 23).
Add 500 μl MQ water with 500 nM AZT. Vortex mix.
Centrifuge at 16,000 RCF for 5 minutes at 4°C. Transfer approximately 1 ml of the aqueous layer to new 2 ml Eppendorf tubes, avoiding the interface layer containing proteins.
Evaporate methanol in the samples using a vacuum concentrator until about 400 μl of liquid (water fraction) remains. This step ensures low levels of methanol in preparation for freeze drying.
Freeze dry the samples overnight.
Reconstitute in 200 μl of 2% acetonitrile solution (5x concentrated).
Let stand for 10 minutes on ice. Centrifuge at 16,000 RCF at 4°Cfor 5 minutes, then transfer 200 μl into HPLC glass vial insert. Samples can be used directly for LCMS and HPLC analysis, or stored at -80°Cfreezer.

2. HPLC — Amino Acid Analysis
25 µL of crude solution of samples are added to 25 µL of 1 mM internal standards.
Instrumentation
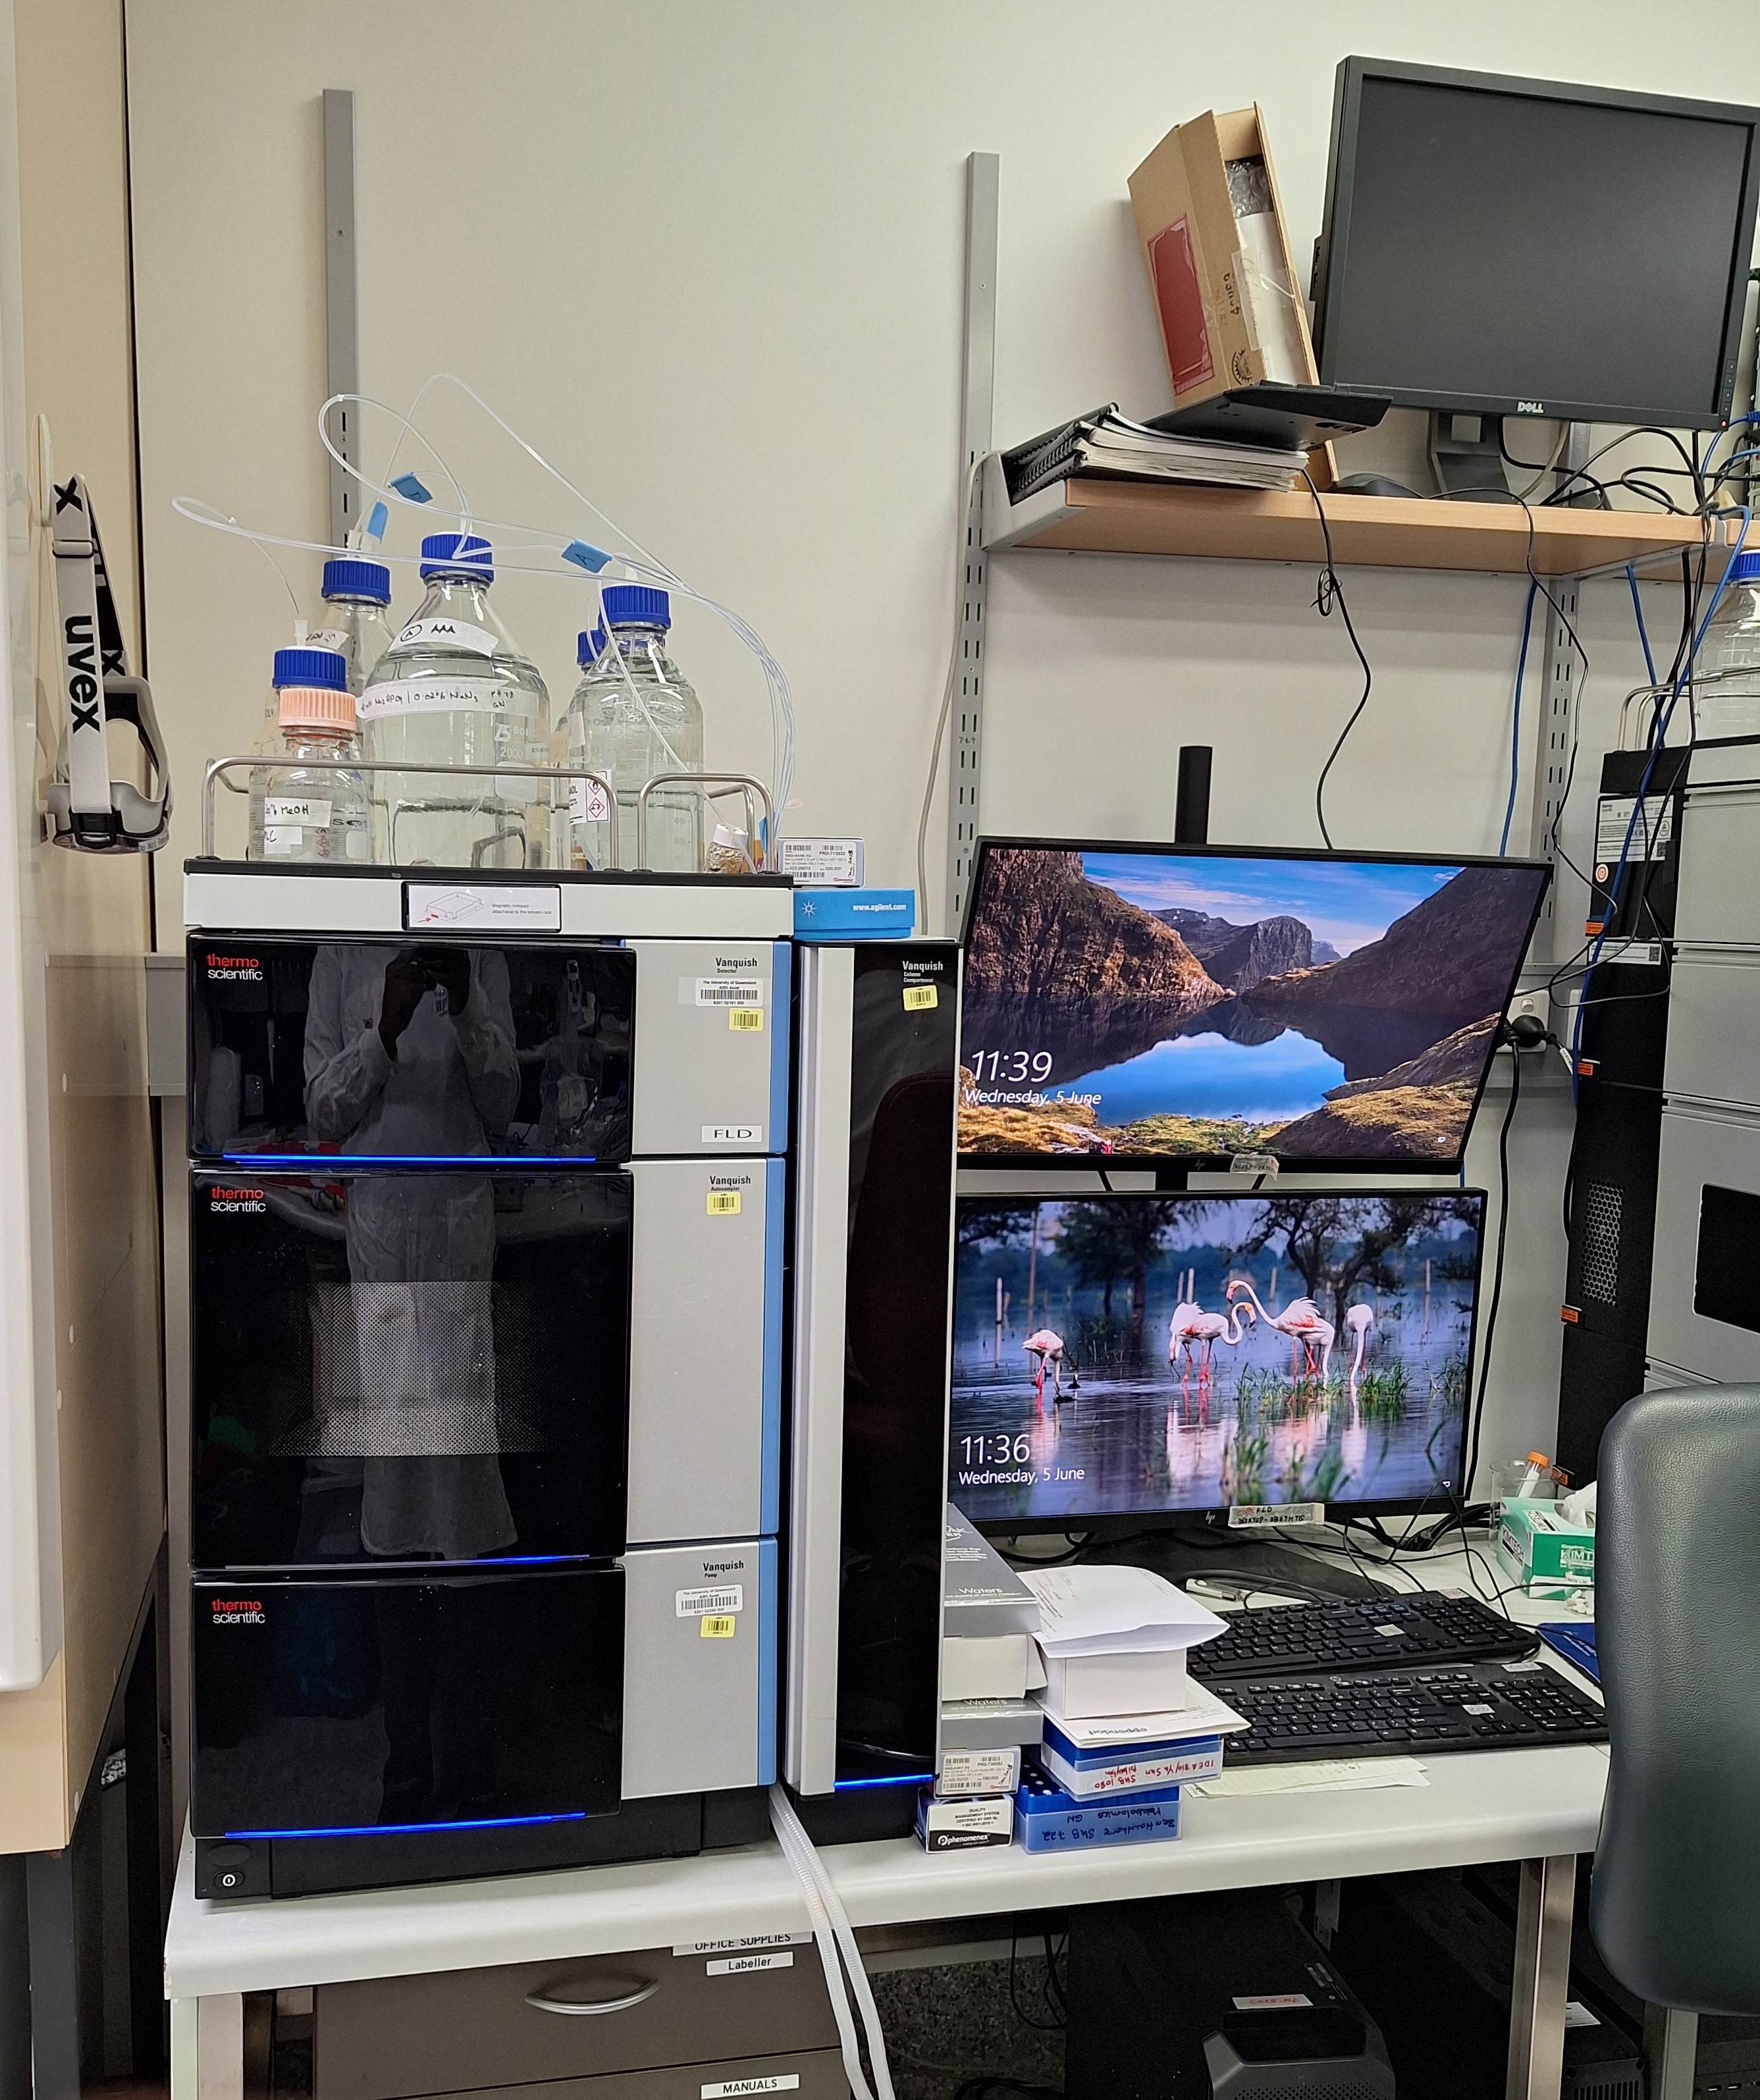
Instrument: : Thermo Scientific Vanquish Core UHPLC with FLD detector
Column: Agilent Zorbax Extend C-18 column 3.5 um, 4.6 x 150 mm (PN: 763953-902)
Guard Column: Phenomenex SecurityGuard Gemini C18 (PN: AJO-7597)
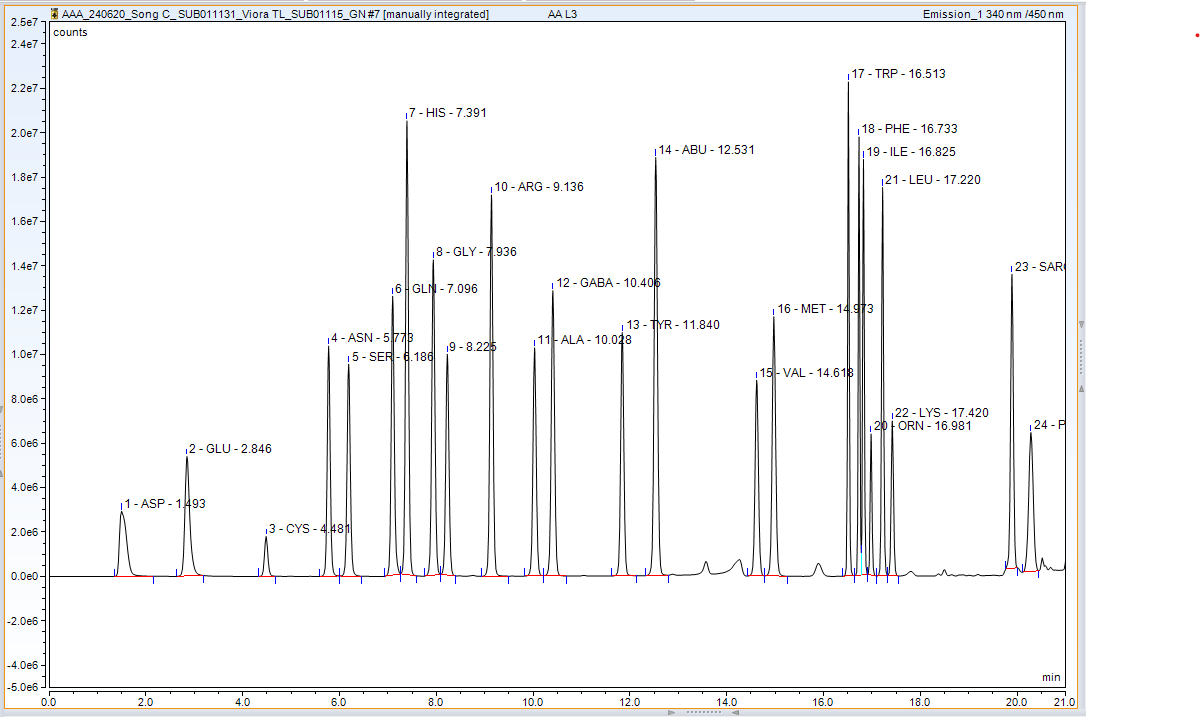
Detector FLD 1: OPA-derivatised amino acids detected at 340ex and 450emnm
Detector FLD 2: FMOC-derivatised amino acids detected at 260ex and 325emnm
Derivatisation
Aliquot FMOC reagent, OPA reagent, Borate buffer, Iodoacetic acid and Mobile phase A into HPLC vials. Take note of the position in the HPLC autosampler. Derivatisation is performed as previously published [Valgepea et al 2017]. The following steps are programmed in a high-performance autosampler.
1 µL of sample (which has been diluted 1:1 with internal standard), is added into 3 µL of 0.5% (v/v) 3-mercaptopropionic acid (Sigma M5801) in borate buffer (0.4 N, pH 10.2, Agilent PN: 5061-3339), mixed and incubated for 20 s at 4°C, to reduce free cystines.
To alkylate reduced cysteines, 1 µL of 120 mM iodoacetic acid (Sigma, I4386) in 140 mM NaOH is added, mixed and incubated for 20 s at 4°C.
1.5 µL of OPA reagent is then added to derivatise primary amino acids. The reaction was mixed and incubated for 20s at 4°C
FMOC reagent (1 µL) is added, mixed and incubated for 20 s at 4°C to derivatise the secondary amino acids.
The pH is then lowered by adding 50 µL of Mobile phase A (pH 7). The whole 57.5 µL are then injected to the UHPLC.
UHPLC parameters
The UHPLC gradient :
| A | B |
|---|---|
| Mobile phase B concentration (%) | Time (min) |
| 2 – 30% | 0 – 14 |
| 30 – 25% | 14.1 – 15 |
| 40 – 45% | 15.1 – 18 |
| 50 – 60% | 18.1 – 20 |
| 100% | 20.1 – 25 |
| 2% | 25.1 – 27 |
Column Temperature: 37 ºC
Flow rate: 1.8 mL/min
Derivatised amino acids are monitored using a fluorescence detector. OPA-derivatised amino acids were detected at 340ex and 450em nm from 1-18 min, and FMOC-derivatised amino acids at 260ex and 325emnm from 18-21 min.
3. LC-MS/MS — Central Carbon Metabolism (CCM)
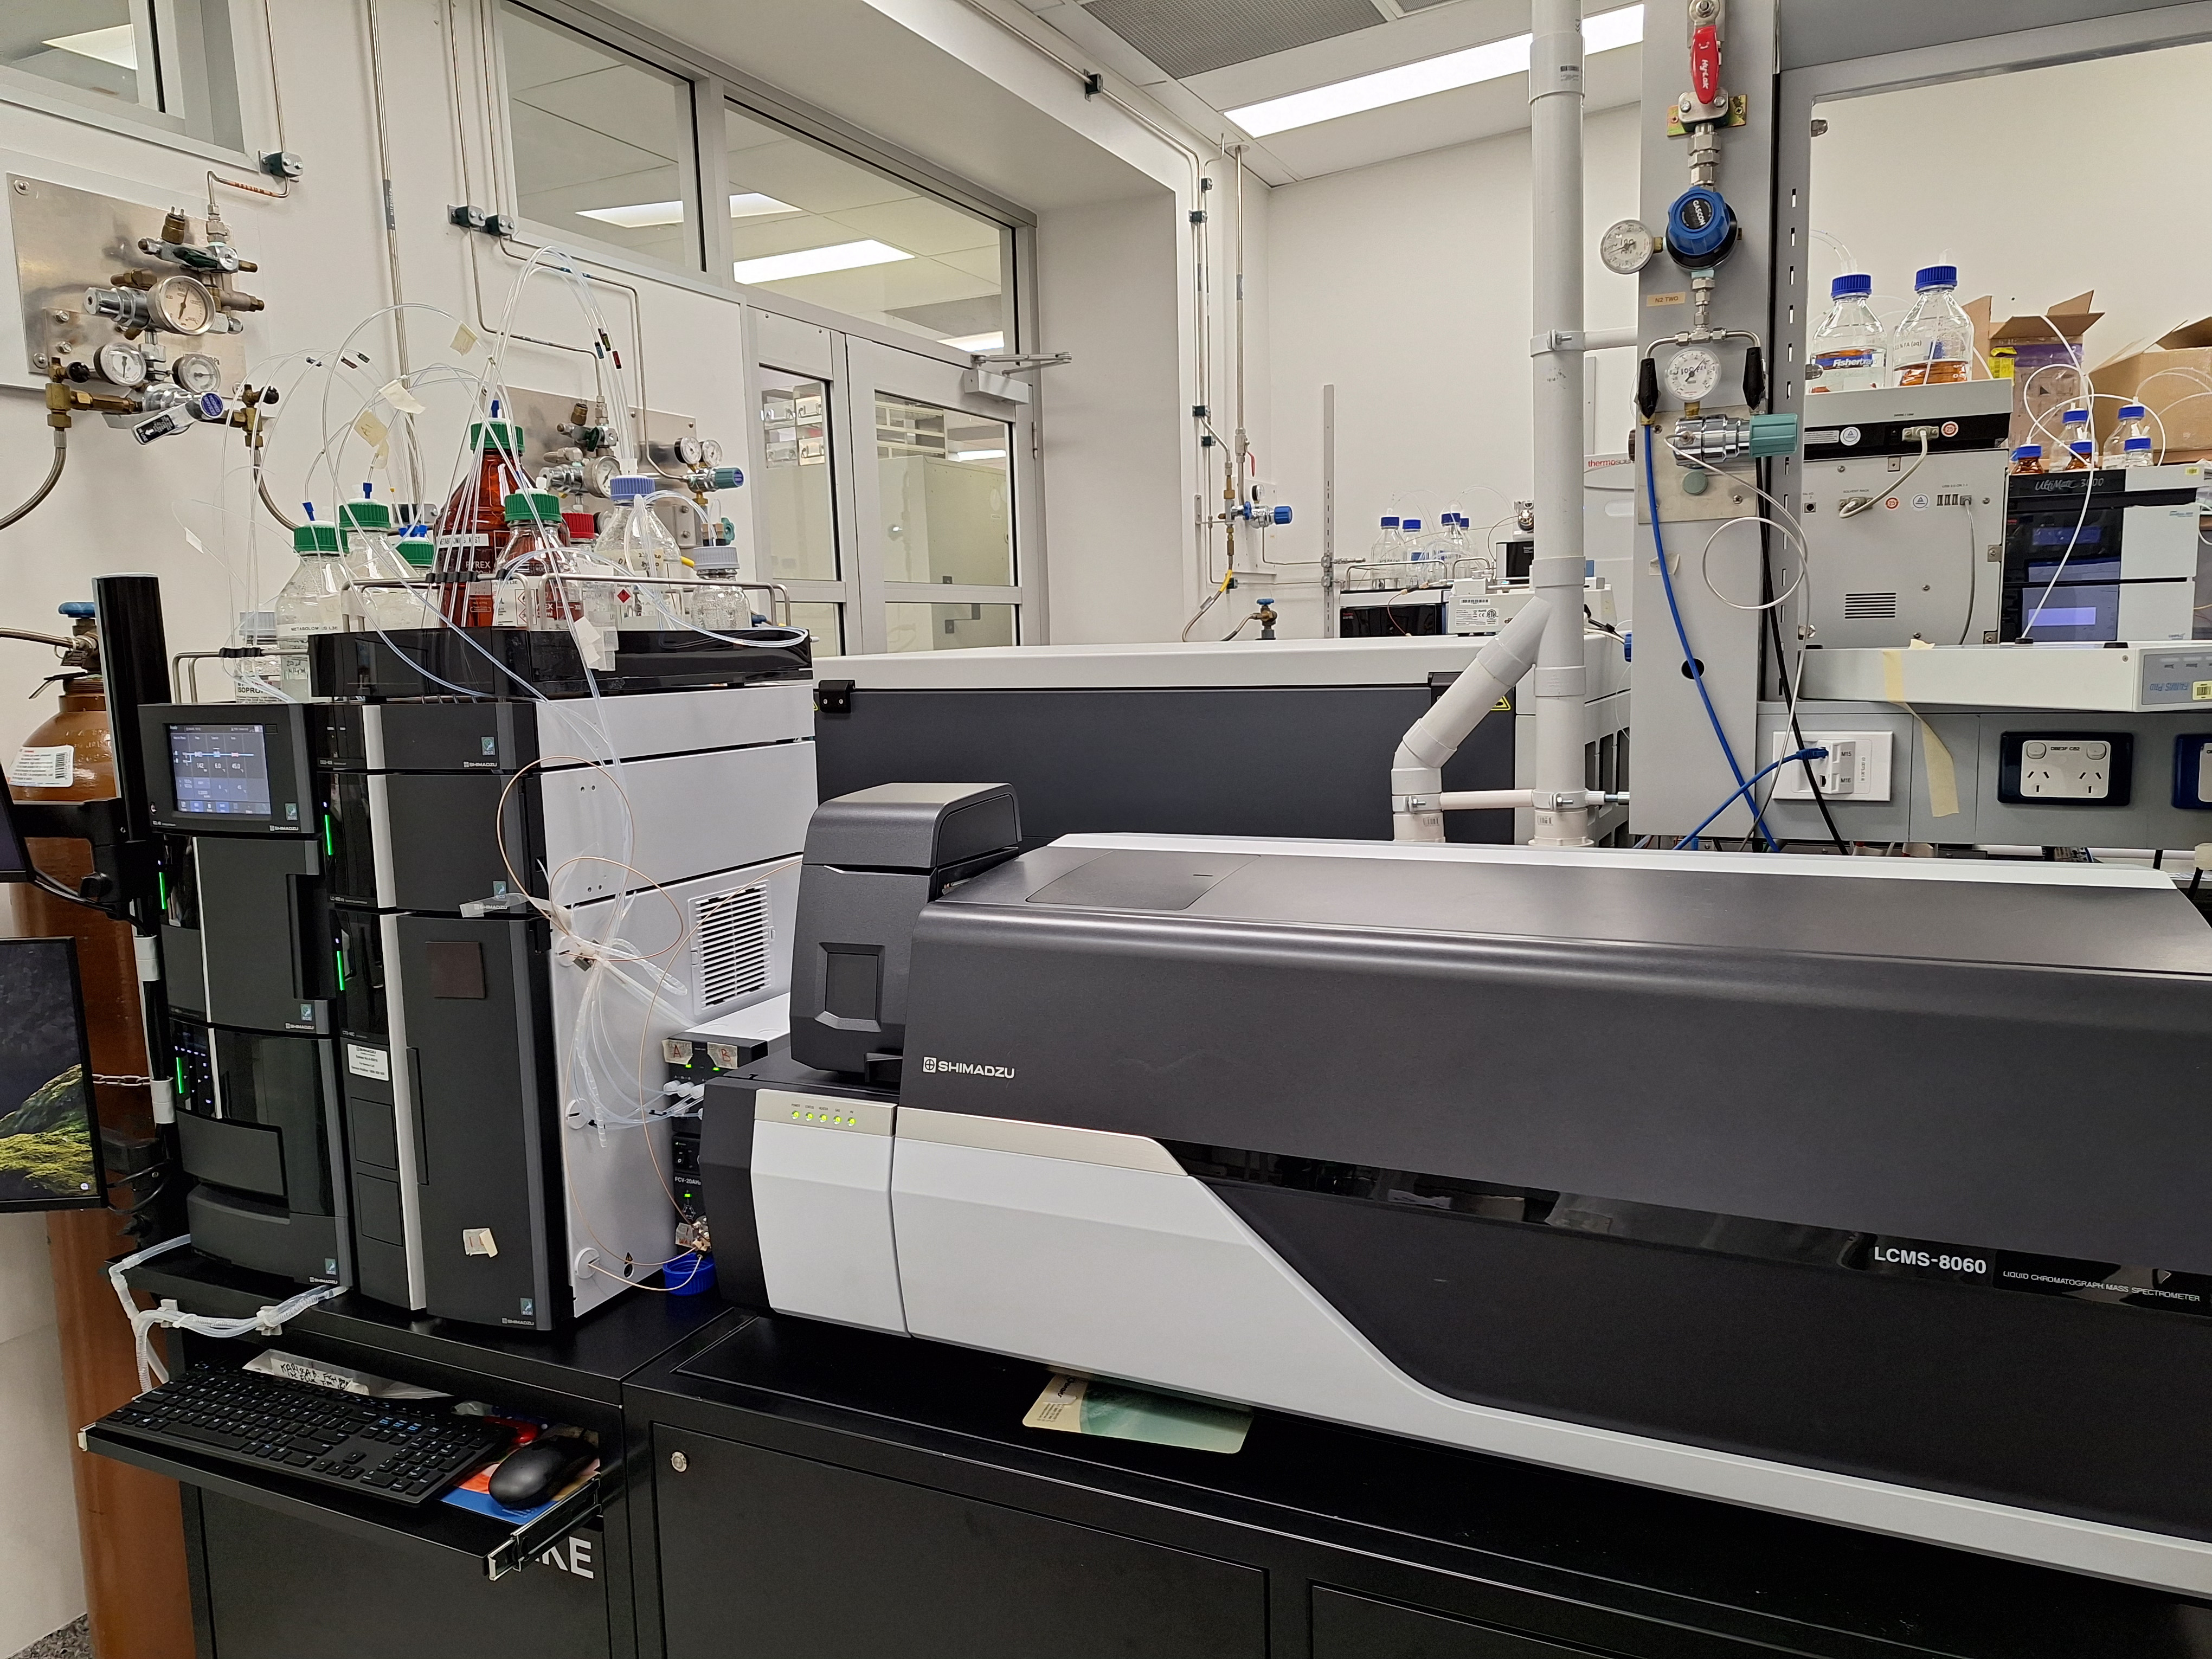
Data acquisition was performed using negative ionization mode, and all analyses were executed on a Shimadzu 8060 LC-MS/MS system.
Instrument : Shimadzu 8060 LC MS-MS
Column: Phenomenex Gemini NX-C18 3µm x 150mm x 2mm (Part No. 00F-4453-B0) fitted with
Phenomenex SecurityGuard column Gemini-NX C18 4 x 2.0mm ID (AJ0-8367).
CCM method compound list
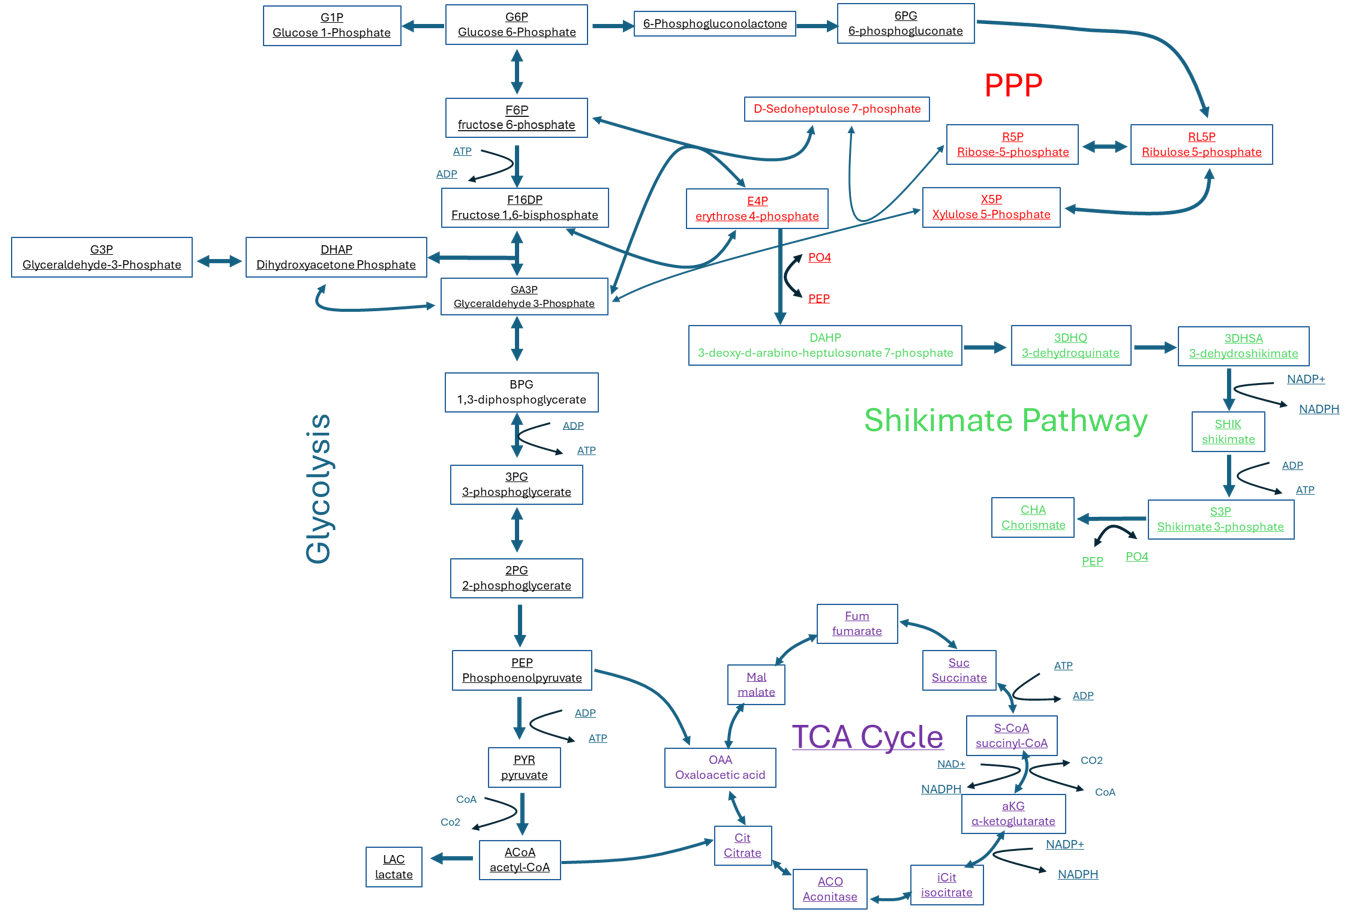
Multiple reaction monitoring (MRM) transitions (Q1/Q3) List for identification and quantification of CCMs.
| A | B | C | D | E | F |
|---|---|---|---|---|---|
| Q1 | Quantifier ion | Qualifier ion | Precursor CE | ||
| Compound Name | m/z(1) | m/z(2) | Ref.(1) m/z(2) | Target Collision Energy | RT (min) |
| 2-Keto-3-Deoxy-6-Phosphogluconate | 257.2 | 97.05 | 78.8 | 16.9 | 25.797 |
| 3- Phospho-D-Glycerate | 185 | 96.95 | 78.95 | 15.6 | 24.751 |
| 3-Dehydroquinic Acid | 189.05 | 171.2 | 109.05 | 13.2 | 6.801 |
| 3-Dehydroshikimic Acid | 171.05 | 109.05 | 127.1 | 19.7 | 8.627 |
| 3-Hydroxybutyrate | 103.3 | 59 | 41 | 13.3 | 9.295 |
| 3-Hydroxybutyrate Coenzyme A | 852.15 | 408.05 | 158.85 | 40.2 | 36.5 |
| 6-Phosphogluconic Acid | 275.1 | 96.9 | 78.95 | 17 | 24.39 |
| α-Ketoglutarate | 145.2 | 101 | 57.1 | 11.9 | 23.349 |
| Acetoacetyl Coenzyme A | 850.15 | 766.1 | 158.85 | 28.9 | 37 |
| Acetolactate | 131.25 | 87.15 | 42.05 | 9.7 | 16.646 |
| Acetyl Coenzyme A | 807.9 | 408.1 | 461.1 | 37.2 | 38.372 |
| Acetylphosphate | 139.2 | 78.8 | 63 | 20.8 | 20.589 |
| Aconitic Acid | 173.1 | 85.05 | 129.15 | 13.2 | 25.982 |
| Adenosine Diphosphate | 426 | 134.1 | 159.1 | 23.4 | 25.84 |
| Adenosine Diphosphate | 741.95 | 620 | 408.05 | 17.6 | 24.711 |
| Adenosine Monophosphate | 346.05 | 79 | 96.95 | 24.7 | 17.662 |
| Adenosine Triphosphate | 505.9 | 158.95 | 408.05 | 30.6 | 35.585 |
| Adipic Acid | 145.25 | 101.05 | 83.15 | 15 | 21.075 |
| Anthranilic Acid | 136.25 | 92.1 | 65 | 16.6 | 22.283 |
| Azidothymidine (Internal standard) | 266.1 | 223.25 | 42 | 11.3 | 15.887 |
| Citrate | 191 | 87.05 | 111.05 | 18.2 | 25.437 |
| Coenzyme A | 766 | 408.05 | 419.1 | 36.2 | 37.604 |
| Creatine Phosphate | 210.05 | 79 | 97 | 21.7 | 21.911 |
| Cytidine Monophosphate | 322.15 | 96.95 | 79 | 21.6 | 11.485 |
| Cytidine Triphosphate | 482 | 159.1 | 384.1 | 30.1 | 34.235 |
| D-Erythrose 4-Phosphate | 199.1 | 96.95 | 79 | 10.3 | 12.129 |
| Dihydroxyacetone Phosphate | 169.2 | 97 | 79 | 10.7 | 12.734 |
| D-Ribose 5-Phosphate | 229.1 | 97 | 79 | 13.8 | 8.969 |
| D-Ribulose 5-Phosphate | 229.1 | 97 | 79 | 11.6 | 11.163 |
| D-Xylulose 5-Phosphate | 229.1 | 97 | 79 | 11.6 | 10.806 |
| Flavin Adenine Dinucleotide | 784.15 | 437.1 | 346.1 | 28.4 | 30.44 |
| Flavin Adenine Mononucleotide | 454.9 | 97 | 78.85 | 26.4 | 24.281 |
| Fructose 1,6-Bisphosphate | 339.1 | 96.95 | 79 | 22 | 25.161 |
| Fructose 6-Phosphate | 259 | 96.95 | 79.05 | 16.8 | 9.345 |
| Fumarate | 115.2 | 71.05 | 27 | 11.4 | 24.3 |
| Glucose 1-Phosphate | 259 | 79.05 | 241.15 | 23.1 | 9.93 |
| Glucose 6-Phosphate | 259.1 | 96.9 | 78.9 | 18.1 | 8.195 |
| Glyceraldehyde 3-Phosphate | 169.1 | 96.9 | 78.9 | 10 | 9.075 |
| Glycerol 3-Phosphate | 171.1 | 79.05 | 96.85 | 23.3 | 9.695 |
| Glycolic Acid | 75.3 | 47.05 | 44.95 | 14.2 | 6.514 |
| Guanosine Diphosphate | 442 | 344.1 | 159.05 | 20.5 | 24.96 |
| Guanosine Monophosphate | 362.05 | 79.05 | 211.15 | 24.5 | 15.234 |
| Guanosine Triphosphate | 522 | 159.1 | 424 | 33.4 | 35.019 |
| Isocitrate | 191.1 | 73 | 173.2 | 21.9 | 25.633 |
| Lactate | 89.3 | 43 | 45.05 | 14.4 | 8.684 |
| Malate | 133.2 | 115.1 | 71 | 16 | 22.114 |
| Malonyl Coenzyme A | 852 | 808.1 | 408 | 26.1 | 20.1 |
| Nicotinamide Adenine Dinucleotide (Oxidised) | 662.1 | 540.15 | 273.05 | 15.9 | 14.168 |
| Nicotinamide Adenine Dinucleotide (Reduced) | 664 | 408.1 | 397.1 | 32.8 | 26.152 |
| Nicotinamide Adenine Dinucleotide Phosphate (Reduced) | 744 | 159 | 622.1 | 53 | 35.308 |
| Para-Amino Benzoic Acid | 136.05 | 92 | NA | 15.5 | 13.471 |
| Phenylpyruvate | 163.35 | 91 | 101 | 11.7 | 39.974 |
| Phosphoenolpyruvate | 167.35 | 78.9 | 62.9 | 21.8 | 25.169 |
| Propionyl Coenzyme A | 821.95 | 408 | 158.9 | 34.4 | 37 |
| Pyruvate | 87.2 | 43 | 31.65 | 12.5 | 13.161 |
| Ribulose 1,5-Bisphosphate | 308.9 | 97 | 78.8 | 21.6 | 25.017 |
| Sedoheptulose 7-Phosphate | 289 | 96.95 | 78.9 | NA | 9.269 |
| Shikimate-3-Phosphate | 253 | 96.95 | 78.95 | 17.1 | 23.763 |
| Shikimic Acid | 173.05 | 93.05 | 111.05 | 21.6 | 5.864 |
| Succinate | 117.25 | 73 | 98.95 | 14.3 | 19.499 |
| Succinate D6 (Internal standard) | 121 | 76.9 | 102.1 | 14 | 19.438 |
| Succinyl-Coenzyme A | 866 | 426.1 | 339.2 | 37.2 | 38.5 |
| Uridine Diphosphate | 403 | 159.1 | 111.05 | 26.2 | 25.04 |
| Uridine Diphosphate Glucuronic Acid | 578.95 | 403 | 323.1 | 23.6 | 34.754 |
| Uridine Diphosphate N-Acetylglucosamine | 606.05 | 385.05 | 159.1 | 28 | 24.437 |
| Uridine Monophosphate | 323.05 | 96.95 | 79.05 | 23 | 14.326 |
| Uridine Triphosphate | 482.95 | 159 | 385.05 | 27.4 | 35.445 |
MS/MS Settings
- Acquisition settings: negative ionisation mode
- Nebulizing Gas flow: 3 L/min
- Heating gas flow: 10 L/min
- Drying gas flow: 10 L/min
- Interface temperature:
300°C - Desolvation line temperature:
250°C
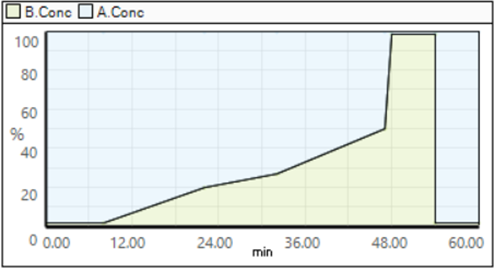
An injection volume of 5 µL was utilized for each sample, with a flow rate maintained at 0.3 mL/min throughout the procedure. The mobile phases consisted of Mobile Phase A: 7.5 mM Tritbutylamine adjusted with acetic acid to a pH of 4.95, and Mobile Phase B: 100% acetonitrile. The chromatographic gradient was established as follows: from 0 to 8 minutes, 2% B; 8 to 22 minutes, a gradient increase from 2% to 20% B; 22 to 32 minutes, further increased to 27% B; 32 to 47 minutes, elevated to 50% B; a sharp rise to 98% B at 47 to 48 minutes, held constant at 98% B until 54 minutes, and then reduced back to 2% B from 54 to 60 minutes.
- Total analysis time: 60 min
- Flow: 0.3 mL /min
- Injection volume: 5ul
- Oven temperature:
45°C
4. GC-MS/MS — Open profiling—amino acids, organic acids, sugars, fatty acids
To the 500uL samples prepared by DD and AP, add 5uL of 500uM 13C sorbitol. Vortex
Dry aliquots of this extract, by adding 10µl aliquots into a glass insert and drying in a speed vacuum.
Before analysis, perform a final quick dry down by adding 25µl methanol as samples must be completely dry before derivatising with methoxyamine and BSTFA + 1%TMCS.
Derivatise with methoxyamine (meox) (30mg/ml in pyridine) and BSTFA + 1%TMCS.
Add 25ul meox solution and incubate at 37°C for 2 hours. Centrifuge for 10 seconds.
Add 25uL BSTFA+ 1%TMCS reagent and incubate at 37°C for 30 minutes. Leave at room temperature for 2 hours before injecting in GCMS system.
GC-MS analysis was performed on a Shimadzu GC/MS-TQ8050 NX system. 1 µL of derivatised sample was injected into the GC inlet set at 280°C in split mode of 1:10. Chromatographic separation was achieved using an Agilent DB-5 ms capillary column (30 m × 0.25 mm × 1 µm). Oven conditions were set at 100°C starting temperature, held for 4 min, then ramped at 10 °C/min to 320°C and held for 11 min. Helium was used as the carrier gas at a flow rate of 1 mL/min.
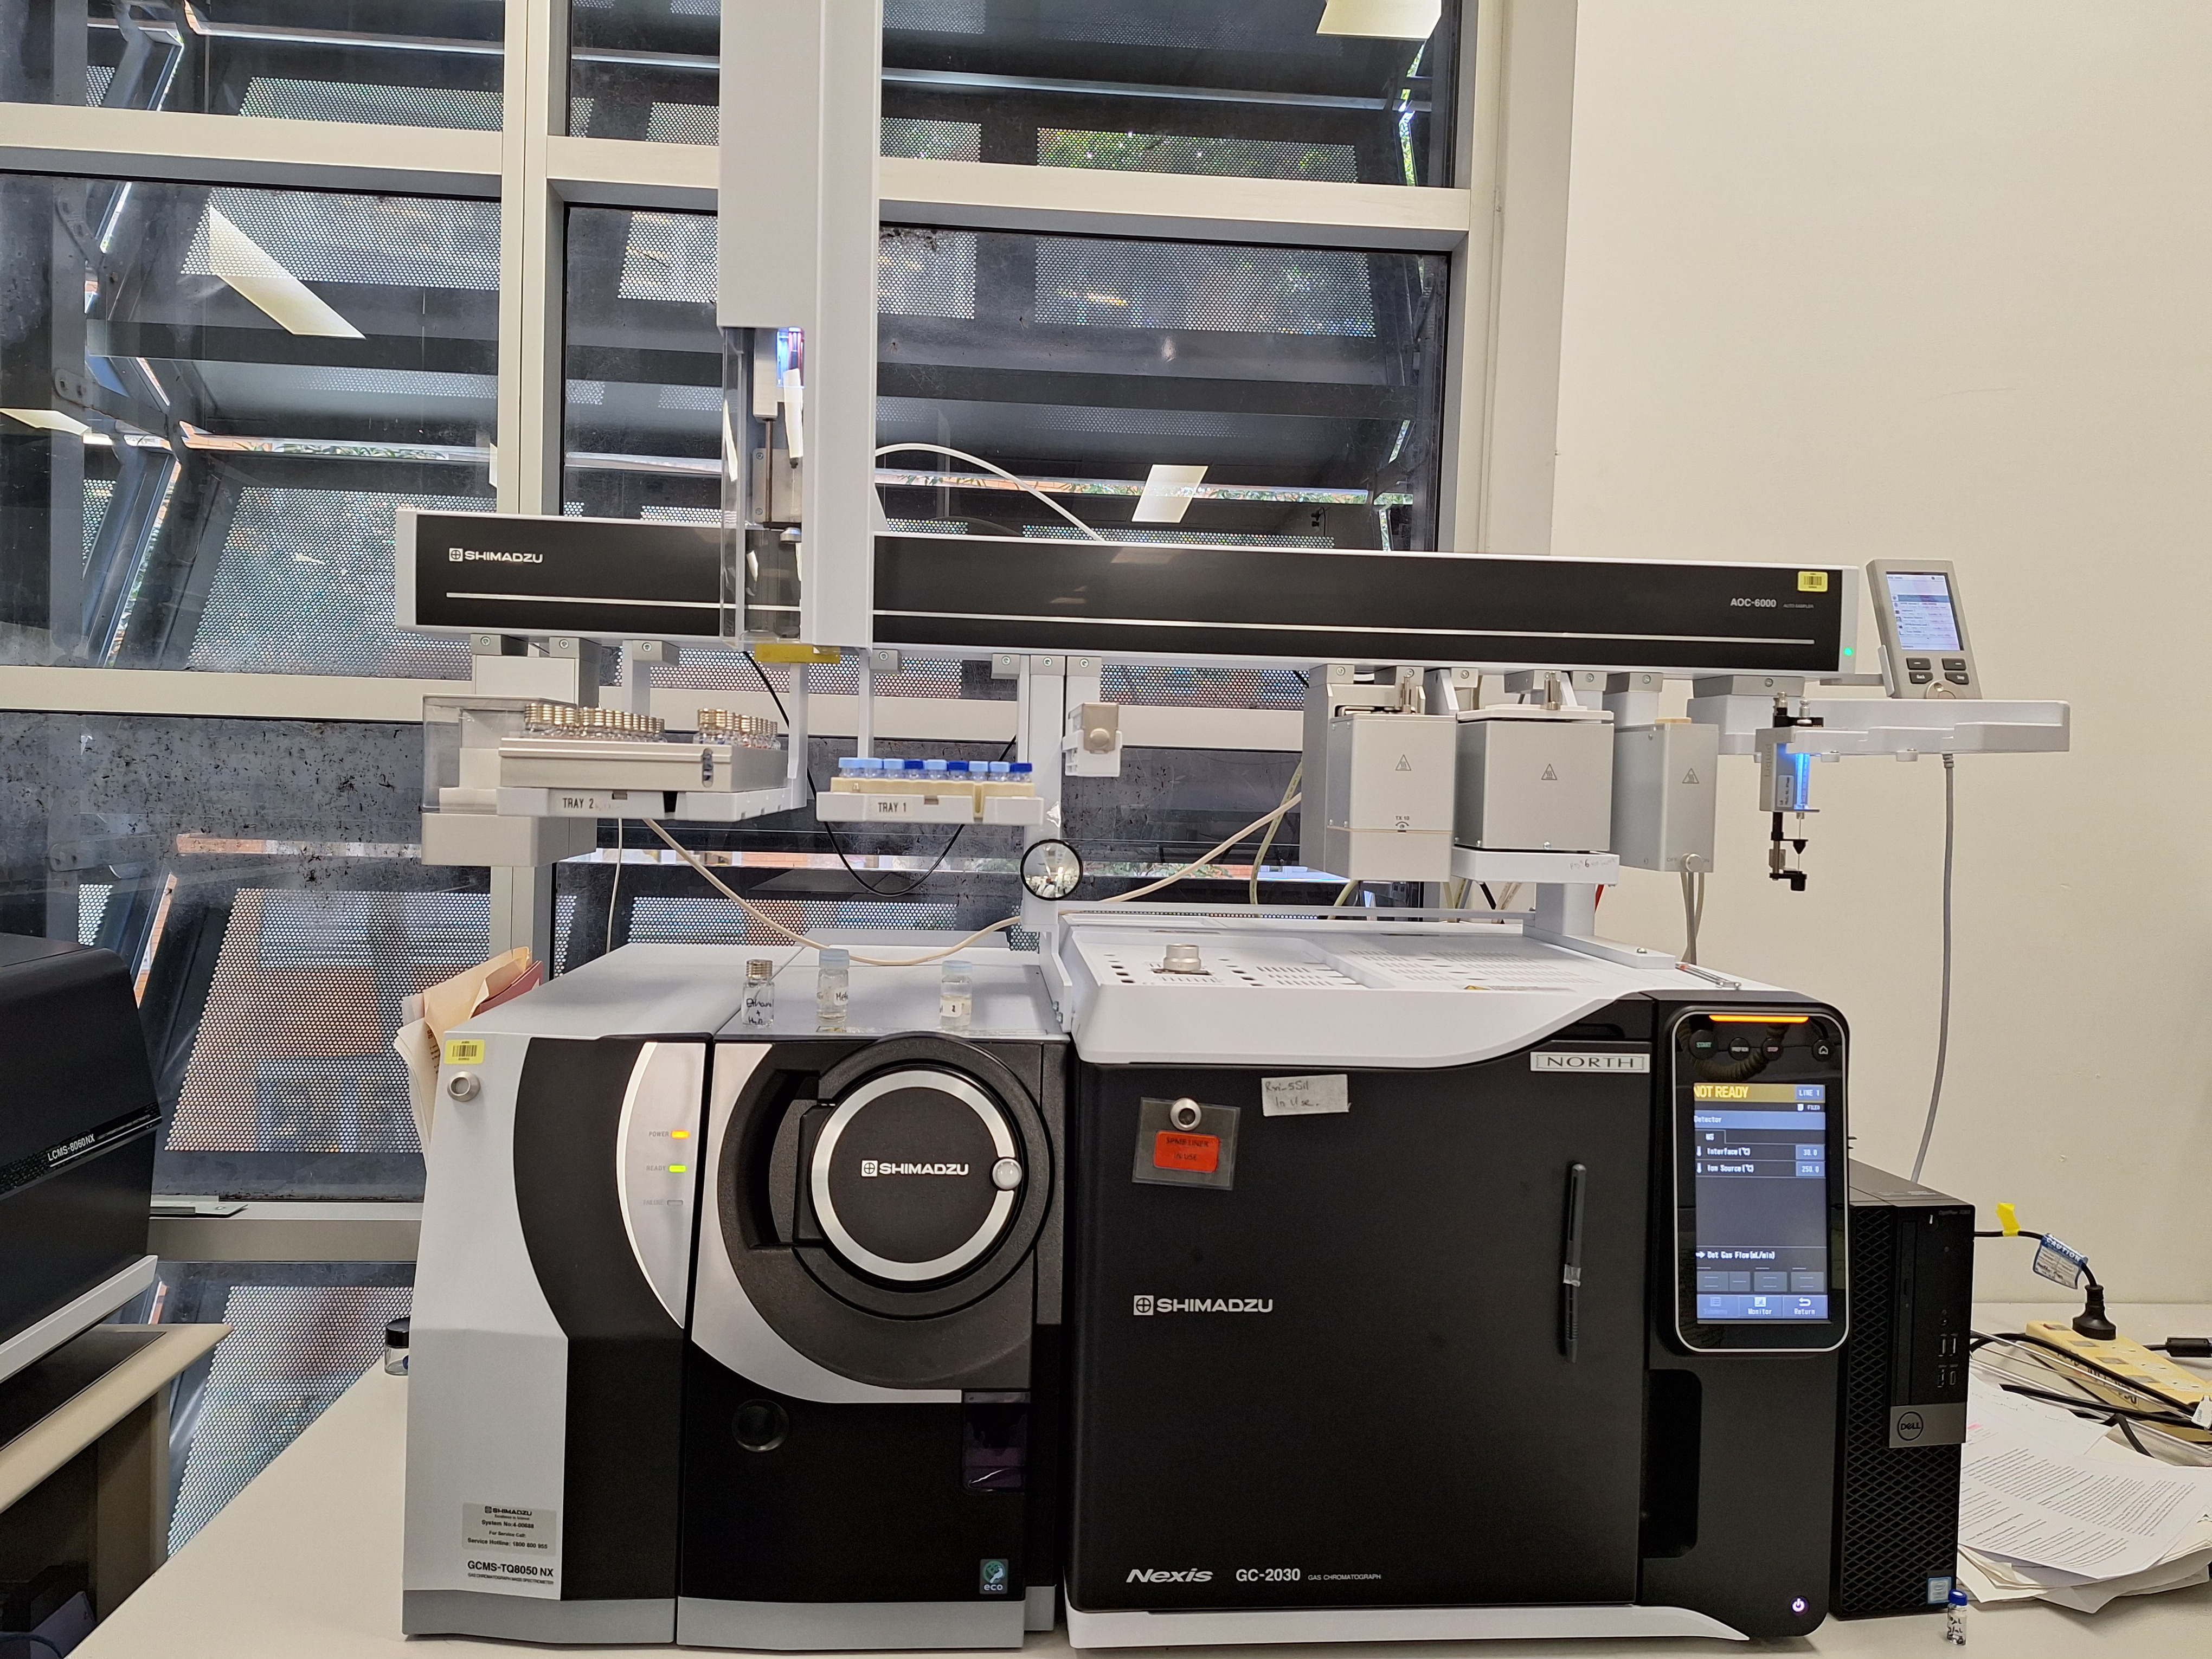
Compounds were fragmented by electron impact (EI) ionization and analysed in full scan and MRM mode using the Shimadzu Smart Metabolites Database. (https://www.shimadzu.com/an/gcms/metabolites/index.html) https://www.shimadzu.com/an/gcms/metabolites/index.html)
A high-quality matrix was manually curated using the Shimadzu LabSolutions Insight GCMS program (v.3.7 SP3, Shimadzu Corporation), where metabolite targets were removed from the dataset if they were not present in all samples.

