Microinjection Techniques in Fly Embryos to Study the Function and Dynamics of SMC Complexes
Catarina Carmo, Margarida Araújo, Raquel Oliveira
SMC complexes
Cohesin
Condensin
Drosophila melanogaster
Syncytial embryo
Microinjections
TEV protease
Fluorescence recovery after photobleaching (FRAP)
FRAP
Abstract
Structural maintenance of chromosomes (SMC) proteins are critical to maintain mitotic fidelity in all organisms. Over the last decades, acute inactivation of these complexes, together with the analysis of their dynamic binding to mitotic chromatin, has provided important insights on the molecular mechanism of these complexes as well as into the consequences of their failure at different stages of mitosis.
Here, we describe a methodology to study both SMC function and dynamics using Drosophila melanogaster syncytial embryos. This system presents several advantages over canonical inactivation or imaging approaches. Efficient and fast inactivation of SMC complexes can be achieved by the use of tobacco etch virus (TEV) protease in vivo to cleave engineered versions of the SMC complexes. In contrast to genetically encoded TEV protease expression, Drosophila embryos enable prompt delivery of the protease by microinjection techniques, as detailed here, thereby allowing inactivation of the complexes within few minutes. Such an acute inactivation approach, when coupled with real-time imaging, allows for the analysis of the immediate consequences upon protein inactivation. As described here, this system also presents unique advantages to follow the kinetics of the loading of SMC complexes onto mitotic chromatin. We describe the use of Drosophila embryos to study localization and turnover of these molecules through live imaging and fluorescence recovery after photobleaching (FRAP) approaches.
Steps
Collecting and Preparing Embryos for Live Imaging
Set up a cage with the fly strain of your choosing. Use an apple juice plate with a smear of fresh yeast paste at the bottom of the cage.
Change plates at least once a day, even on days without experiments. To do this, invert the cage, tap it strongly, so as to bring the flies to the bottom, and exchange plates.
On the day of the experiments, start with a precollection of 1h 0m 0s–2h 0m 0s to release retained eggs and increase staging accuracy.
The time of collection will depend on the desired developmental time—shorter collection times for early divisions and longer collection times for late developmental stages. For example, to collect embryos that are, at most, at nuclear division 10 (blastoderm nuclei), corresponding to 1h 30m 0s of development, you may want to start with a collection of 1h 15m 0s, counting with ~0h 15m 0s for embryo preparation.
To collect embryos from the agar plate (Fig. 3a), use an artist’s brush (moist with water) and swipe them onto a cell strainer, placed on a container with tap water.
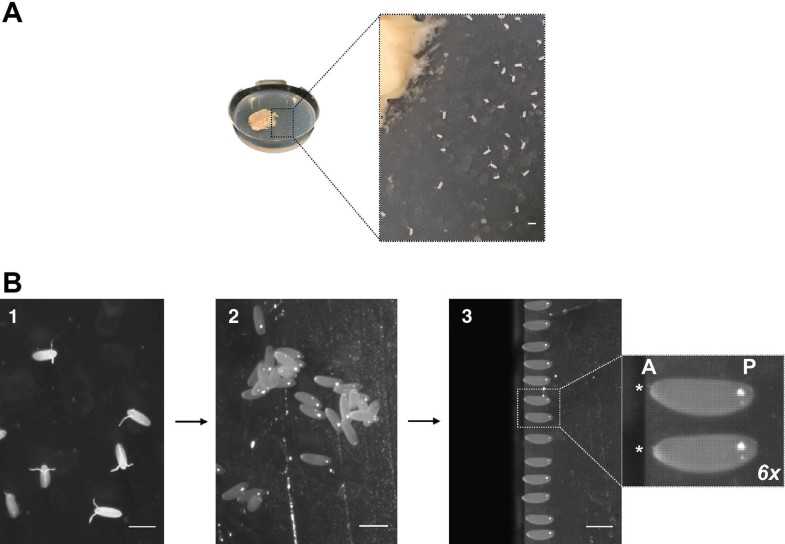
Briefly remove excess water on a tissue paper and transfer the embryo containing cell strainer to a container with 50%(v/v) bleach. Incubate for 0h 2m 0s at 4Room temperature. This will remove nontransparent chorion (dechorionation), essential for injection and imaging.
Remove excess bleach solution with a tissue paper. Wash embryos with a squeeze bottle with distilled water. Water pressure from the bottle directly on the embryos will help in the removal of chorion. Rinse the embryo containing cell strainer in the container with tap water.
Cut a small block of a clean apple juice agar with a scalpel and place it on a coverslip, to be viewed under a stereo microscope.
Using a 24 × 60 mm coverslip, place around 6µL–8µL in the middle of the coverslip as a single row and tilt it to make it spread as an even layer. This will be used to mount the embryos for live imaging.
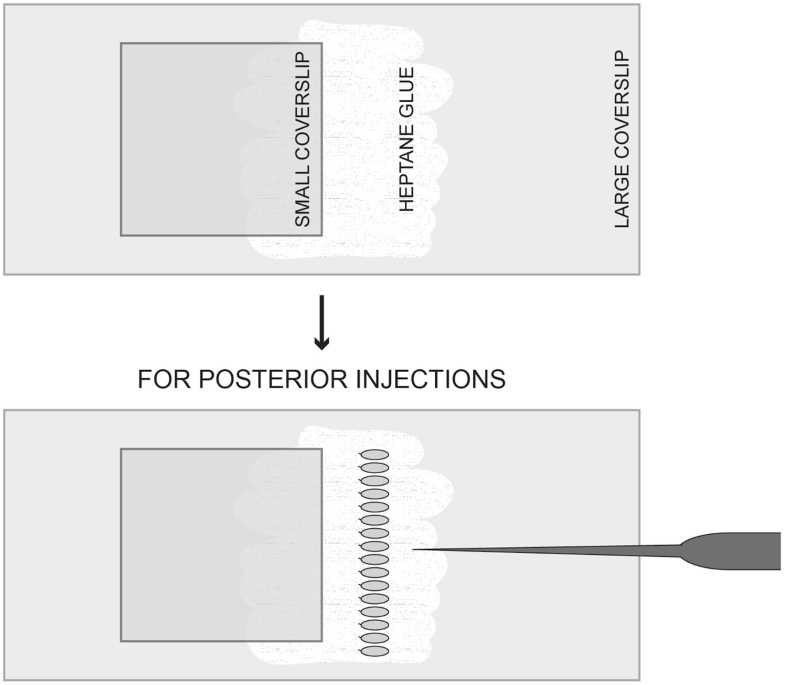
For injections: take a smaller coverslip (18 × 18 or 22 × 22 mm) and place it so as to overlay approximately half of the glue layer (Fig. 2 for scheme).
Transfer embryos from the cell strainer using a brush and place them on the agar block, with the aid of a steel probe. Dechorionated embryos should have an ovoid shape without the dorsal appendages (Fig. 3b2).
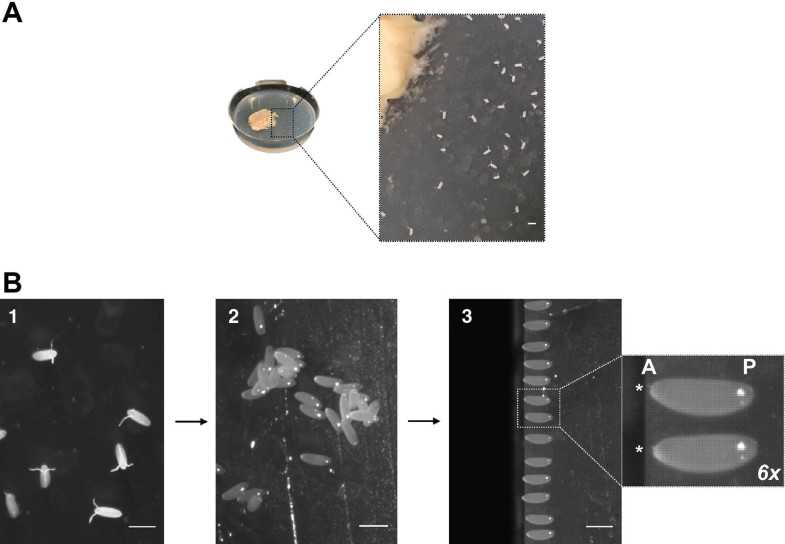
Align the embryos in a row, making sure all face the same direction (i.e., every embryo has the anterior side, marked by micropyle, oriented to the same direction). Use the edge of the agar block as a reference (Fig. 3b2).
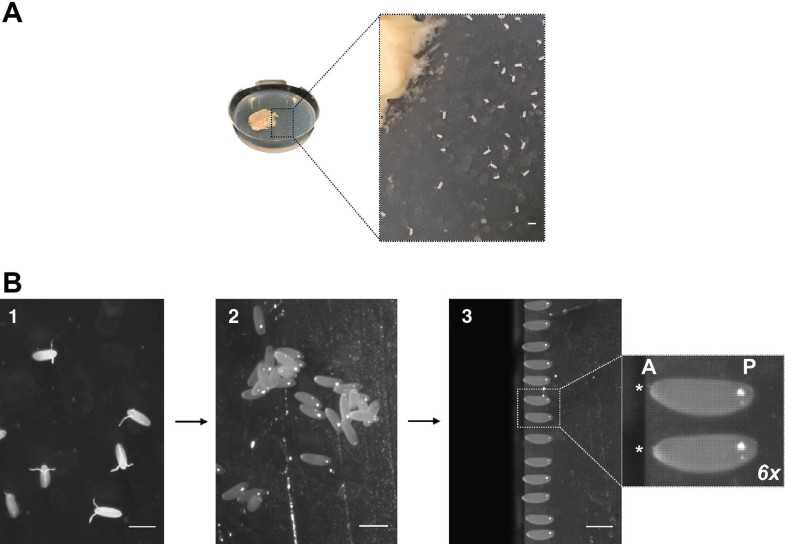
Once aligned, take the preprepared 24 × 60 mm coverslip (see step 9) and with the glue side facing down lower it until you glue the embryos, by gently pressing on the agar block. Keep it parallel to the smaller coverslip, with the micropyle facing this side (for posterior end injections).
For injections only: leave the preparation to dry for 0h 10m 0s–0h 14m 0s.
Using a 20–200 μl tip, take halocarbon oil and place it on top the row of aligned embryos and part of the smaller coverslip. This will keep embryos moist and oxygenated.
Samples are ready for the following processes, including live cell imaging of unperturbed embryos (see next section).
Microinjection Techniques in Fly Embryos
Before usage, centrifuge your microinjection sample at high speed for 0h 30m 0s at 4°C, so as to impede precipitates to be extracted and possibly clog the injection needle.
Load the needles using Microloader Tips. Take care not to leave air bubbles during loading, as it will make injection impossible. Prepare all needles needed before starting the experiment, to minimize time between injections.
Once at the microscope, first turn on the injector controller and the micromanipulator. Then, place the first needle in the holder—must be tight to maintain correct pressure—and connect the capillary to the pressure pump afterward.
Using the lower magnification objective (10× or 20×), put the needle down slowly in the focal plane of the smaller coverslip. When the needle is close to the coverslip you will start seeing a shadow through the lens (Fig. 4a).
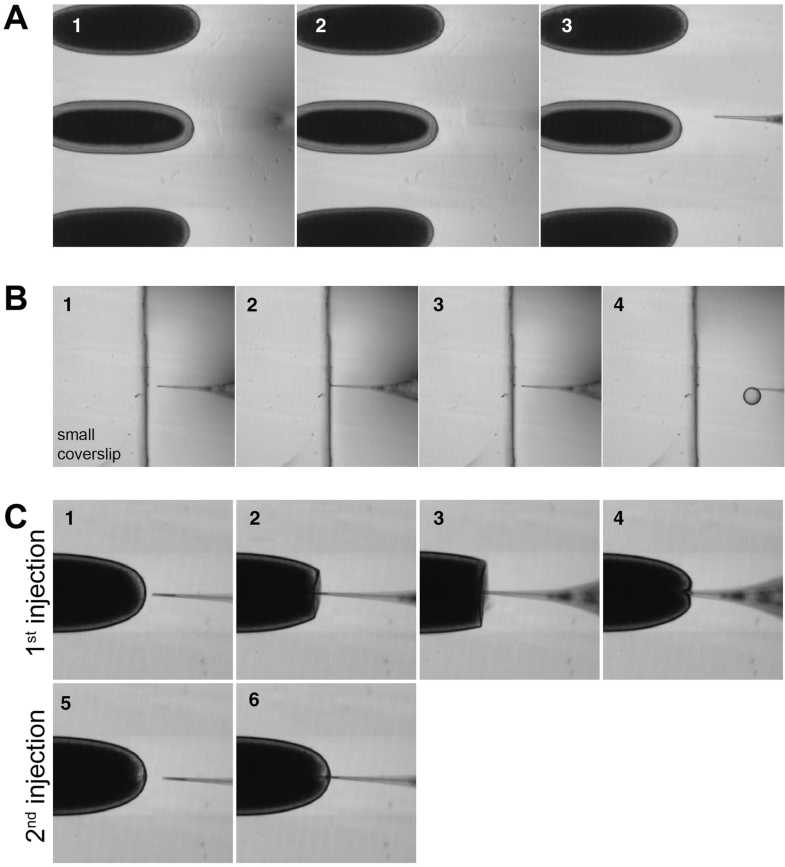
Prepulled needles need to be further opened prior to injections. The smaller coverslip next to the row of aligned embryos will serve as a barrier to break the tip of the needle and thus to open it. Press gently the needle against the edge of the coverslip until it breaks slightly and try several injections until the correct droplet size is achieved. Press the injection button and evaluate the size of the drop (Fig. 4b), where 6 shows an appropriate drop, that should range from 30 to 50 μm in diameter (up to one-tenth of embryo length). The size of the droplet can be controlled by regulating the amount of pressure and the injection time, for example, when using an Eppendorf FemtoJet Microinjector controller. If the needle gets clogged, it can be opened further using the same strategy as before.
To perform an injection, as the needle comes in contact with the embryo’s posterior pole, notice how the membranes retract with it (Fig. 4c2, 3 and ESM Movie S1). Move the needle further until it goes through the embryo (Fig. 4c4) and inject.
For multiple injections, change the needle and inject the second/third solution through the same hole. The small opening from the first injection facilitates the entry of the second needle inside the embryo, without membrane retraction. Figure 4c6 displays a second injection using the same injection site.
Inactivation of SMC Complexes by TEV Cleavage
Use your reference channel (e.g., fluorescent histones) to select an embryo with the required nuclear density and in late interphase using a 63× or 100× lens.
Switch to a lower magnification lens for injections.
Induce a metaphase arrest through the injections of 12mg/mL–30mg/mL into the embryo. Imaging acquisition can be performed (using a 63× or 100× lens). After 0h 6m 0s–0h 8m 0s, every nucleus should have their chromosomes aligned forming the metaphase plate (Fig. 5a).
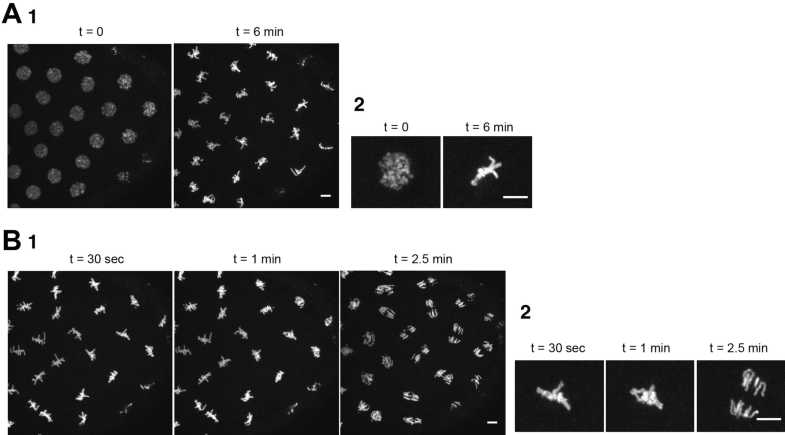
Subsequently, perform a second injection with TEV protease at 5mg/mL–10mg/mL. If the protease is at this concentration, sister chromatid separation should be observed within 0h 1m 0s–0h 2m 0s after TEV protease injection in flies carrying TEV-sensitive cohesin complexes (Fig. 5b).
Fluorescence Recovery After Photobleaching (FRAP)
Use your reference channel (e.g., fluorescent histones) to select an embryo with the required nuclear density and in late-interphase using a 63× or 100× lens.
Switch to a lower magnification lens for injections.
Inject 12mg/mL–30mg/mL UbcH10C114S C114S(intact spindle forces) or 2millimolar (mM) into the embryo to induce a metaphase arrest, if required. After 0h 6m 0s–0h 8m 0s, every nucleus should be arrested in prometaphase or metaphase.
Select a field for imaging, preferably including the nuclei closer to the coverslip.
Image for a short period a time (e.g., 0h 2m 0s) before inducing a bleaching pulse. This will provide a reference for basal fluorescent intensity before bleaching and recovery occur.
According to the imaging software available to induce FRAP, draw ROIs of the nuclei to be bleached, bleaching a maximum of one-fourth of the metaphases in the field (see Fig. 6a).
![Fig. 6 Example of a typical FRAP experiment with Barren-EGFP expressing embryos. (a) (1) Still image of a UAS-Barren-EGFP embryo [22] arrested at metaphase with 12 mg/ml of UbcH10C114S. (a) (2) Close-up of representative still images of a metaphase plate during a FRAP experiment. Fire LUT was used to emphasize a photobleaching event and subsequent recovery of fluorescence intensity. Dashed areas indicate the half-metaphase plate where it was induced a bleaching pulse. Fluorescence intensity can be measured using a small circular ROI from bleached half metaphase plate—dashed circle, and controlled with the corresponding unbleached half metaphase plate—full circle. Live imaging was performed using a confocal spinning disk microscope with MetaMorph acquisition software, using a 63× immersion (oil) objective. Time-lapse series were processed using Fiji Scale bar: 2 μm. (b) Three possible scenarios can arise from a FRAP experiment: (1) after bleaching pulse, no fluorescence recovery is detected, hence, no turnover is deduced; (2) fluorescence intensity increases after pulse but not similar to prepulse intensities, indicating there was some exchange of molecules; (3) full recovery of fluorescence intensity to similar levels as before pulse, suggestive of a highly dynamic turnover. # shows the time of bleaching pulse. The difference between the plateau andy0 indicates the mobile fraction.t(time) to which half of plateau’s fluorescence intensity corresponds is the half-time Fig. 6 Example of a typical FRAP experiment with Barren-EGFP expressing embryos. (a) (1) Still image of a UAS-Barren-EGFP embryo [22] arrested at metaphase with 12 mg/ml of UbcH10C114S. (a) (2) Close-up of representative still images of a metaphase plate during a FRAP experiment. Fire LUT was used to emphasize a photobleaching event and subsequent recovery of fluorescence intensity. Dashed areas indicate the half-metaphase plate where it was induced a bleaching pulse. Fluorescence intensity can be measured using a small circular ROI from bleached half metaphase plate—dashed circle, and controlled with the corresponding unbleached half metaphase plate—full circle. Live imaging was performed using a confocal spinning disk microscope with MetaMorph acquisition software, using a 63× immersion (oil) objective. Time-lapse series were processed using Fiji Scale bar: 2 μm. (b) Three possible scenarios can arise from a FRAP experiment: (1) after bleaching pulse, no fluorescence recovery is detected, hence, no turnover is deduced; (2) fluorescence intensity increases after pulse but not similar to prepulse intensities, indicating there was some exchange of molecules; (3) full recovery of fluorescence intensity to similar levels as before pulse, suggestive of a highly dynamic turnover. # shows the time of bleaching pulse. The difference between the plateau andy0 indicates the mobile fraction.t(time) to which half of plateau’s fluorescence intensity corresponds is the half-time](https://static.yanyin.tech/literature_test/protocol_io_true/protocols.io.bnx6mfre/ebesbby877.jpg)
Induce the pulse.
Image immediately after bleaching for a longer period of time (e.g., 0h 15m 0s), keeping the same settings as prebleaching imaging.
Analyze the recovery using quantitative imaging software (e.g., Fiji [30]).
The mean fluorescence intensity can be normalized in several ways (e.g., to the first time point before pulse (t0) or to unbleached half metaphase for each time point).
Plot the relative mean fluorescence intensity versus time in a xy manner.
For estimation of protein turnover, fit the data to the appropriate function (e.g., the One Phase Association equation
| A | B |
|---|---|
| Variable | Definition |
| Y0 | Value of y at t = 0 Expressed in the same units of y |
| Plateau | Value that y tends to for infinite of x Expressed in the same units of y |
| K | Rate constant Expressed in –t (inverse of x units) |
| Tau | Time constant Expressed in the inverse of y units |
| Half-time | Time of fluorescence recovery after the pulse where the fluorescence intensity is half of the final recovered intensity Expressed in the same units of x |
| Span (mobile fraction) | Difference in intensity between y0 and plateau Expressed in the same units of y |
Table 1Quantitative variables from one-phase association curve fitting
FRAP will result in three possible scenarios: no recovery of fluorescence intensity, indicating that there was no replacement of fluorescent molecules and hence, the protein is stable and did not turn over; partial recovery of fluorescence intensity or complete recovery of fluorescence intensity, where there was limited or complete exchange of the tagged protein (Fig. 6b) [31].

