Isolation and Characterization of Tissue and Cell-Derived Extracellular Vesicles and Non-Vesicular Extracellular Particles
Marta Garcia Contreras, Emeli Chatterjee, Abhik Chakraborty, Michail Spanos, Kriti Bomb, Priyanka Gokulnath, Jeffery L. Franklin, Erika Duggan, John P. Nolan, Priyadarshini Pantham, Louise C. Laurent, Saumya Das
Disclaimer
This chapter is for publication in an upcoming volume of “Methods in Molecular Biology”
Abstract
Cells produce a heterogeneous complement of extracellular biomolecular complexes,
including extracellular vesicles (EVs) and non-vesicular extracellular particles
(NVEPs). EVs are lipid bilayer-enclosed membrane particles released by cells. NVEPs
are recently discovered amembranous small multimolecular assemblies with distinct
RNA and protein cargoes. EVs and NVEPs are released by most cell types and can
be found in biological fluids. Both types of extracellular complexes contain unique
cargo and have important biological functions. Due to their great potential as
diagnostic tools, there is a growing interest in being able to identify and characterize
tissue- and cell- derived EVs and NVEPs. Here we described protocols for isolating
EVs by size exclusion chromatography (SEC) or an ultracentrifugation method to
simultaneously isolate EVs and NVEPs from conditioned media supernatant following
tissue or cell culture. In addition, we describe microfluidic resistive pulse sensing,
vesicle flow cytometry, and immunoblotting methods for their characterization.
Steps
Processing of Conditioned Culture Media following Tissue and Cell Culture
Culture DiFi cells11 under the appropriate culture conditions as previously
published. BeWo cells were cultured as published earlier12,13 with the
modification of addition of 10% exosome-depleted FBS).
Culture placental explant tissue14 and adipose tissue under the appropriate
culture conditions as previously published (see Notes 1 and 2).
If performing tissue culture, collect conditioned culture media supernatant
along with all small pieces of tissues into a fresh 15 mL or 50 mL Falcon
tube.
2000x g,0h 0m 0s Centrifuge at 2,000 xg for 10 minutes at Room temperature (20-22°C).
Remove conditioned culture media supernatant carefully without disturbing
the pellet and pass it through 0.8 μm syringe filter (optional) to avoid any
cellular debris contamination (See Note 3).
Aliquot and store filtered media stored at -80°C.-80°C
Isolation of Extracellular Vesicles and Non-Vesicular Extracellular Particles
Size Exclusion Chromatography to Isolate Extracellular Vesicles
Turn on the Izon Automatic Fraction Collector (AFC) by switching on the
power button at the rear of the instrument
Set up the 35 nm qEV Original Gen 2 column on the column mount. Insert
the column from above into the column mount, then remove the lower cap and carefully dock the column. Ensure that the IZON logo on the column is
facing away from the AFC tower.
Once the qEV column and the column mount have been attached to the
AFC, the column type is determined automatically and is displayed on the
AFC touchscreen.
From the screen, set the fraction number to 4, fraction size 400 µL, and
buffer volume to 2.9 mL for collection ( See Note 4)
Lock the collection tubes onto the carousel in the appropriate orientation.
Gently place the carousel onto the carousel plate (See Note 5).
Add 500 µL of the sample on the top of the qEV original column Gen 2
Collect fractions 7 to 10 (position 1 to 4) and combine them. The volume
can be adjusted by concentrating them according to the downstream
experiments. (See Note 6).
Differential Ultracentrifugation to Isolate Extracellular Vesicles and Non-Vesicular Extracellular Particles s
Centrifuge tissue or cell culture conditioned media in 15 mL tubes at 2,000
xg for 20 minutes at4°C to remove dead cells. Discard the pellet and
transfer the supernatant to a new collection tube
Optionally, pellets can be washed by resuspending them in PBS and
repeating the corresponding centrifugation step.
To isolate large extracellular vesicles (l-EVs), centrifuge the supernatant at
10,000 xg for 40 minutes at4°C
Resuspend the pellet containing l-EVs in PBS-H and store at -80°C until
further analysis (See Note 7). The supernatant is transferred to the
corresponding ultracentrifuge tube.
To isolate small extracellular vesicles (s-EVs) centrifuge the supernatant at
167,000 xg for 4 hours at4°C
Resuspend the pellet containing s-EVs in PBS-H and store at -80°C until
further analysis. The supernatant is transferred to the corresponding ultracentrifuge tube
To isolate exomeres, centrifuge the supernatant at 167,000 xg for 16 hours
at4°C
Resuspend the pellet containing exomeres in PBS-H and store at -80°C
until further analysis. The supernatant is transferred to the corresponding
ultracentrifuge tube.
To collect supermeres, centrifuge the supernatant at 367,000 xg for 16
hours at4°C .
The pellet containing supermeres is resuspended in PBS-H and stored at
-80°C until further analysis.
Characterization of Extracellular Vesicles and Non-Vesicular Extracellular Particles
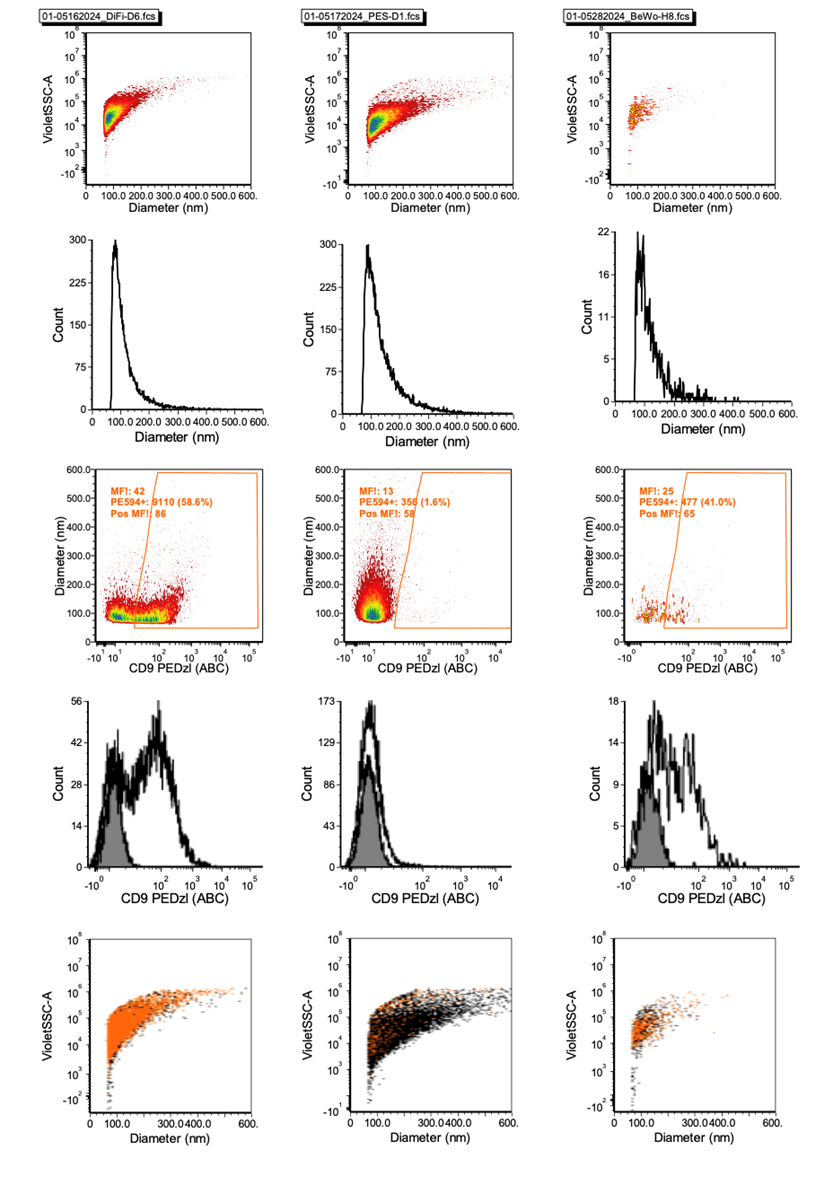
Vesicle Flow Cytometry to Characterize Extracellular Vesicles in Conditioned Culture Media - Determining optimum dilution for the samples for vFC assay
Thaw neat, unconcentrated conditioned culture media samples on ice (See
Note 8).
The .fcs files generated by the flow cytometer can be analyzed in the FCS
Express software package (See Note 15).
The dilution that generates 25,000-50,000 total events is considered the
optimum dilution for the vFC assay.
Vesicle Flow Cytometry to Characterize Extracellular Vesicles in Conditioned Culture Media - Staining of Optimally Diluted EVs with Fluorescently Labelled Antibodies Staining of Optimally Diluted EVs with Fluorescently Labelled Antibodies
Thaw neat, unconcentrated conditioned culture media samples on ice
The total staining reaction volume should be 50 µL .
- For single surface marker staining, add 5 µL of pre-titrated antibodies
to each tube of the reaction mixture.
-
Add 5 µL of 10X vFRed to each tube of the reaction mixture.
-
The sample input must be calculated as per the optimal dilution decided
in the previous experiment.
The total vFC staining/dilution buffer needs to be adjusted as per the
volume of sample input, total volume of antibody/antibodies, and the
volume of vFRed added to the reaction mixture
After the total reaction mixture is made, pipette the contents of the well to
mix using a 50 µL multichannel pipette
Incubate the staining reaction mixture in dark for 1 hour at room
temperature.
Post-stain, dilute the sample 1000X in vFC dilution/staining buffer, (See
Note 12 and Note 13), pipette 4-5 times to mix the wells after the dilutions
are made using a 1000 µL multichannel pipette. The sample dilutions are
ready to be read using the Cytoflex S.
Before loading the sample into the flow cytometer, clean the cytometer by
running a cleaning reagent followed by a 0.22 µm-filtered deionized water
wash.
Prepare vFRed 10X working solution from the 100X stock using vFC buffer.
(See Note 9)
Open a new experiment in the flow cytometer using a pre-saved template
used for the assay (See Note 14)
Analyze the .fcs files generated by the flow cytometer using the FCS
express software package (See Note 15) to calculate the diameter of the
vesicles and the number of vesicles that are positive for each surface
marker, and each combination of surface markers (Figure 1a-c).
Make serial dilutions of the samples: 1:10, 1:20, 1:40, 1:80, 1:160, 1:320.
(See Note 10). Make these dilutions in individual wells of a 96-well plate.
Add 5µL of 10X vFRed to each of the sample dilution wells and pipette mix
them using a 200µL. (See Note 11).
Incubate the 96-well plate in the dark for one hour at room temperature
Post incubation, dilute the sample 1:1000 in vFC dilution/staining buffer.
(See Note 12 and Note 13) and mix the wells 4-5 times after the dilutions
are made using a 1000 µL multichannel pipette. The sample dilutions are
ready to be read using the Cytoflex S (or other suitably sensitive flow
cytometer).
Before loading the sample into the cytometer, clean the flow cytometer by
running 250µL the Coulter-cleanse cleaning solution followed by 250µL of
a 0.22µm-filtered deionized water wash.
The sample can be loaded into the flow cytometer in two ways: a) manually:
by using FACS tubes/Ria vials for individual samples; or b) semiautomated using a 96-well plate-loader. The semi-automatic plate loader
can be used to load the samples into the flow cytometer since the number
of sample tubes is >10.
Open a new experiment in the CytExpert software using a pre-saved
template used for the assay (See Note 14).
Microfluidic Resistive Pulse Sensing to Characterize Fractions Collected from Size-Exclusion Chromatography y
Begin by priming the microfluidic system of the Spectradyne nCS1 with
PBS-T 0.1%.
Filter the diluent using the 0.02µm syringe filters to remove any particulate
matter that could cause false-positive counts.
Dilute the EV samples 1:100 in the prepared PBS-T 0.1% buffer to align
with the sensitivity range of the TS-400 cartridge.
Load 7 µL of the diluted sample into the cartridge. Ensure the sample is
applied smoothly to prevent air bubbles, which can affect the measurement
accuracy
Start the measurement process. The nCS1 system will automatically adjust
the pressure and voltage settings to optimize the detection of particles
within the sample
Continue data acquisition until the standard error of the mean particle count
is less than 2%, indicating reliable data collection. This may require
continuous acquisitions over several minutes.
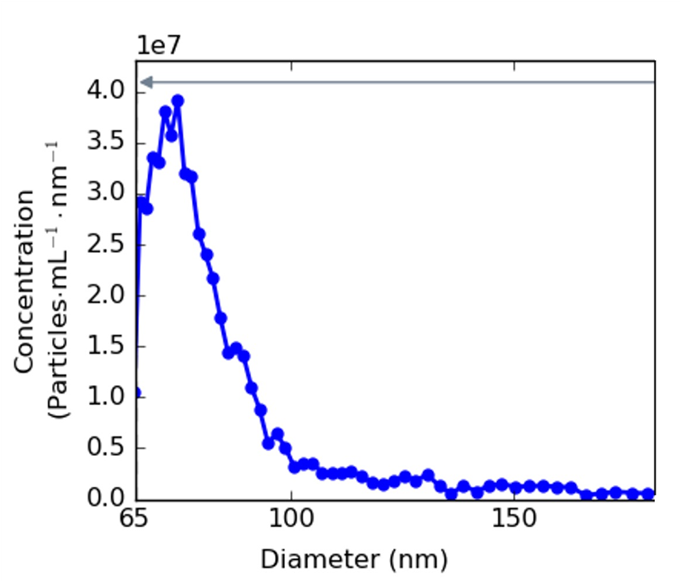
Upon completion of the measurements, the data collected are processed
using the nCS1 Data Viewer software.
Apply peak filters and perform background subtraction as directed by the
manufacturer to ensure accurate particle size distribution is obtained
(Figure 2).
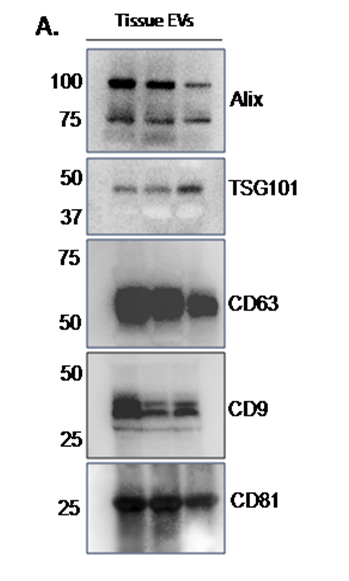
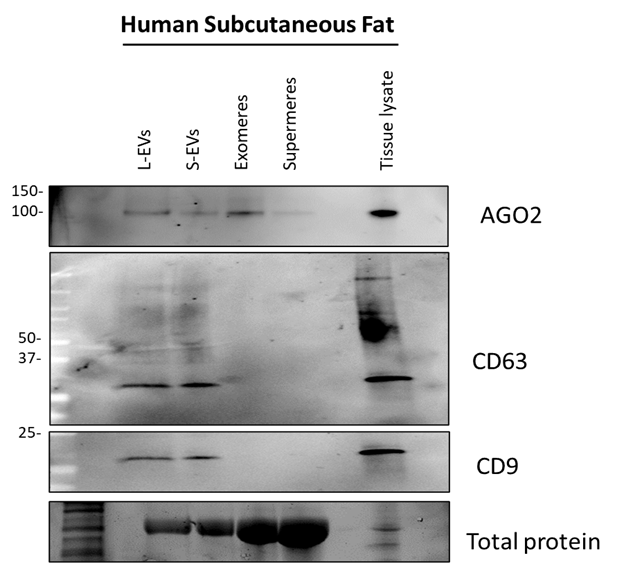
Immunoblotting to Characterize Extracellular Vesicles and NonVesicular Extracellular Particles
Lyse EVs and NVEPs purified using SEC or ultracentrifugation using 20 uL
of 10X RIPA buffer (fractions are collected on 200 uL of PBS-H) containing
protease and phosphatase inhibitors.
Wash membranes 3 times,10 minutes each in TBS-T shaking at RT.
Prepare the substrate working solution by mixing equal parts of the
Substrate and Stable Peroxide components. Use a sufficient volume to
ensure that the blot is covered with the substrate and the blot does not
become dry
Incubate the membrane with the substrate working solution for 5 minutes.
Image the blot on an iBright Imaging system (Figures 3 and 4).
To remove debris, centrifuge lysates at 14,000 xg for 15 minutes and
collect and store supernatants at -80°C (up to 6 months).
Prepare BSA standards, and store up to 2 weeks at 4°C.Conduct BCA
assay according to manufacturer’s instructions.
Prepare 30 μg of sample lysate diluted in 4x Laemmli sample buffer and
heat them at 95 °C for 5 min (closed cap, to avoid evaporation which might
reduce the load volume). Load protein ladder (5 μL) and 30 μg of samples
on 4–20% CriterTMon‱ TGX Stain-FTMee‱ precast gels
Perform electrophoresis at a constant 120 V for 1 h in 1x Tris/Glycine/SDS
running buffer
Following electrophoresis, transfer proteins onto PVDF membranes using
a Bio-Rad Trans-Blot Turbo Transfer System
. Block the membrane in TBS-T+5% BSA for 1h shaking at RT.
Incubate membranes with primary antibodies (15 mL- 1:1000, or other
optimized dilution) in TBS-T+5% BSA overnight shaking at 4°C.
Wash membranes 3 times in TBS-T (20 mL for 10 minutes shaking at RT.
Incubate membranes with secondary antibodies at optimized dilution
in TBS-T+5% BSA for 1 hour, shaking at RT
Notes
- We recommend using tissue as soon as possible after harvest to avoid cell death
which might interfere with the EV and NVEPs preparation
- It is critical to pay attention to the amount of medium/weight of sample to maintain
a constant ratio for consistency and reproducibility.
- It is critical to collect the culture supernatant without disturbing the pellet as the
pellet might have contaminating red blood cells.
- It is important to follow the manufacturer’s default settings for the Izon AFC.
- Ensure that the carousel alignment hole engages with the raised carousel alignment
pin on the carousel plate. Once the carousel has been loaded, the instrument will
pass through the column preparation steps before initiating the collection.
- Before starting the collection, all collection parameters should be reviewed properly
which include default buffer volume, position of fractions and volume of fractions to
be collected
- It is recommended to store the pellets in PBS-H to improve sample preservation 15
- Repeated-freeze thaw cycles can negatively affect samples. Therefore, the sample
should be aliquoted to avoid multiple freeze-thaw cycles.
- For vFC, the vFRed dilution/staining buffer and stock solution should be brought up
to room temperature before making the working solution of the 10X vFRed. Detailed
Notes for vFC, including Protocols for instrument calibration, sample preparation
and staining, flow cytometry, and data analysis are available on the Cellarcus web
site (www.cellarcus.com).
- Make a plate map for preparing the sample dilutions.
- Set the 200 μL multichannel pipette to 45 μL and mix the solution slowly for 4-
5 times. Do not fix the pipette to 50 μL (total reaction volume) because it may
introduce bubbles.
- After staining, a post-stain dilution is performed to reduce background from
unbound stain. For plate-based assays where well capacities are ~300 uL, the
1000X post-stain dilution is performed in two steps. After incubating the staining
mixture in dark conditions for 1 hour at room temperature, 8µL of staining mixture
is mixed with 237 µL of vFC staining/dilution buffer (Dilution-1). After pipette mixing
the contents of Dilution-1 well, 8µL of Dilution-1 is mixed with 237 µL of vFC
staining/dilution buffer (Dilution-2). Dilution-2 is read by the cytometer
- This protocol has been adapted for use with the CytoFlex instrument in the
authors’ lab. For other instruments, detailed protocols are available on the Cellarcus
web site (www.cellarcus.com).
- The CytoFlex cytometer acquisition settings are as follows:
Scatter gains (VSSC, SSC, and FSC) = 500
Active channels = All channels
Primary threshold =vFRed-H
Manual Threshold = 1900
Width parameter = vFRed (690/50)
Time to record = Checked, 120 seconds
Events to record = Unchecked
Events to display = 50,000
Sample flow rate = Fast (60 µL/min)
- The instrument setup Protocols (www.cellarcus.com) use calibration particles
to perform spectral and intensity calibrations, which are stored as “.comp” (spillover
and compensation matrices for the fluorophores being measured), “.cal”
(expressing fluorescence in units of molecules per particle), and “fcf” files (used for
calibration of EV size [surface area, diameter, etc], scattering cross-section, and
fluorophore surface density) which are loaded in the data analysis Layout to apply
these calibrations
- For Spectradyne analysis, in this protocol, we used a TS-400 cartridge. These
cartridges are designed for analyzing particles ranging from 65 to 400 nm, suitable
for small extracellular vesicles. If the EVs are collected via a different method and
thus may be larger in diameter, different cartridges are recommended (e.g., C900/TS-900 for 130-900 nm particle diameters, or C-2000/TS-2000 for 250-2000
nm particle diameters.
