In Silico analysis links the NSL complex to Parkinson’s disease and the mitochondria – Protein-protein interaction data to functional enrichment analysis
Katie Kelly, c.manzoni, Patrick Lewis, Helene Plun-Favreau
Parkinson’s disease
NSL complex
Mitophagy
In silico
Protein-protein interaction (PPI)
Mito-CORE network Interactome
ASAPCRN
Abstract
Whilst the majority (~90-95%) of PD cases are sporadic, much of our understanding of the pathophysiological basis of disease can be traced back to the study of rare, monogenic forms of disease. However, in the past decade, the availability of Genome-Wide Association Studies (GWAS) has facilitated a shift in focus, toward identifying common risk variants conferring an increased risk of developing PD across the population.
A recently developed mitophagy screening assay of GWAS candidates, has functionally implicated the non-specific lethal (NSL) complex, a chromatin remodeler, in the regulation of PINK1-mitophagy. Here, a bioinformatics approach has been taken to investigate the interactome of the NSL complex, to unpick its relevance to PD progression. The mitochondrial interactome of the NSL complex has been built, mining 3 separate repositories: PINOT, HIPPIE and MIST, for curated, literature-derived protein-protein interaction (PPI) data. A multi-layered approach has been taken to; i) build the ‘mitochondrial’ NSL interactome, applying PD gene-set enrichment analysis to explore the relevance of the NSL mitochondrial interactome to PD and, ii) build the PD-oriented NSL interactome, using functional enrichment, to uncover biological pathways underpinning the NSL /PD association.
Steps
Downloading the Protein-Protein Interaction (PPI) Data
All code can be found here : v1.0.0_W-PPI-NA_NSL
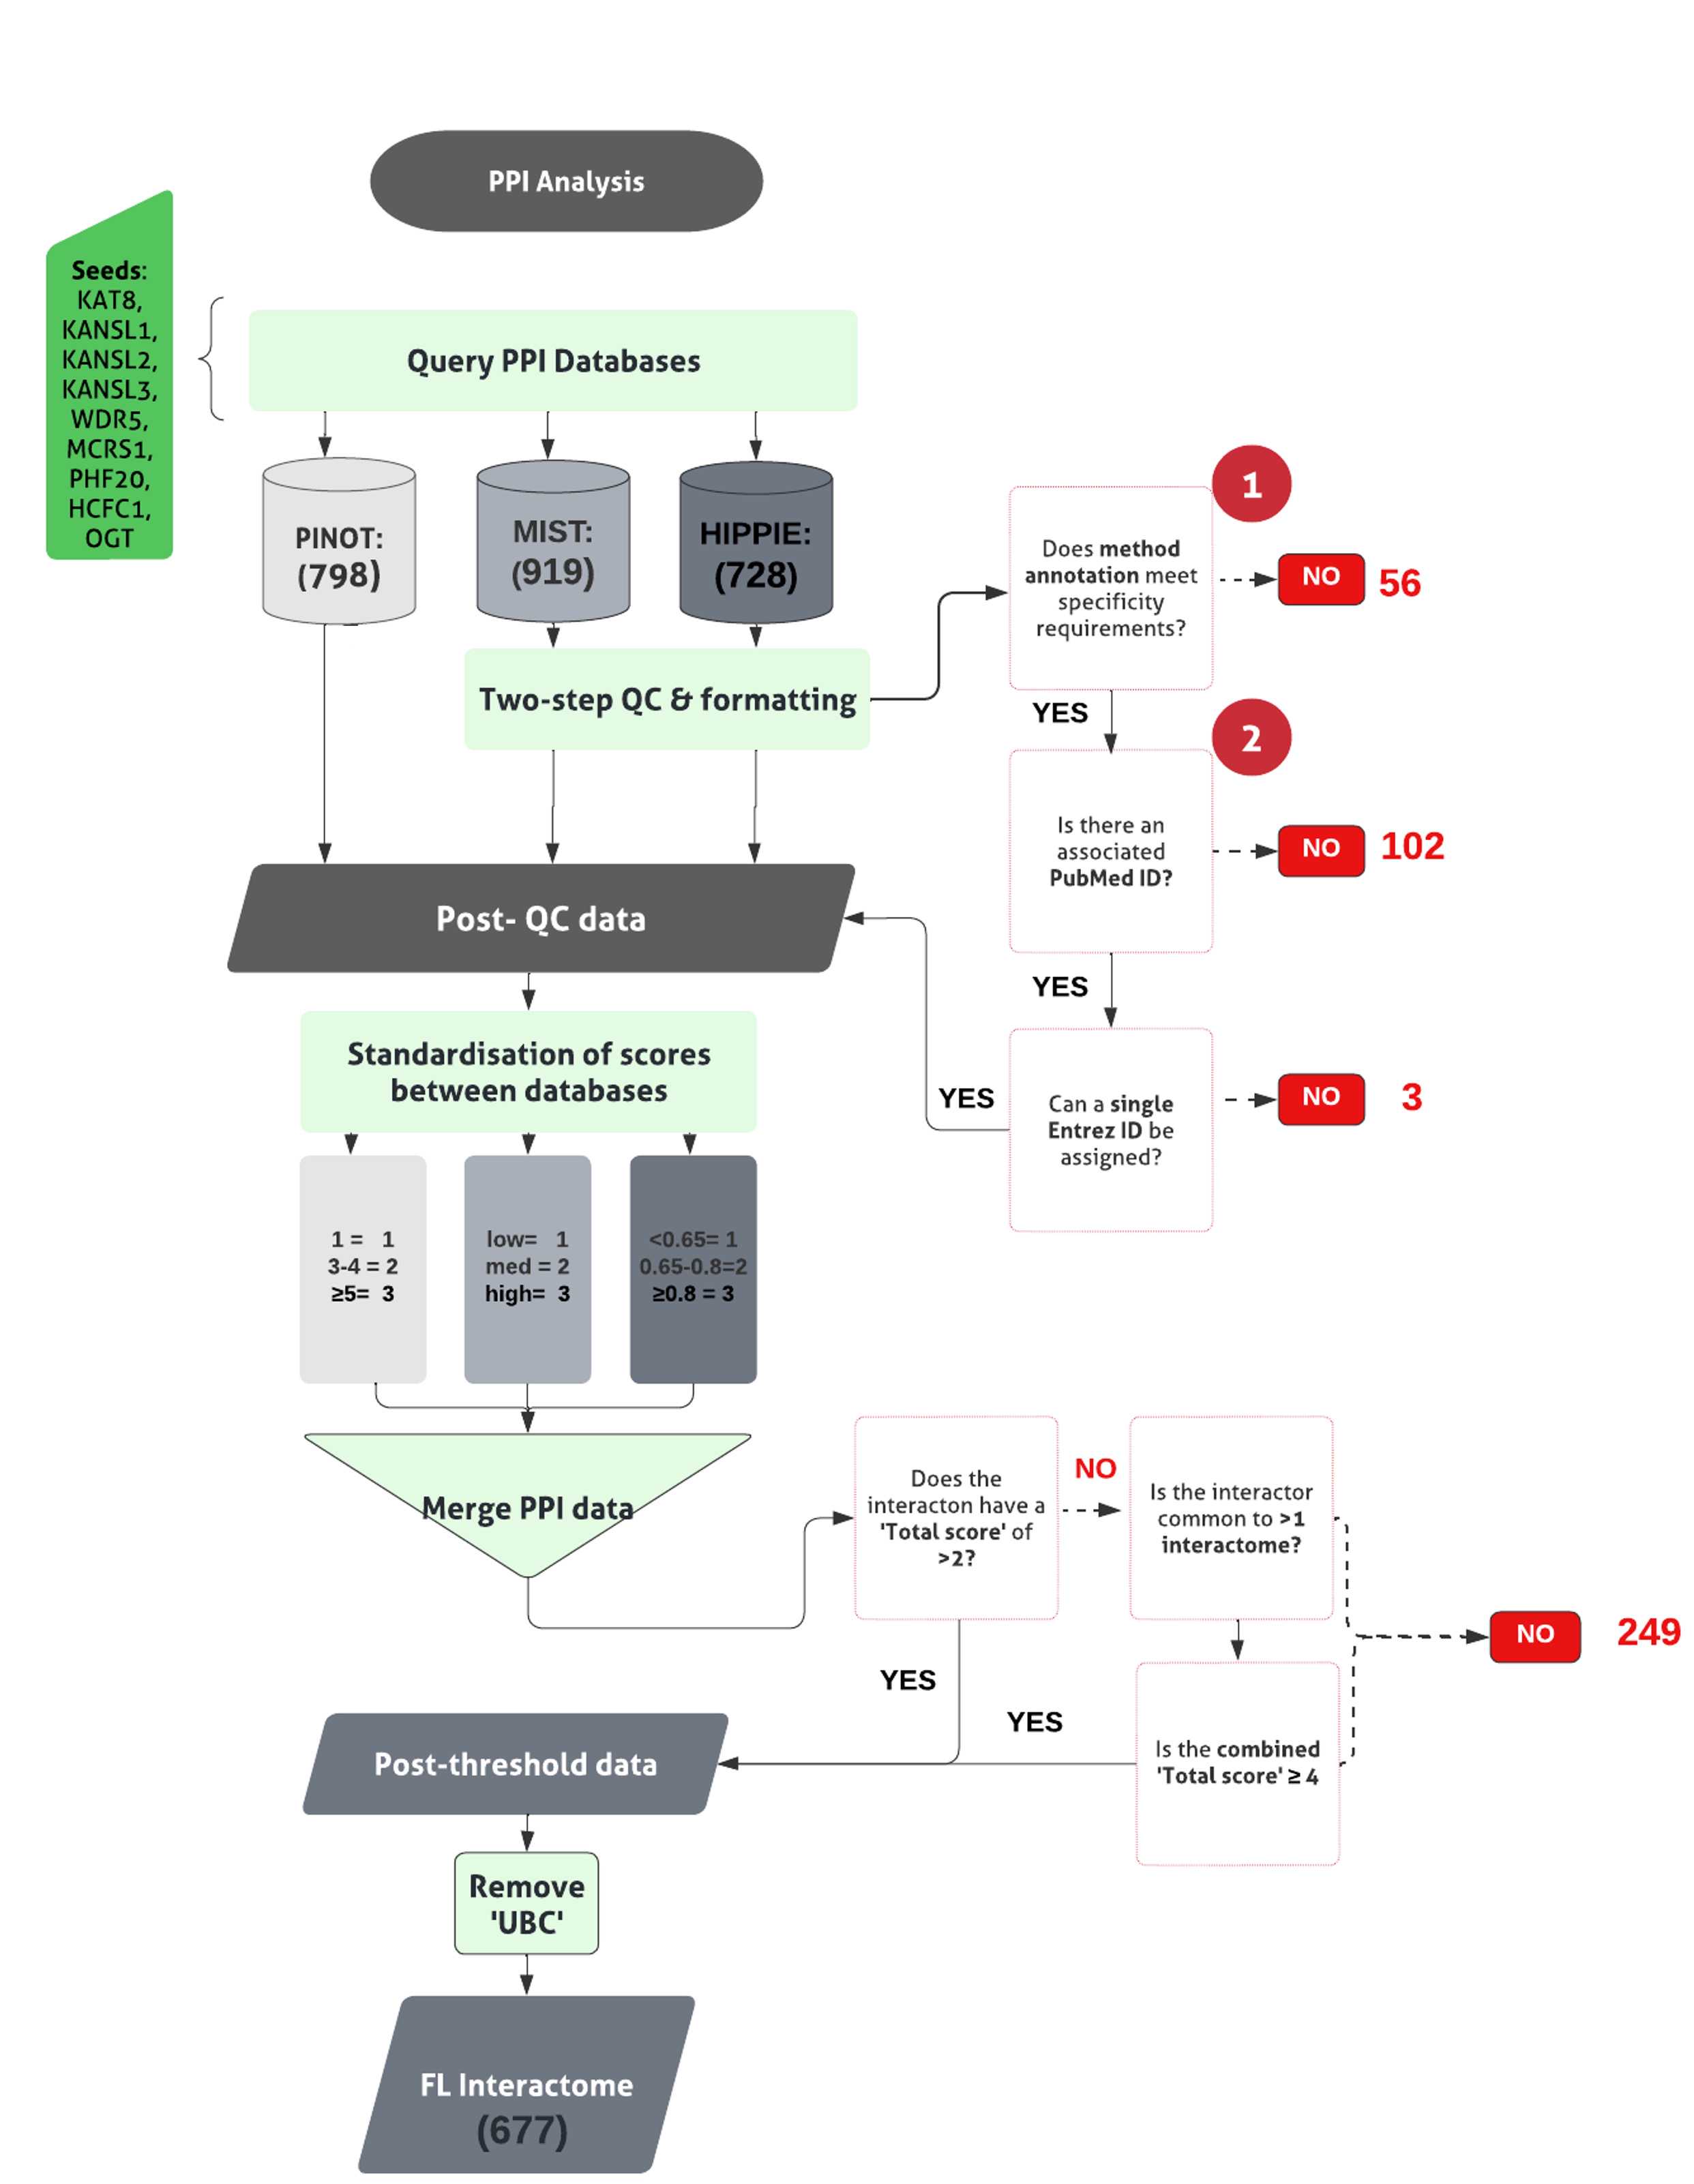
The pipeline to derive the first layer first layer interactome can be found in Figure 1.

Collect PPIs for NSL seeds using 3 different web-based tools;
-
PINOT (Version 1.1 with lenient filter option) (Protein Interaction Network Online Tool) (Tomkins, Ferrari et al. 2020, DOI: http://dx.doi.org/10.1186/s12964-020-00554-5)
-
HIPPIE with no threshold on interaction score (Human Integrated Protein-Protein Interaction rEference) (Alanis-Lobato, Andrade-Navarro et al. 2017 ; DOI: https://doi.org/10.1093/nar/gkw985; RRID:SCR_014651).
-
MIST v5.0 (Molecular Interaction Search Tool) (Hu, Vinayagam et al. 2018 ; DOI: 10.1093/nar/gkx1116).
PPI data obtained using MIST and HIPPIE are subjected to quality control (QC), QC steps 1 & 2 (already integrated within the PINOT pipeline) to remove low quality data.
Formatting between the output files is standardized and interactors’ IDs are converted to the approved EntrezID, UniprotID and HGNC gene name.
Where ‘UBC’, a ubiquitin moiety, is identified as an interactor within the first layer , review the supporting publication.
Where ‘UBC’, a ubiquitin moiety, is identified as an interactor within the first layer , review the supporting publication.
Merge interaction data, across the 3 databases to generate a single file for each seed’s interactome.
Merging and Thresholding the PPIs
Calculate the total score ( CST T) for each interaction the ( CST T) was calculated as:
Apply an arbitrary score threshold ( CST T>2), to filter and remove lower confidence PPI data lacking reproducibility.
Merge interaction data, across the 3 databases to generate a single file for each seed’s interactome. For each interactor the ( CST T) was calculated as:
If interactions that failed to meet the threshold, interrogate further, to identify those interactors bridging >1 interactome.
For those interactors appearing within >1 interactome, apply a multi-interactome threshold represented by a CST T≥ 4 across interactomes. Retain those meeting this multi-interactome threshold.
Combine all seed specific interaction lists, to obtain the first layer interactome.
Generate the list of unique interactors within the first layer interactome (code found in file 1.3. Standardisation of Score (GitHub) ).
Where ‘UBC’, a ubiquitin moiety, is identified as an interactor within the first layer , review the supporting publication. Unless the interaction being studied is specific, remove.
Generating the Mito-CORE Network
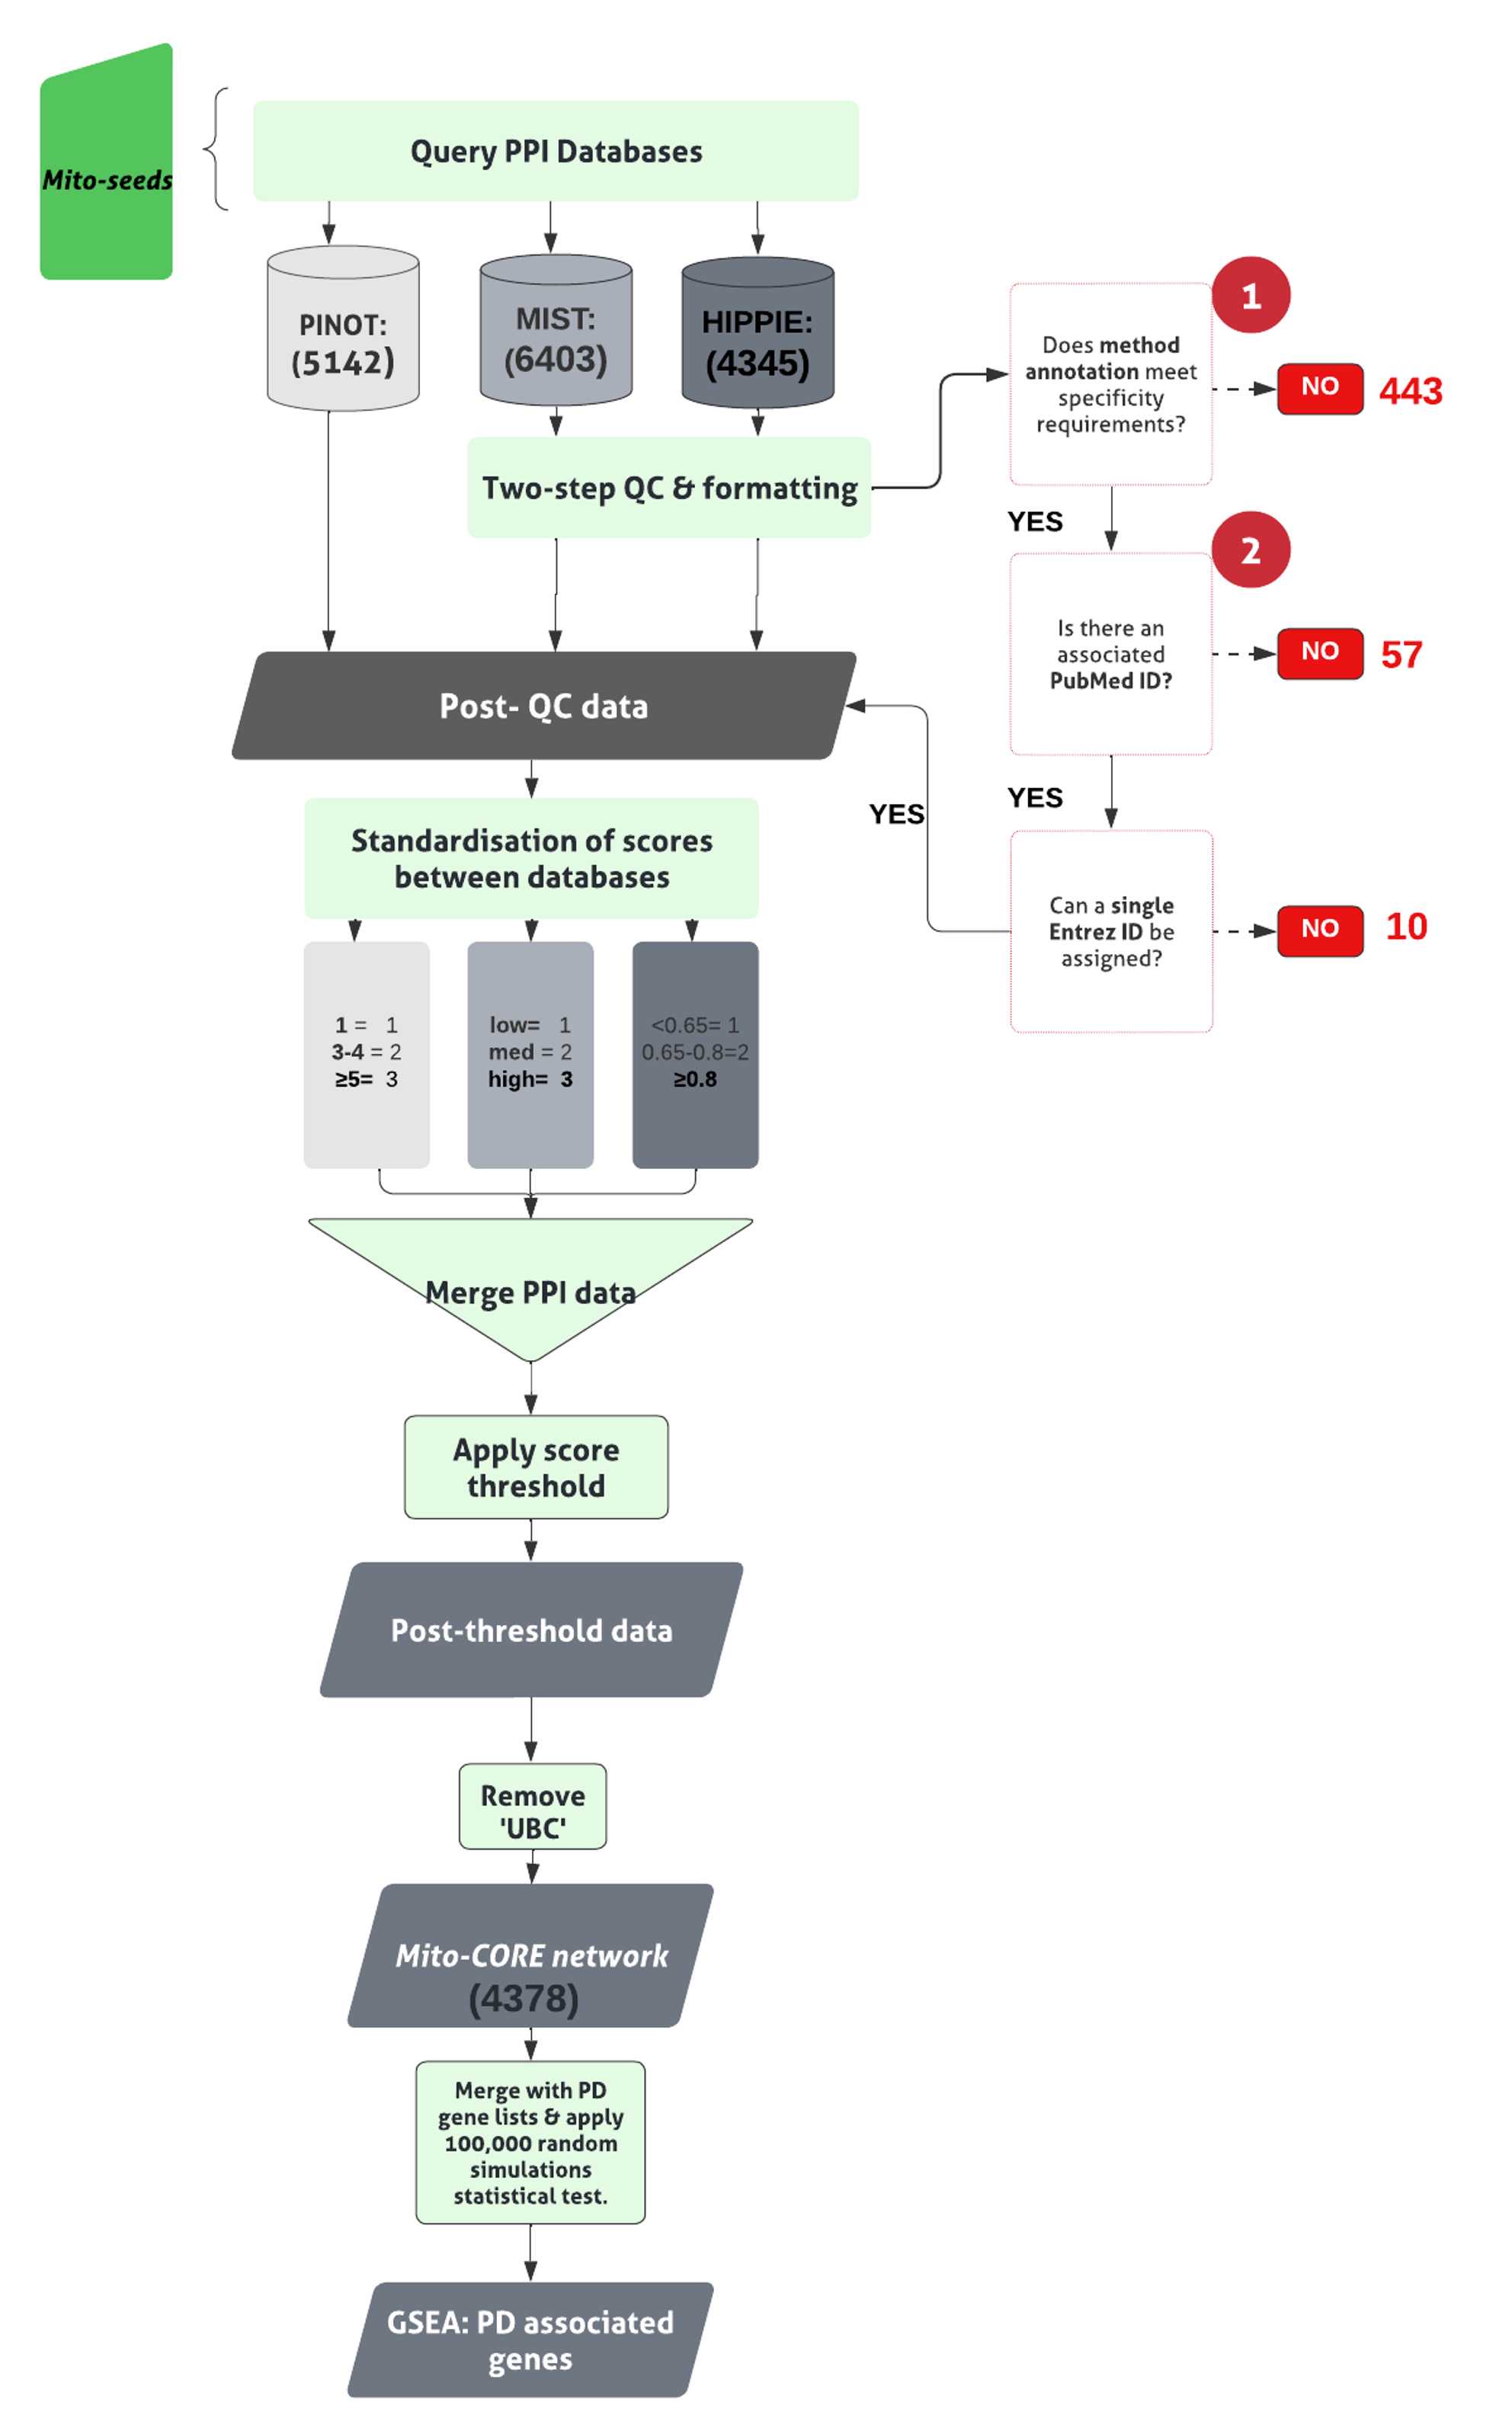
The pipeline to derive the Mito-CORE network can be found in Figure 2.

First, prioritise members of the first layer with mitochondrial annotation (- OGT, since it was a seed to derive the first layer interactome). Here, these are termed ‘ Mito seeds’.
Merge each list of mitochondrial proteins with the first layer interactome, to find overlaps. The overlaps represent members of the mitochondrial interactome for the NSL complex. (code found in file 1.5. Enrichment Analyses: Mitochondrial Proteins(GitHub) ).
Input mito seeds into all three PPI tools, to obtain the second layer . The NSL seeds together with the Mito seeds , and second layer interactors form the complete Mito-CORE network.
Gene Set Enrichment Analysis (GSEA)
Conduct GSEA for PD associated genes by comparing the members of the interactome under investigation ( first layer alone or complete Mito-CORE network) to a list of 180 unique PD associated genes;
Merge the list of 180 PD associated genes with the list of unique ( first layer / Mito-CORE network) interactors, to find overlaps between the two lists. The overlaps represent PD associated proteins within the direct interactome/mitochondrial interactome for the NSL complex (code found in file 1.6. Enrichment Analyses: PD-associated genes (GitHub) ).
Repeat the above step with the list of 15 Mendelian PD genes, to ascertain enrichment of this more stringent list.
Statistical Evaluation via Random Networks Simulation
Use an ‘100,000 random simulations’ test of significance to validate statistical significance of overlaps of PD genes with the first layer and complete Mito-CORE network (code found in file 100,000 Random Simulations testing (GitHub) ).
Generating the PD-CORE Network
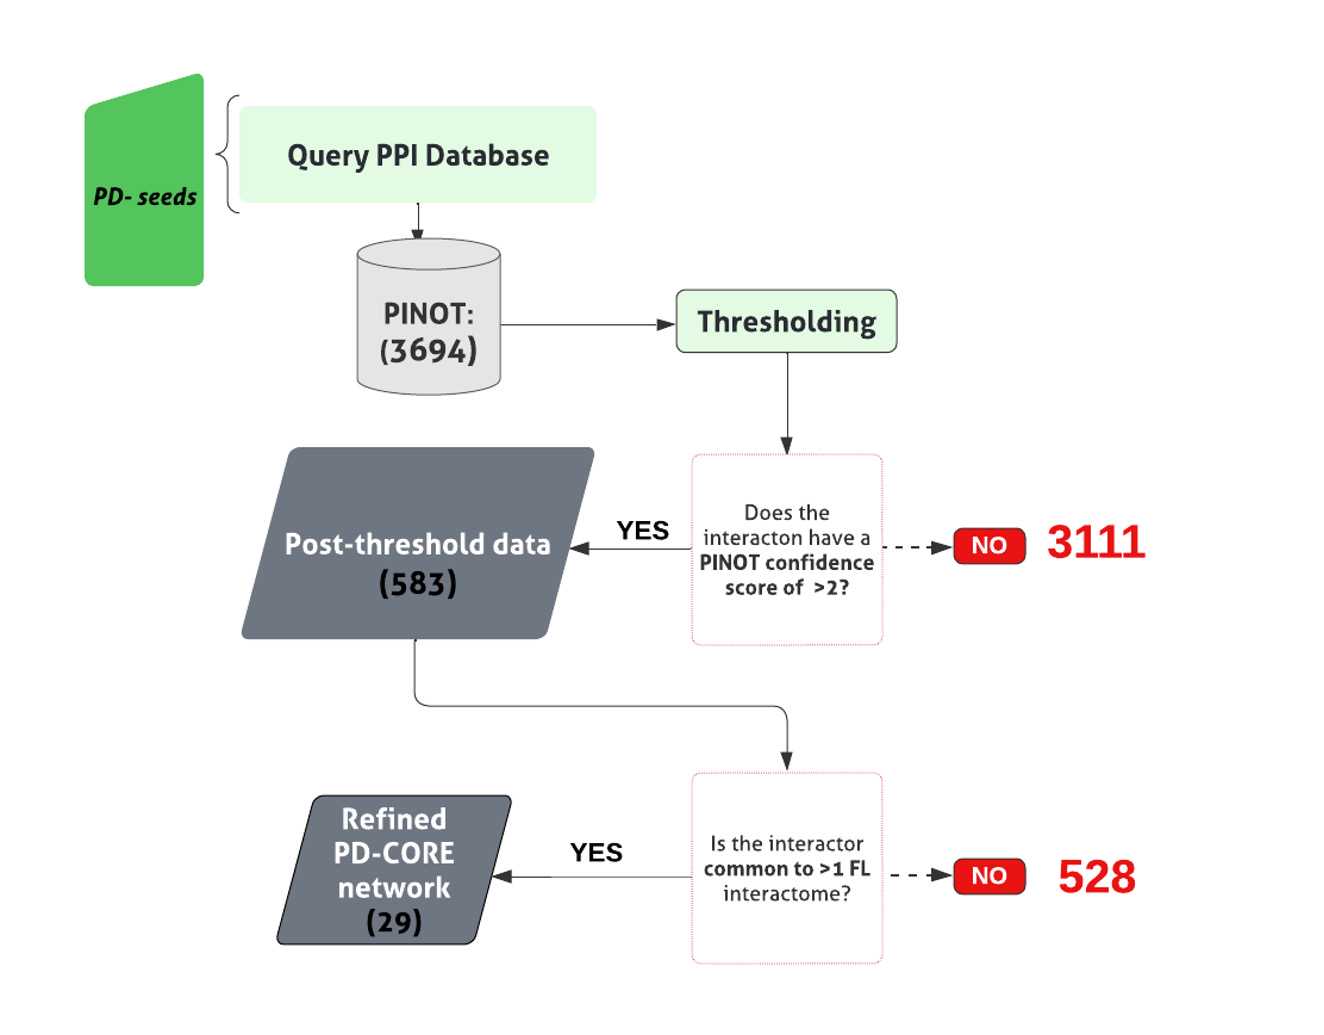
Apply an arbitrary confidence threshold of ' CSp >2', eliminating data with just a single publication and method from the downstream analysis (code found in file 1.7 Functional enrichment analysis (GitHub) .
Once again, convert interactors’ IDs to the approved EntrezID, UniprotID and HGNC gene name using the Gene dictionary .
Remove proteins with nonunivocal conversions to these 3 identifiers.
To remove background noise, keep only members of the second layer bridging >1 PD seed within the PD-CORE network.
The NSL seeds together with the PD seeds, and the non-private second layer interactors from the complete PD-CORE network .
Functional Enrichment Analysis
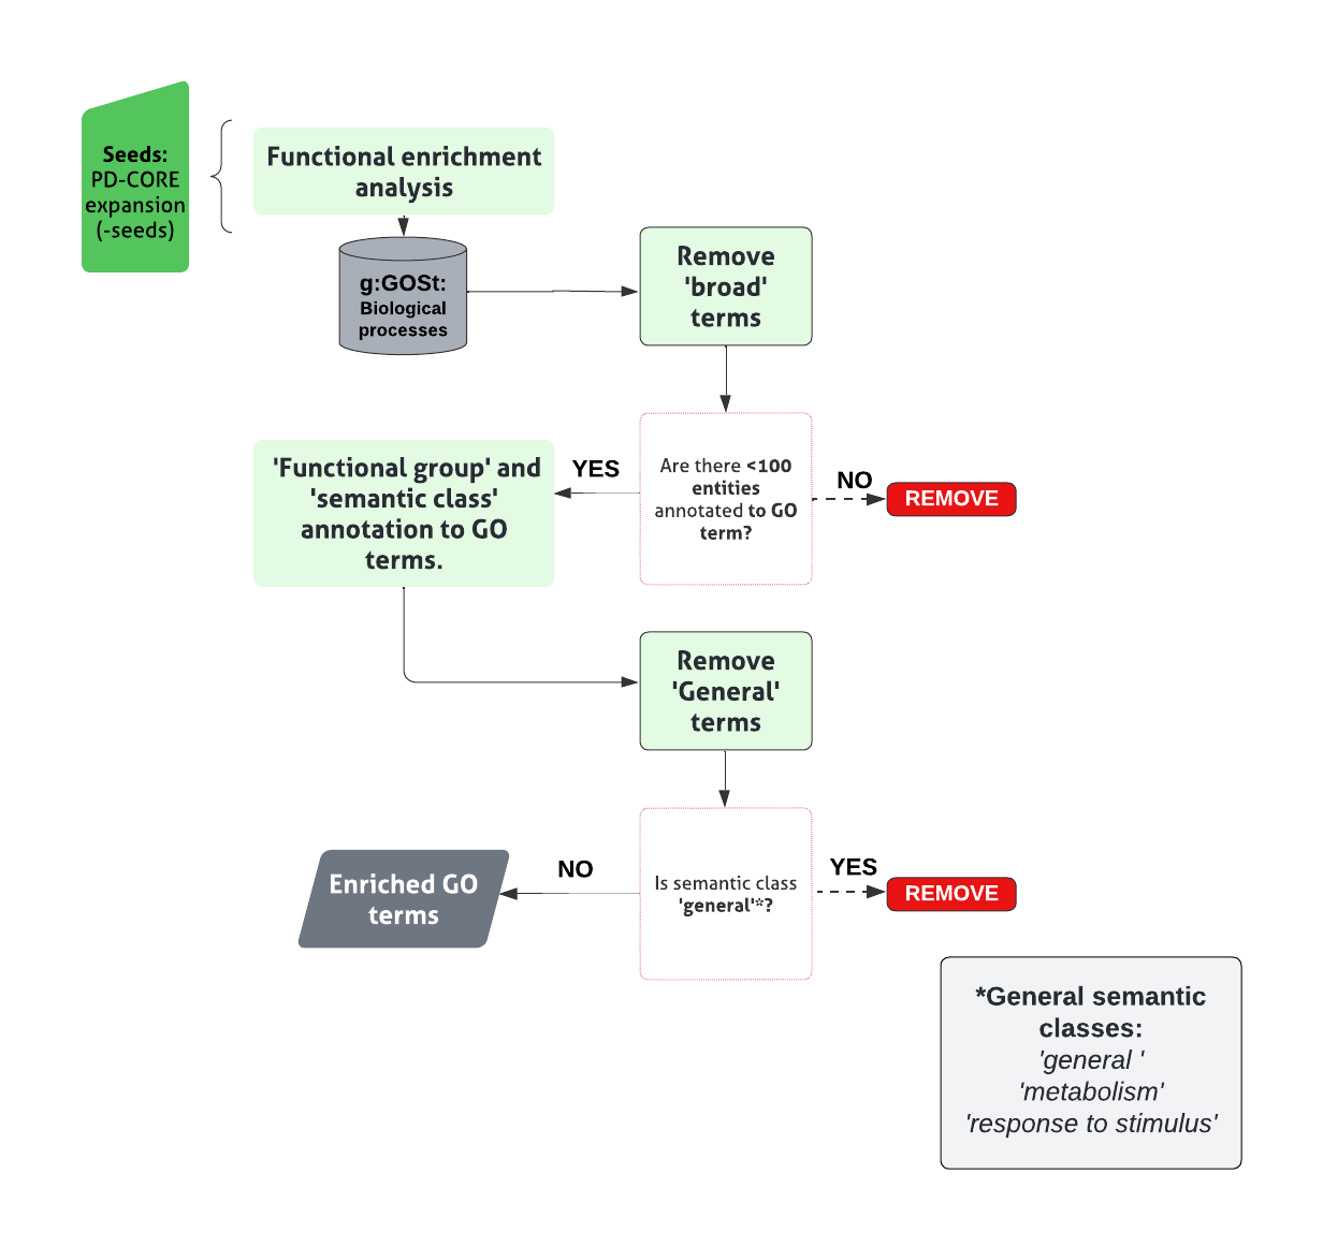
Assess enrichment of particular biological processes within the PD-CORE network, members (- NSL seeds), by inputting into the g:Profiler search tool, g:GOSt (G:Profiler ; Ashburner, Ball et al. 2000, Gene Ontology 2021; RRID:SCR_006809).
Conduct enrichment for GO terms associated with ‘Biological Processes (BPs)’ only, with all other analysis settings left unadjusted, generating a list of enriched GO:BP terms.
Apply a threshold to the list of enriched GO:BP terms, to retain those with term size <100 thus effectively removing ‘broad’ GO:BP terms. (code found in file 1.7 Functional enrichment analysis (GitHub) ).
Assign remaining terms to custom-made ‘semantic classes’(SC), accompanied by a parent ‘functional group’(FG).
Discard generic terms (classified in the semantic classes of: General , Metabolism, and Response to Stimulus) from further analysis.
Pool GO:BP terms contributing to each semantic class to identify the list of proteins within the network contributing to the enrichment of that specific semantic class.
The final list of semantic classes, within each functional group represents those enriched within the network.


