Identifying ZooMS Spectra (mammals) using mMass
Samantha Brown
Disclaimer
DISCLAIMER – FOR INFORMATIONAL PURPOSES ONLY; USE AT YOUR OWN RISK
This protocol was created as a training tool for students and researchers at the University of Tübingen. It is not designed to replace formal training and should not be treated as such. Please ensure that you correctly cite any of the tools/publications mentioned in this protocol.
Abstract
This is a guide to identifying ZooMS spectra for mammals using the open-source program mMass (Niedermeyer and Strohalm 2012). This guide is intended as a learning tool for students and researchers at the University of Tubingen and is not meant to replace formal ZooMS marker training.
If you use this guide to analyse your ZooMS spectra or to convert your data into an open-source format, please cite this document.
For further information contact Dr. Samantha Brown (samantha.brown (at) uni-tuebingen.de)
Before start
There are several resources available to you in identifying your ZooMS spectra. Each of these resources will be described within the protocol but here are the links to each:
Download mMass: https://github.com/dreamingspires/mMass/releases
Convert your spectra into a compatible format: Convert Bruker Flex.pdf
An online database of published ZooMS peptide markers can be accessed through the University of York: https://www.york.ac.uk/archaeology/centres-facilities/bioarch/facilities/zooms/
Example of a results database: Example Results Template.xlsx
Steps
Before you start
In this guide, you will learn the basics of identifying ZooMS spectra. This guide is based on using the nine ZooMS peptide markers (hereafter referred to as "markers") listed in Welker et al., 2016. There are several new markers that have since been published for certain taxa, however, we recommend initially identifying these nine markers and then seeking additional ones to make more specific identifications.
The names of markers follow the conventions set out in Buckley et al., 2009; Welker et al., 2016 and Brown et al., 2021. We recommend that in a publication you strictly follow the naming convention from Brown et al., 2021 for clarity.
mMass is a program commonly used for analysing ZooMS spectra. Additionally, mMass is free and open-source. The latest source code can be found here: https://github.com/dreamingspires/mMass/releases.
This guide is based on using mMass to analyse your spectra on a PC (but the basic principles can be followed for all programs and can be altered slightly for use on a Mac). This guide is not intended to give you a comprehensive overview of all of the functions within mMass but it will give you the basics to begin looking at your ZooMS spectra.
(Citations for mMass can be found at the end of this document and should be included in any publication which uses the program for data analysis.)
Converting your data
Your data will need to be converted into a format compatible with mMass. There are two file formats that are compatible with mMass, .txt and .mzml
Specific instructions for converting data from Bruker Flex format into .mzml format using R can be found here:
Importing your data
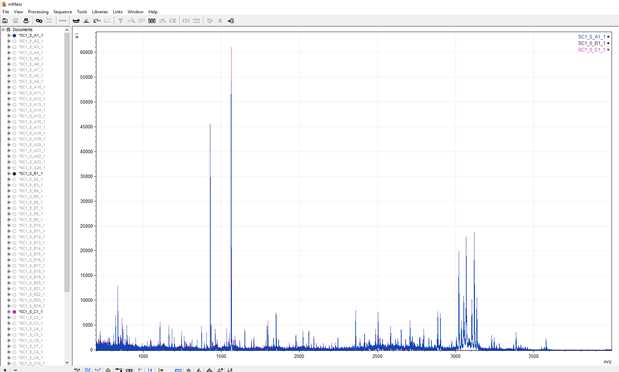
Once mMass is installed you can open the program and get familiar with the menus and processing options. The image below displays how mMass should look when you first open it.

The program has three main panels. The one to the far left displays all of the open files, the central panel is the viewing screen for your spectra, and the panel on the right displays all of the identified markers after Peak Picking has been carried out (see step 10). Here is an example of what the screen will look like when you have loaded your ZooMS spectra.

You can open your files by going to:
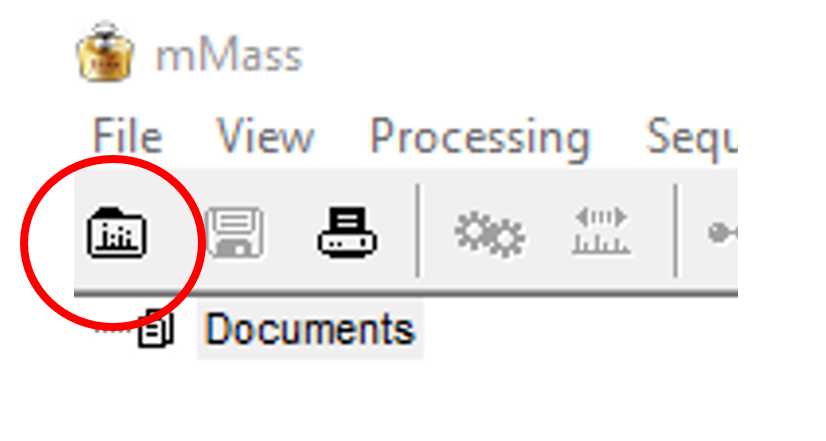
File -> Open
or click the "Open Document" button shown in the image below
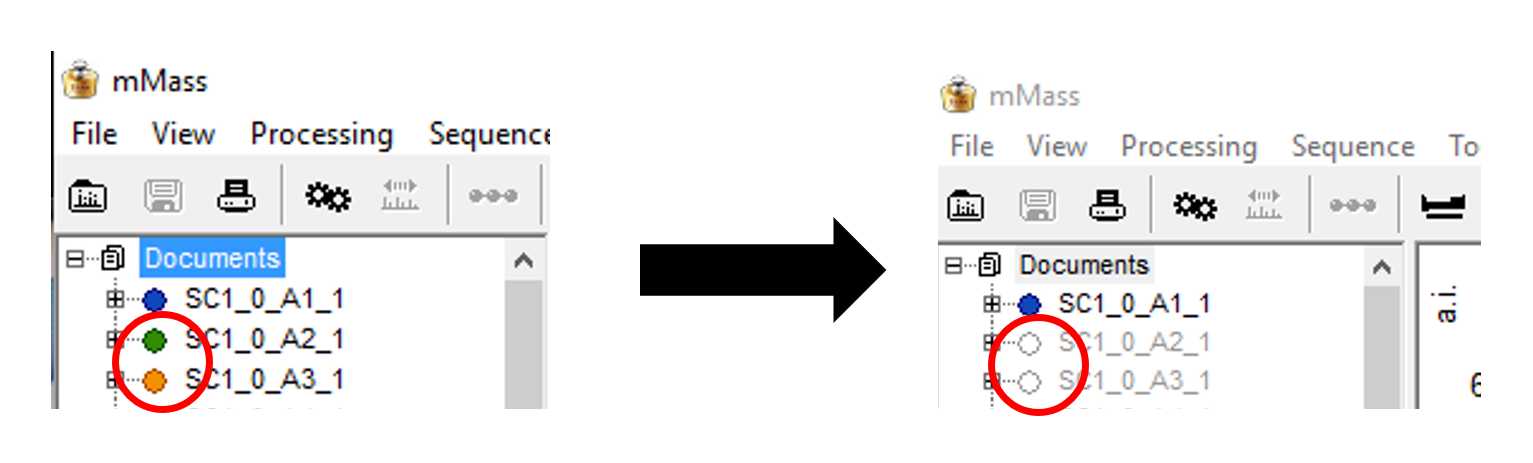
Once all of your spectra have been loaded (beware of opening too many files at once), deselect those you are not immediately interested in viewing by clicking the buttons next to their file names. You can also hold “shift” and click one of the bubbles to deselect everything currently selected.
Processing your data
Your data may benefit from processing prior to analysis. Processing with mMass includes Baseline Correction, Smoothing, and Peak Picking
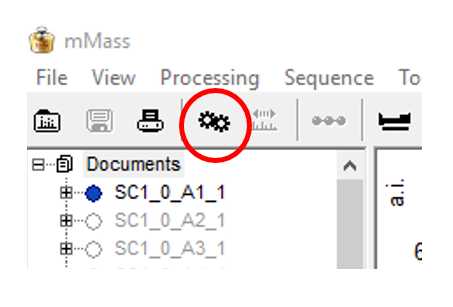
Data Processing options are found either by following Processing -> Batch Processing or by pressing the button shown below
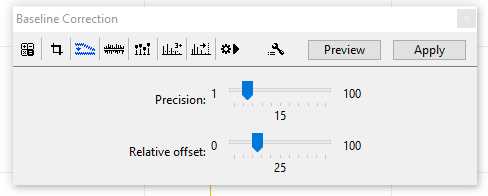
Baseline Correction:
Default parameters for Baseline Correction are usually sufficient.
Precision: 15
Relative offset: 25
Changes in the parameters for the Baseline Correction should be reported when your data is published. The Baseline Correction menu is shown here in the figure below, you can press the "Apply" button to make changes to a single selected sample. If you would like to apply a Baseline Correction to multiple samples set your parameters now and follow the batch processing instructions in Step 10.
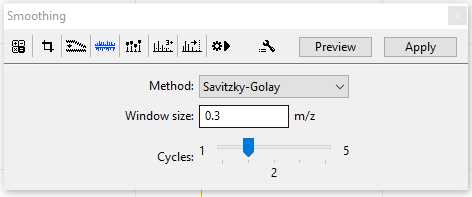
Smoothing:
Default parameters for Smoothing are usually sufficient.
Method: Savitzky-Golay
Window size: offset: 0.3 m/z
Cycles: 2
Changes in the parameters for the Smothing should be reported when your data is published. The Smoothing menu is shown here in the figure below, you can press the "Apply" button to make changes to a single selected sample. If you would like to apply Smoothing to multiple samples set your parameters now and follow the batch processing instructions in Step 11.
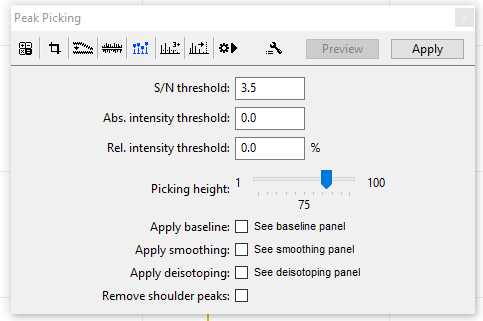
Peak Picking:
Typically a signal-noise (S/N) threshold of 3.5 will sufficiently differentiate between your baseline and actual markers in your sample. An example of the Peak Picking menu is shown here in the figure below, you can press the "Apply" button to make changes to a single selected sample. If you would like to apply Peak Picking to multiple samples set your parameters now and follow the batch processing instructions in Step 11.
The parameters for your Pick Peaking should be included when your markers and ZooMS identifications are published/reported.
Batch Processing:
Once your parameters have been set, you can apply them to multiple samples at once. Select the button shown below in the "Batch Processing" window and select each of the samples you wish to process. You can select all of the samples by clicking on the top sample and holding shift-click on the final sample.
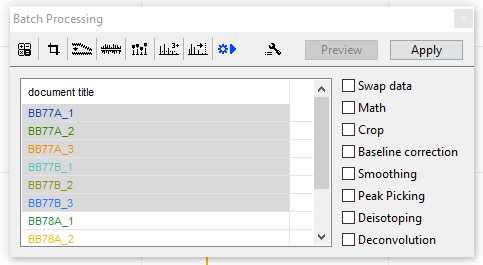
Check the processes you would like to run and then press" Apply"
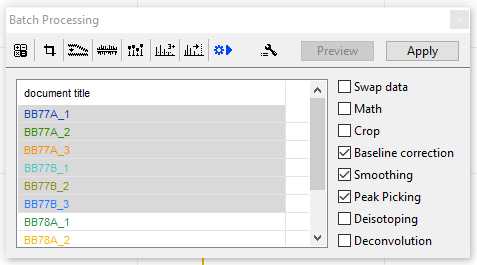
This may take up to 10-15 minutes depending on the number of samples being processed. You may speed this up by only applying one process at a time. Once completed close the "Batch Processing" window and continue with Step 12.
Recording your results
Your results file should include information on the position of the spotted sample on the MALDI plate, the markers used to make the identification, and your resulting ZooMS identification. Attached is an example of how to arrange your results. Note that in the example shown, a new line is used to record the markers for each replicate of your sample. In this example, the same sample was spotted three times on the MALDI plate on positions A01, C01, and E01. Example Results Template.xlsx
Making the IDs
Now that your data has been processed and you have prepared your results file, you are ready to begin identifying your spectra.
Select your first set of replicates, ie. all of the locations which have the same sample spotted, by selecting the small circles alongside their file names. They should fill with a colour that matches their spectra on the viewing screen. The replicates will overlay one another so you can easily see if there are differences in the recorded masses, allowing for quick identification of contamination or issues with the spotting of samples.
IDs are made by comparing these spectra with a reference library. As you become more confident with IDing spectra it is easiest to start identifying the peptides sequentially. In the meantime, there are some shortcuts to make life easier.
Currently, the most up-to-date and the only online database is housed by the University of York. You can access the database here: https://www.york.ac.uk/archaeology/centres-facilities/bioarch/facilities/zooms/
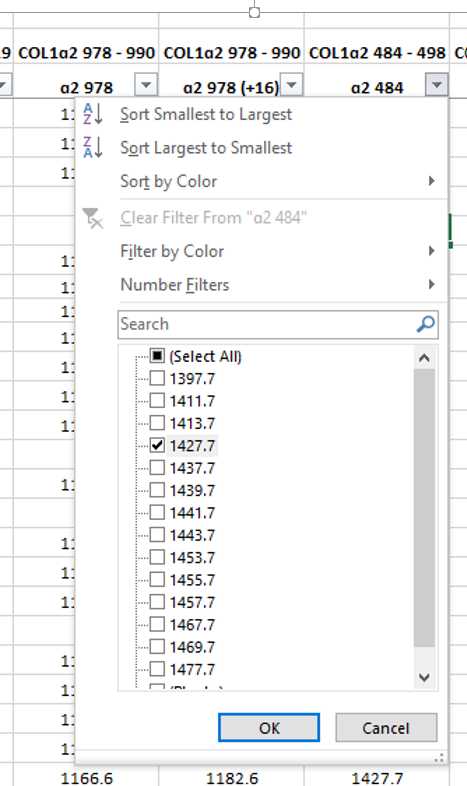
Locate your COL1ɑ2 484–498 (B) marker.
When referring to the reference library you will see that the most common values for the B peptide are m/z 1427 and 1453, and almost all are located within the m/z 1400 range.
You can zoom in on the m/z 1400 range in mMass by right-clicking and dragging along the section of spectra you are interested in.
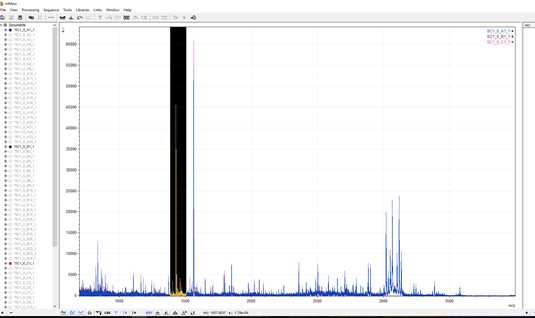
Upon releasing your mouse you will be zoomed in on the section of interest. As you can see in the example below, there are several peaks within this range. Many of these peaks are non-diagnostic and now it is a matter of examining each to see which matches the reference library.
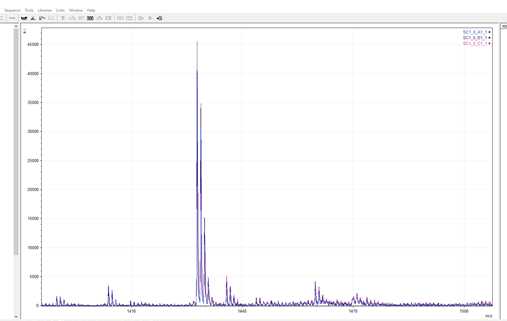
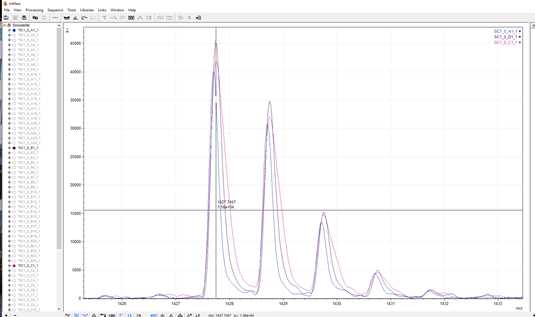
In this example, the most dominant peak and the only one to match to the reference library is m/z 1427.7
Record the COL1ɑ2 484–498 in your results file as m/z 1427.7 and refine your reference library to include only species which carry the matching marker.
Identifying COL1ɑ2 793–816 (D) marker
The COL1ɑ2 793–816 marker will also drastically reduce the number of potential species your sample may match to. All markers are located within the m/z 2100 range, with the most common being at m/z 2131 and 2145.
By zooming in on this example, you can see that m/z 2145.1 is the most prominent marker and the only one to match other markers present within the reference library.
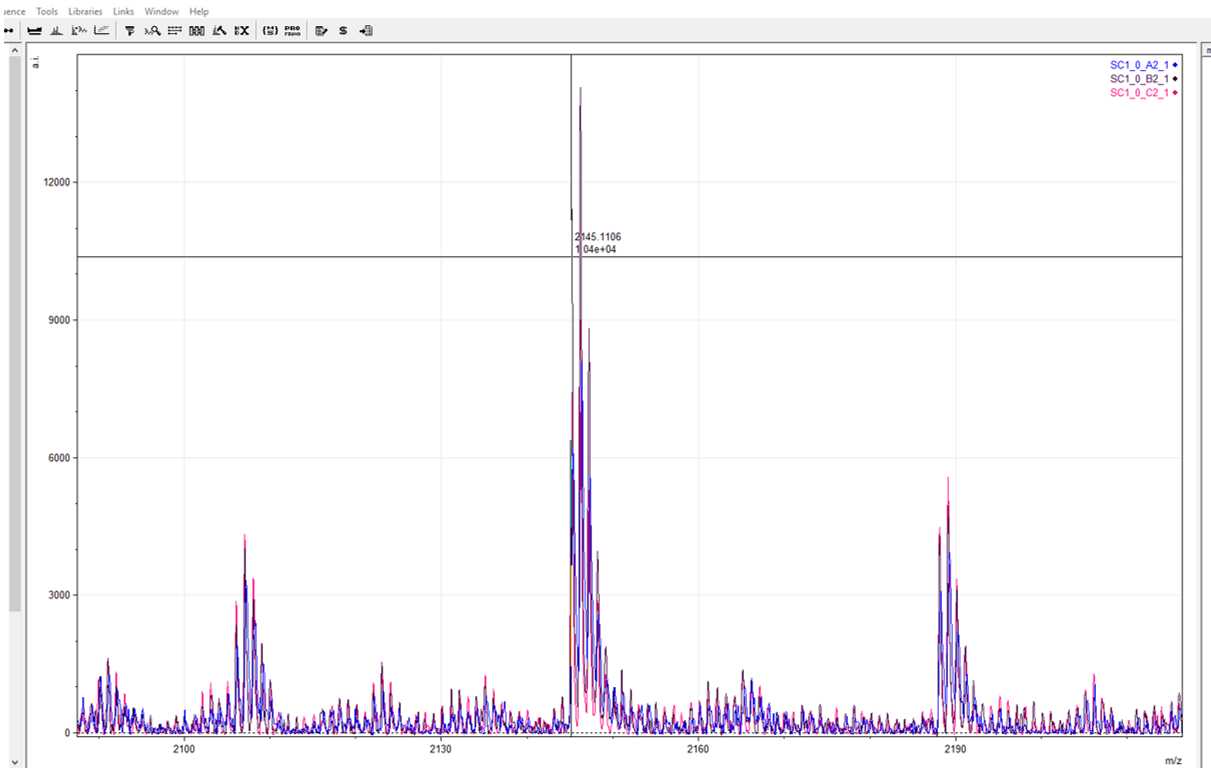
Record m/z 2145.1 as your COL1ɑ2 793–816 marker and filter your reference library accordingly.
In this example, the combination of m/z 1427.7 and 2145.1 has already filtered the reference library down considerably and it appears most likely that this sample is an Equidae. It is now a matter of going through to find the remaining matching markers to confirm this identification.
Further tips for identifying other ZooMS markers
Oxidative pairs:
You will see in the reference library that some of the peptides come in pairs (ie. COL1ɑ2 978–990 and COL1ɑ2 978–990’). These markers represent the same peptide that has undergone a mass shift as a result of oxidation.
These markers should always match, for instance, a m/z 1180 marker should be accompanied by a m/z 1196 marker. If one of them is missing that is normal but if one of them does not fit into a matching pair this could be a sign of contamination or degradation and should not be considered a reliable marker.

Mass shifts:
Small mass shifts may occur as a result of protein degradation which will cause your markers to shift by as much as m/z 1 (i.e. a result of 1428.6 instead of 1427.7). This is normal and can be recorded in your results table as being reliable.
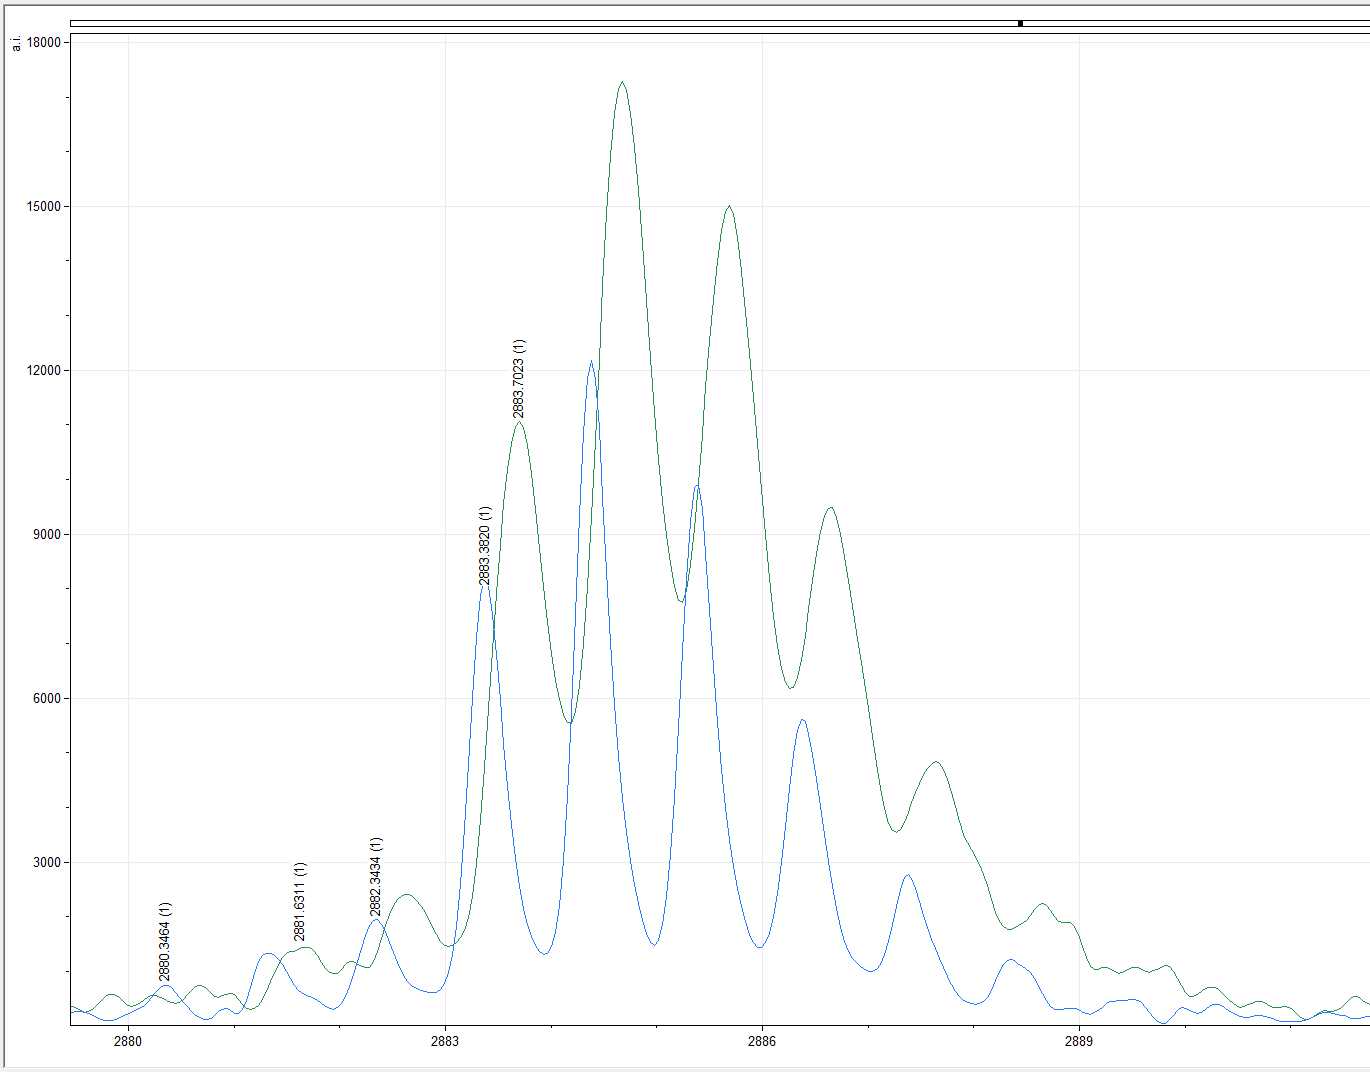
For instance, in the example below the blue spectra shows m/z 2883.3 which is the expected marker for COL1ɑ1 586 - 618 (F). However, in the green example the spectra shows the same marker at m/z 2883.7. Since the shift is no more than m/z 1 the marker in the green example can be reliably recorded in your results table.
Identifying COL1ɑ2 978–990 (A) markers:
These can often be the most difficult to identify and can be left until last especially as you are learning.
Identifying COL1ɑ2 502–519 (C) markers:
Unfortunately, these are important in distinguishing between closely related groups like Equidae and Cervidae but often suffer the worst from collagen degradation. Changes to the protocol can be made in order to make these clearer if necessary, including diluting your sample.
Identifying COL1ɑ2 454–483 (E) markers:
These are the first to be lost as part of collagen degradation and are often the hardest to identify. Don’t be surprised if you have trouble identifying them.
Identifying COL1ɑ2 757–789 (G) markers:
Collagen and keratin both show a value at m/z 3017 so beware of this marker. It will often appear unexpectedly in things like Capra, Elephantidae, etc. If you are basing your entire confirmation for something like Ovis on the presence of m/z 3017 (but not its companion m/z 3033) then you are most likely making an unreliable ID and it should be recorded as Ovis/Capra.
For a greater discussion on this, see Janzen et al., 2021.
Exporting your spectrum as an image
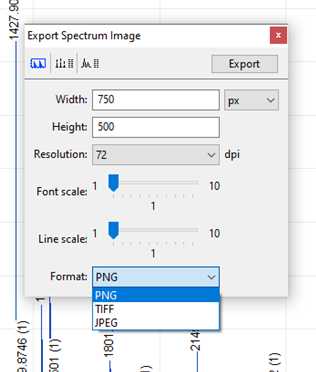
Finally, you can export your spectra as an image for publication or presentation. To do so, make sure your spectrum on-screen appears the way you would like it to in an image and go to:
File -> Export.
Ensure the resolution and scale are set as desired and choose the format you'd like the image to be exported as, either PNG, TIFF, or JPEG. Once your parameters are set press "Export" and choose your save location.
References
Buckley, M., Collins, M., Thomas-Oates, J., Wilson, J.C., 2009. Species identification by analysis of bone collagen using matrix-assisted laser desorption/ionisation time-of-flight mass spectrometry. Rapid Commun. Mass Spectrom. 23, 3843–3854.
Brown, S., Douka, K., Collins, M.J., Richter, K.K., 2021. On the standardization of ZooMS nomenclature. J. Proteomics 235, 104041.
Janzen, A., Richter, K.K., Mwebi, O., Brown, S., Onduso, V., Gatwiri, F., Ndiema, E., Katongo, M., Goldstein, S.T., Douka, K., Boivin, N., 2021. Distinguishing African bovids using Zooarchaeology by Mass Spectrometry (ZooMS): New peptide markers and insights into Iron Age economies in Zambia. PLoS One 16, e0251061.
Niedermeyer, T.H.J., Strohalm, M., 2012. mMass as a software tool for the annotation of cyclic peptide tandem mass spectra. PLoS One 7, e44913.
Strohalm, M., Hassman, M., Kosata, B., Kodícek, M., 2008. mMass data miner: an open source alternative for mass spectrometric data analysis. Rapid Commun. Mass Spectrom. 22, 905–908.
Strohalm, M., Kavan, D., Novák, P., Volný, M., Havlícek, V., 2010. mMass 3: a cross-platform software environment for precise analysis of mass spectrometric data. Anal. Chem. 82, 4648–4651.
Welker, F., Hajdinjak, M., Talamo, S., Jaouen, K., Dannemann, M., David, F., Julien, M., Meyer, M., Kelso, J., Barnes, I., Brace, S., Kamminga, P., Fischer, R., Kessler, B.M., Stewart, J.R., Pääbo, S., Collins, M.J., Hublin, J.-J., 2016. Palaeoproteomic evidence identifies archaic hominins associated with the Châtelperronian at the Grotte du Renne. Proc. Natl. Acad. Sci. U. S. A. 113, 11162–11167.
