High-throughput physiological profiling of endosymbiotic dinoflagellates (Symbiodiniaceae) using flow cytometry
Colin J Anthony, Colin Lock, Bastian Bentlage
flow cytometry
autofluorescence
photopigment
photophysiology
dinoflagellate
Symbiodiniaceae
coral
Cnidaria
symbiosis
Symbiodinium
peridinin
chlorophyll
flavin
fluorescence
Abstract
This protocol quantifies light-harvesting complex (LHC) and antioxidant pigments, while simultaneously determining cell density of endosymbiotic dinoflagellates using the Guava Flow Cytometer. Red fluorescence excited by a blue laser represents peridinin, while the red fluorescence excited by the red laser represents both chlorophyll a and chlorophyll c2 2 . Additionally, green fluorescence off of the blue excitation laser target antioxidant-associated pigments (diadinoxanthin, diatoxanthin, beta-carotene, and flavin-based fluorescent proteins). As flow cytometry continues to gain traction as a robust cell counting methodology, the integration and expansion of this protocol into coral or micro-algal workflows will serve as a valuable tool to quantify the physiology of single photosymbiotic cells in-hospite .
Before start
Ensure filtered seawater (FSW) is fresh
Heat SDS solution with benchtop shaking incubator to resuspend salt 180rpm
- 50 mL SDS solution = 7 mL FSW + 43 mL DI + 0.04 g SDS
Clean the flow cytometer before and after each use
- GuavaSoft 4.0 uses Guava Clean 3.4, which walks you through cleaning process
- Two pre-cleans is helpful and if the machine sat over the weekend, cleaning the capillary is also necessary
- Throw out waste bottle and make sure other bottle has at least ⅔ ICS
Verify proper instrument calibration and gain settings with easyCheck and CountBright fluorescent beads
- Once the protocol has been implemented locally, use fluorescent beads to verify that fluorescent readings are consistent. Set up a worklist with bins that show the expected location of each fluorescent bead. This file is used to periodically check cytometry calibration.
- Periodically before collecting data (every 1-3 months), fill a single well with 1uL of fluorescent beads. Run the cytometer, and while it is running, verify that fluorescent beads are within the expected bin, if not, adjust the gain settings to put fluorescent readings within your predefined gates.
- Reagents and instructions come with easyCheck kit.
Clean air brush and make sure needle is still present*
Chill centrifuge 5000rcf,0°C,0h 0m 0s
Fill cooler with ice
Locate samples and label all tubes (50 mL falcon tubes* and 1.5 mL screw top tubes)
Steps
Sample Preservation
Sample tissue from cnidarian
- If calcifying coral, we suggest 3 pieces at around 2 cm3 sampled with wire cutters or hammer and chisel
- If gelatinous cnidarian, 0.05 - 0.1 g of tissue sampled with sterile scissors works well
Store tissue in bag or tube
- For calcifiers, Whirl-Pak sample bags work well
- For gelatinous cnidarians, 1.5 mL screw top tubes are more effective (this allows for immediate processing when ready)
Flash-freeze tissue in Cryogenic storage Dewar flask with LN2 -320°C
- Store samples in ultra low freezer
-80°Cfor extended preservation
Sample Preparation
Before Start:
Ensure filtered seawater (FSW) is fresh (~1 L of filtered seawater is sufficient)
Heat SDS solution with benchtop shaking incubator to resuspend salt 180rpm
- 50 mL SDS solution = 7 mL FSW + 43 mL DI + 0.04 g SDS
- Make sure solution cools to ambient temperature before use
Clean the flow cytometer before and after each use
- GuavaSoft 4.0 uses Guava Clean 3.4, which walks you through cleaning process
- Two pre-cleans is helpful and if the machine sat over the weekend, cleaning the capillary is also necessary
- Throw out waste in waste bottle and make sure other bottle has at least ⅔ ICS
easyCheck may also be necessary if machine has sat for more than a week
- reagents and instructions come with easyCheck kit
Verify proper instrument calibration and gain settings with CountBright fluorescent beads
- Once the protocol has been implemented locally, use fluorescent beads to verify that fluorescent readings are consistent. Set up a worklist with preset bins that show the expected location of each fluorescent bead. (This is the same binning process used to bin Symbiodiniaceae cellular populations)
- Periodically before collecting data (every 1-3 months), fill a single well with 1uL of fluorescent beads. Run the cytometer, and while it is running, verify that the fluorescent beads are within the expected bin, if not, adjust the gain settings.
Clean air brush and make sure needle is still present*
Chill centrifuge 5000rcf,0°C,0h 0m 0s
Fill cooler with ice
Locate samples and label all tubes (50 mL falcon tubes* and 1.5 mL screw top tubes)
- For 12 samples, you will need 12 falcon tubes, 12 1.5 mL screw top tubes, and 1 microwell plate
- Label one falcon tube and one 1.5 mL tube (If desired, add more 1.5 mL tubes as added technical replicates) for each sample being processed
Prepare tissue slurry (calcifying cnidarians only)
Before start:
- Make sure spray gun compressor is turned on
- Have somewhere to store skeletal fragments after air-brushing (e.g. small weigh boats)
- Be prepared to work efficiently as samples degrade quickly once removed from the freezer
Locate samples in ultra-low freezer and remove up to 3 samples at a time
Cut a ~1-2 cm piece from coral fragment (this will vary slightly depending on species)
Use forceps to hold coral fragment just inside the mouth of a 50 mL falcon tube, then use an airbrush loaded with filtered seawater (FSW) to remove all coral tissue from the skeleton making sure to capture the tissue in the falcon tube.
- Depending on the species, this can take 5-20 mL of FSW
- Store falcon tube on ice in dim ambient lighting
- Place the remaining skeleton on a weigh boat (Keep track of it. You will need it to normalize cell densities at the end)
Repeat steps 5.1-5.3 with all samples
- Move quickly and take no more than 1 hour for all samples combined
Once all samples have been airbrushed, vortex and needle shear each tissue slurry until homogenized
- Ensure full homogeny of slurry. Allowing any settling or heterogeneity can skew data consistency: There should be no mucus clumps or visible chunks; however, it is normal for small skeletal fragments to settle at the bottom
Once a slurry has been homogenized, transfer 1 mL to a 1.5 mL screw top tube.
Wash tissue slurries to be loaded in flow cytometer
- If not using a calcifying cnidarian, add
1mLof FSW to gelatinous tissue sample that was stored in a 1.5 mL screw-top tube
Bead beat 1.5 mL tubes 0h 0m 4s
Centrifugate samples 5000rcf,0°C
Remove 1 mL supernatant using 1000 mL pipette
- Do not pour supernatant out. Pellets are often loose and liquid does not empty completely
Resuspend pellets via repeated pipetting in 1mL of FSW
Bead beat tubes again 0h 0m 4s
Centrifugate samples 5000rcf,0°C
Remove 1mL supernatant using pipette
- Do not pour supernatant out. Pellets are often loose and liquid does not empty completely
- If you accidentally resuspend a pellet, centrifugate the sample for 30 seconds and try again.
Resuspend pellets via repeated pipetting in 1mL of FSW and set samples to the side
Load the Cytometer
Prepare 96-microwell plate for cytometry
Before start , check for supplies:
-
50 mL sufficient saltwater-freshwater solution (SFS) 25 mL FSW + 25 mL DI H2O = 50 ml SFS
-
200 uL pipette tips
-
200 uL pipette
-
20 uL pipette
-
Syringe with needle for needle sheering
-
Vortexer
Load wells of microwell plate with 180µL SFS.
- We describe this protocol with a 10x sample dilution (9 units SFS to 1 unit Sample). This volume of SFS will change as you optimize your dilutions
- We also do not recommend loading more than half a plate as fluorescent properties change after an extended period within the machine
Bead beat 0h 0m 4s a washed tissue sample then immediately load 20µL of tissue homogenate into two wells preloaded with SFS before particulate settles
- If there are any visible clumps left over from the symbiont pellet, use a combination of needle sheering and vortexing properly homogenize the sample; however, we do not recommend bead beating samples again as this risks lysing the algal cells
- Do not allow the samples to sit for any period of time in between mixing and loading. Any settling can skew data
Repeat step 7.2 until all samples have been loaded.
- We typically process 12-24 samples at a time. We do not recommend processing more than 24 samples in one run.
Prepare worklist and set cytometry run settings for Guava Flow Cytometer
In guavaSoft v4.0, open InCyte v4.0
Click "Edit Worklist"
Select the wells with loaded samples and click "Acquire Samples".
Set each wells setting to acquire for 180s with a maximum gated cell count of 2500.
Also set each well to have 2 technical replicates and 7 seconds of high energy stirring.
- This increases replication and prevents settling within the flow cytometer
Name each well
Click "Run Worklist"
Load in appropriate method, settings, and compensation files
Starter Files
Method:
Settings & Compensation (Same file for both):
Click "Acquire"
(If you would like to verify the integrity of your samples before starting the worklist, click "Adjust Settings")
Follow the plate loading prompt
- Load DI H2O, ICF, and Bleach into the appropriate positions
- Place plate in the Guava Flow Cytometer in the appropriate orientation, as indicated by the marks in the loading tray
If you clicked "Adjust Settings"
- Select the well of interest,
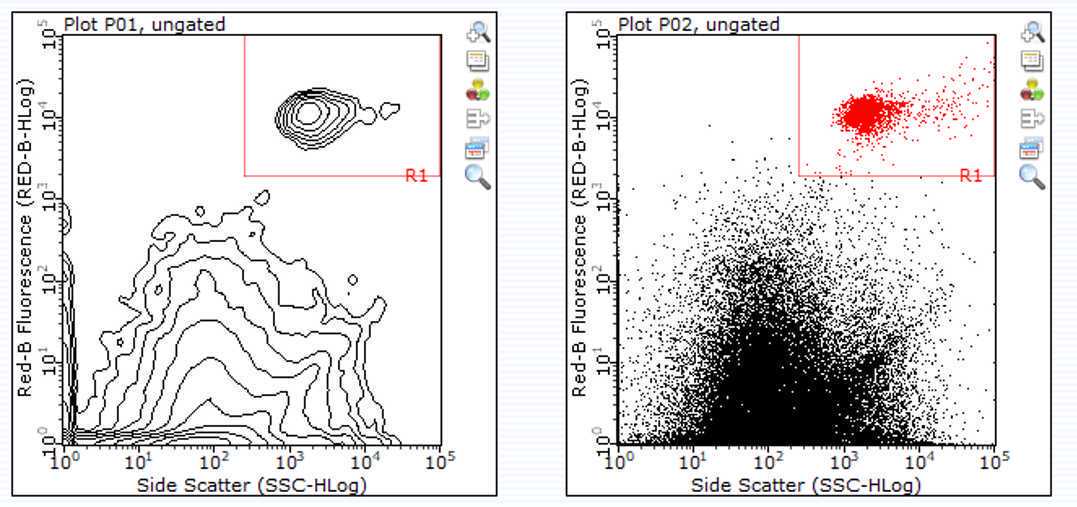
- Verify your cells are in the appropriate region [Image Attached]
- Once verified, click "Next Step"
- click "Resume Worklist"
Acquire samples
- A 48-well run should take ~
5h 0m 0s

Post-run Processing
Export single-cell observations to determine dataset-specific binning threshold
When a run has finished, click the "Analyse" tab inside of InCyte.
In most cases, recent runs will be preloaded in "Analysed Data"; however, if your dataset of interest is missing, you may load your dataset in by clicking the blue folder that says "Open Analysed Group".
- Raw files are exported as YEAR-MONTH-DAY_at_HOUR-MINUTE-SECONDpm.fcs (e.g. 2022-10-04_01-38-41pm.fcs)
- Make sure the correct Method is applied to the analyzed data (Starter Method File: Method.gsy)
Highlight all wells of interest
- Click on one well, then click again and drag your mouse across your desired selection
Right click your highlighted selection and select "Export List Mode Data"
- Sometimes an error pops up saying that the file name has already been written. Don't worry, your files were successfully exported.
Locate your exported files of interest
- If combining multiple cytometry runs, we recommend placing all .csvs in the same file.
Open RStudio to determine the dataset-specific symbiont binning threshold
Starter R Script is available here:
Example (Reduced Wells) List Mode Dataset:
Exp1_2022-09-21_at_11-08-48am.zip
Install and load in R Packages:
- dplyr v1.0.10 (Wickham et al. 2022)
- tidyr v1.2.0 (Wickham and Girlich 2022)
- readr v2.1.2 (Wickham et al. 2022)
- ggplot2 (Wickham 2016)
- ggpubr v0.4.0 (Kassambara 2020)
- cowplot v1.1.1 (Wilke 2020)
Import and combine all list mode data
(files <- fs::dir_ls("Directory/Exp1_2022-09-21_at_11-08-48am/", glob="*.CSV"))
df <- read_csv(files, id="path")
head(df)
Replace "-" with "." and make our fluorescent signature of interest (red fluorescence off of the blue laser) into a numeric
names(df) <- gsub("-", ".", names(df), fixed=TRUE)

df$RED.B.HLog <- as.numeric(df$RED.B.HLog)
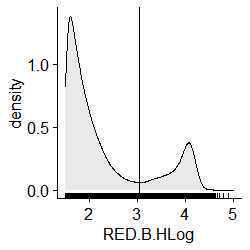
Plot the density of observations based on their relative red fluorescent intensity off of the blue laser
ggdensity(df, x = "RED.B.HLog", fill = "lightgray", rug = TRUE)+
  scale_x_continuous(limits = c(1.5, 5))
Determine your dataset-specific binning threshold to separate cells from other particles by identifying where x equals the minimum number of observations
DensityX < 4 & DensityX > 2
MinYDensity<- min(DensityY[DensityX < 4 & DensityX > 2])
MinYDensity
#0.003750236
which(DensityY == MinYDensity)
#334
DensityX[334]

#Visualize your threshold here
ggdensity(df, x = "RED.B.HLog", fill = "lightgray", rug = TRUE)+
  scale_x_continuous(limits = c(1.5, 5))+
  geom_vline(xintercept = density(df$RED.B.HLog)$x[334])

#X Minimum = 3.005898
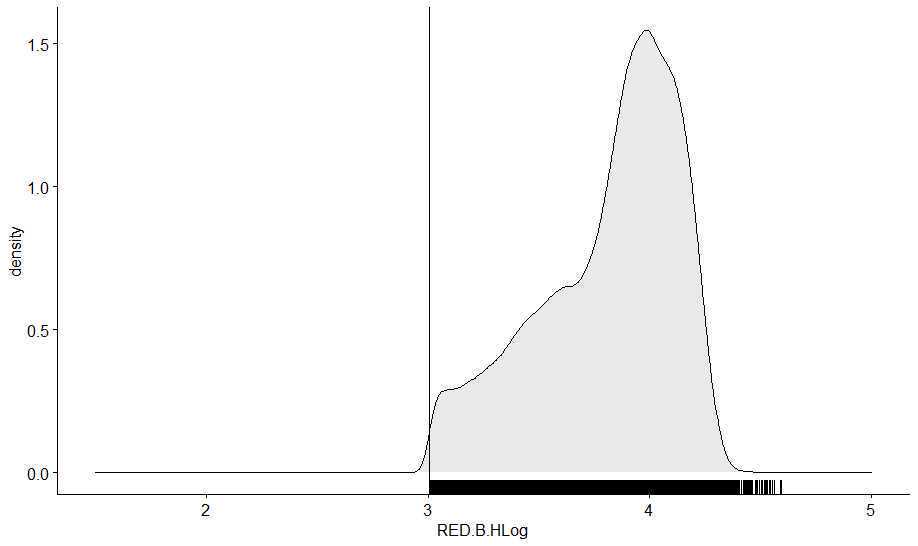
If desired, remove observations that do not fall within this binning threshold to have dataset, with every fluorescent profile for each fluorescent signature detected
- Metadata can be applied to this dataset based on file names
dfsym <- subset(df, RED.B.HLog>=3.005898)

ggdensity(dfsym, x = "RED.B.HLog", fill = "lightgray", rug = TRUE)+
  scale_x_continuous(limits = c(1.5, 5))+
  geom_vline(xintercept = density(df$RED.B.HLog)$x[378])
Export filtered data to avoid the need for reprocessing
write.csv(dat4sym,"IntendedDirectory/SubsetDataset.csv", row.names = FALSE)
Using the threshold determined in step 13.5, manually adjust the bin titled "Symbiont" on the RED-B Fluorescence Histogram in InCyte:Analyse.
<img src="https://static.yanyin.tech/literature_test/protocol_io_true/protocols.io.dm6gpjr2jgzp/mavubx9879.jpg" alt="A resized "Symbiont" bin now sits at the estimated threshold for a random well." loading="lazy" title="A resized "Symbiont" bin now sits at the estimated threshold for a random well."/>
Once the appropriate "Symbiont" bin has been applied to a dataset export a Group Stats .csv file
On the left side of InCyte, click "Show Group Stats"
Click "Setup"
Remove the checkmarks for each empty field
Click "Done"
Click "Export to .csv" and save in desired location
The fluorescence readings are now ready to be used! Label your numbers appropriately, combine with other files, and apply any necessary metadata
Concentration Normalization
To determine the cell density, multiply the number exported (Concentration) in step 15 by your dilution and slurry volume, and then normalize your concentration to a surface area for calcifying Cnidaria (e.g. Koch et al. 2021) or protein content for non-calcifying Cnidaria (e.g. Krediet et al. 2015).
Starting database for cell density calculations:
Example methods to get you started on cell concentration normalization:


