High-quality and robust protein quantification in large clinical/pharmaceutical cohorts with IonStar proteomics investigation
Shichen Shen, Xue Wang, Xiaoyu Zhu, Sailee Rasam, Min Ma, Shihan Huo, Shuo Qian, Ming Zhang, Miao Qu, Chenqi Hu, Liang Jin, Yu Tian, Sanjay Sethi, David Poulsen, Jianmin Wang, Chengjian Tu, Jun Qu
Extended
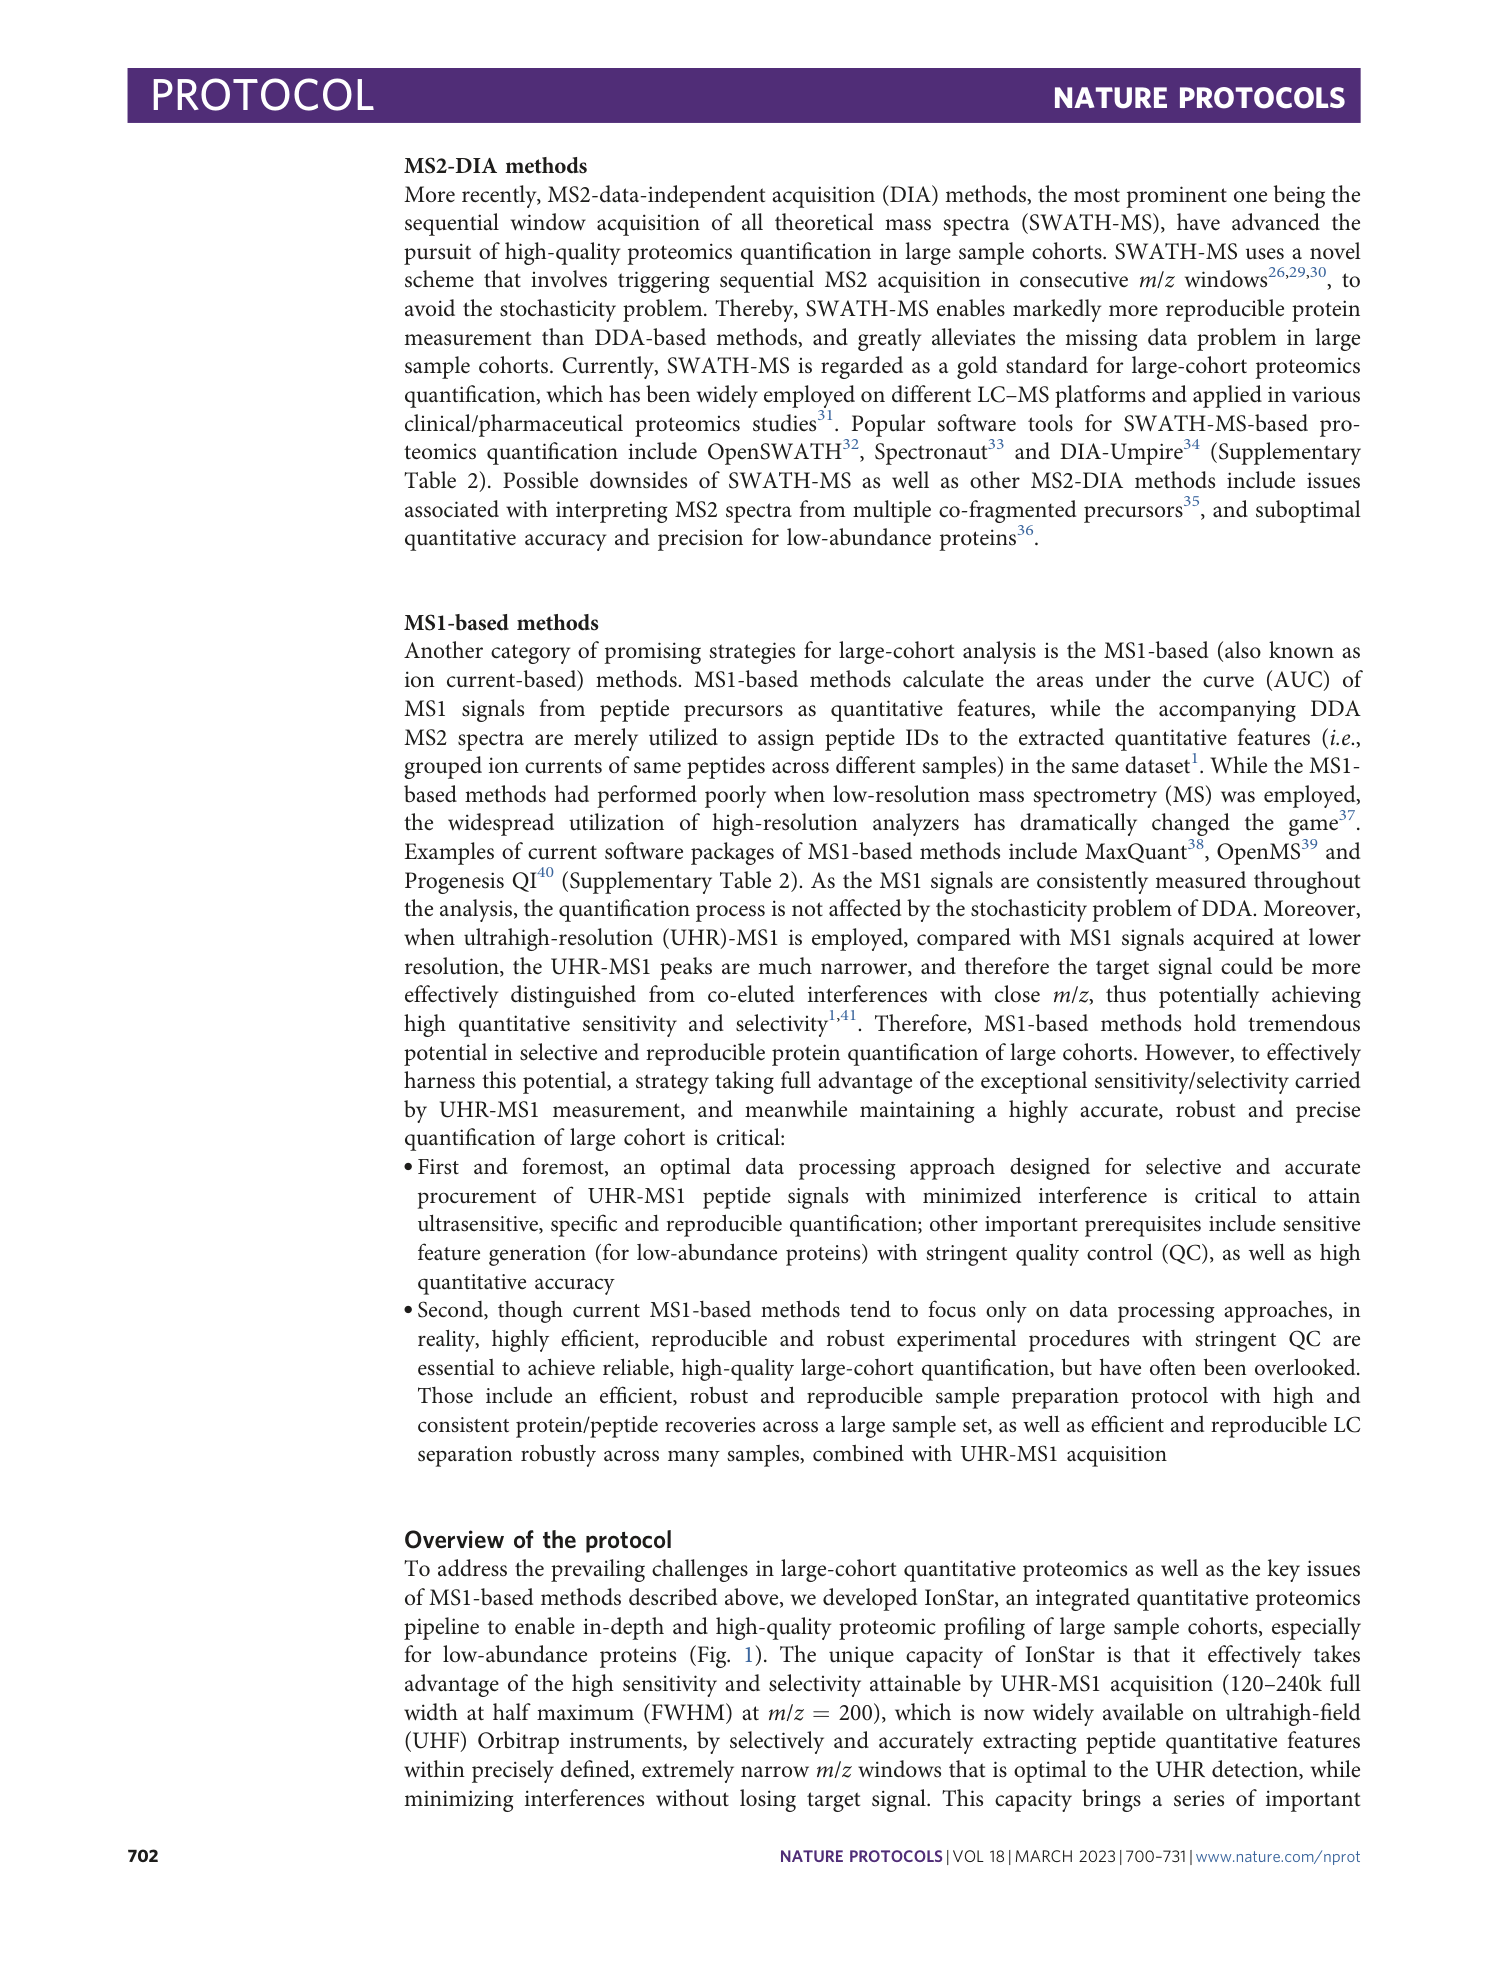
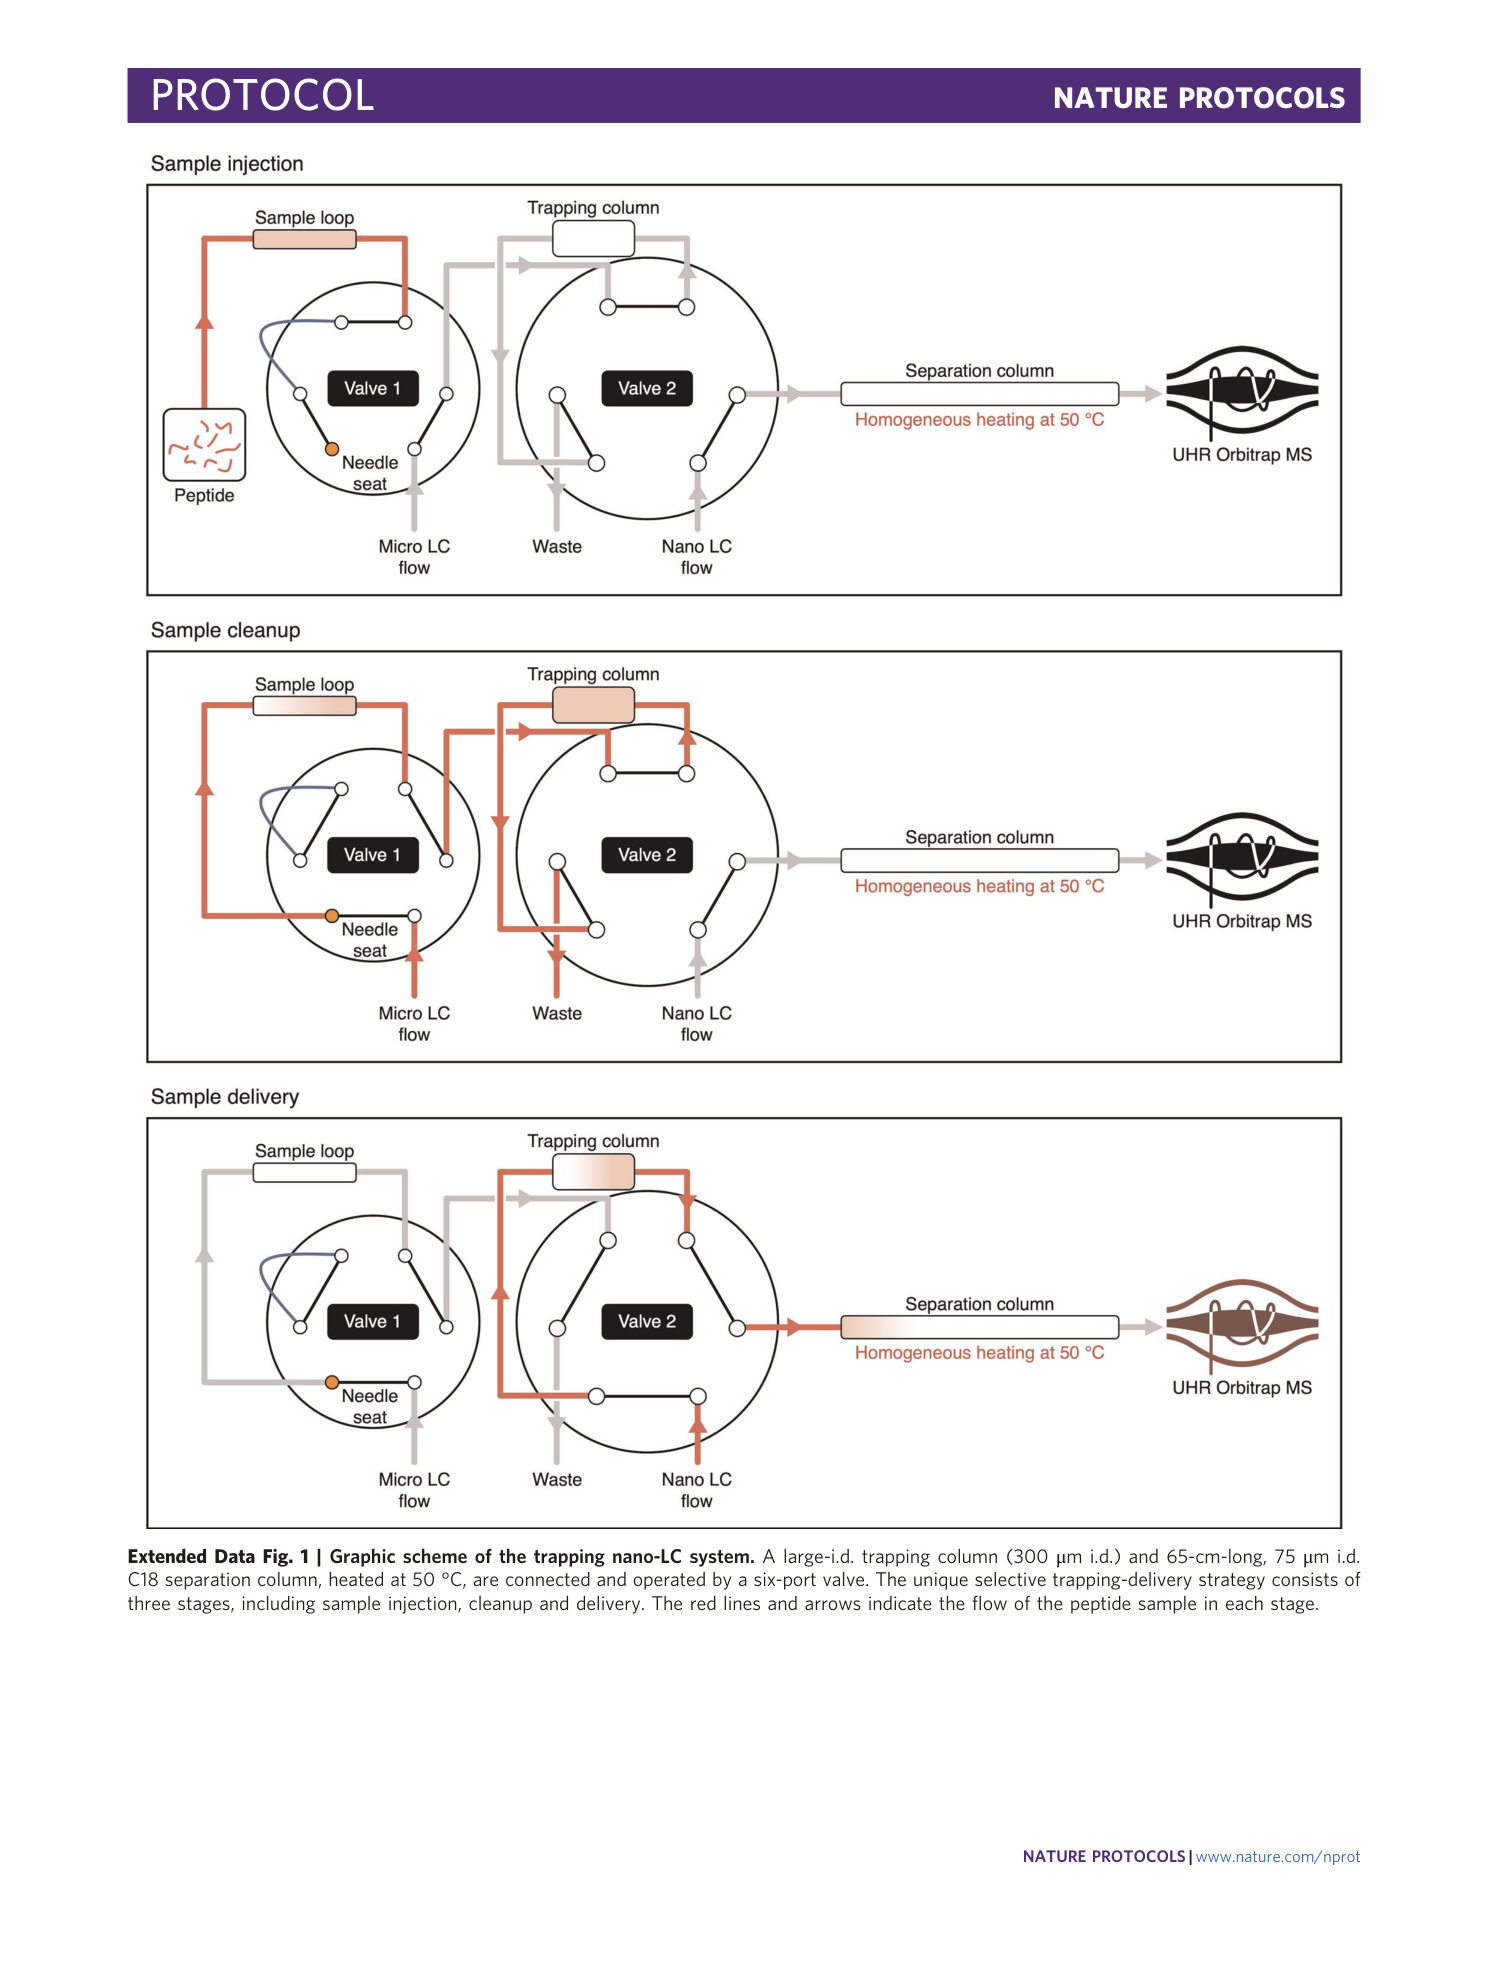
Extended Data Fig. 1 Graphic scheme of the trapping nano-LC system.
A large-i.d. trapping column (300 μm i.d.) and 65-cm-long, 75 μm i.d. C18 separation column, heated at 50 °C, are connected and operated by a six-port valve. The unique selective trapping-delivery strategy consists of three stages, including sample injection, cleanup and delivery. The red lines and arrows indicate the flow of the peptide sample in each stage.
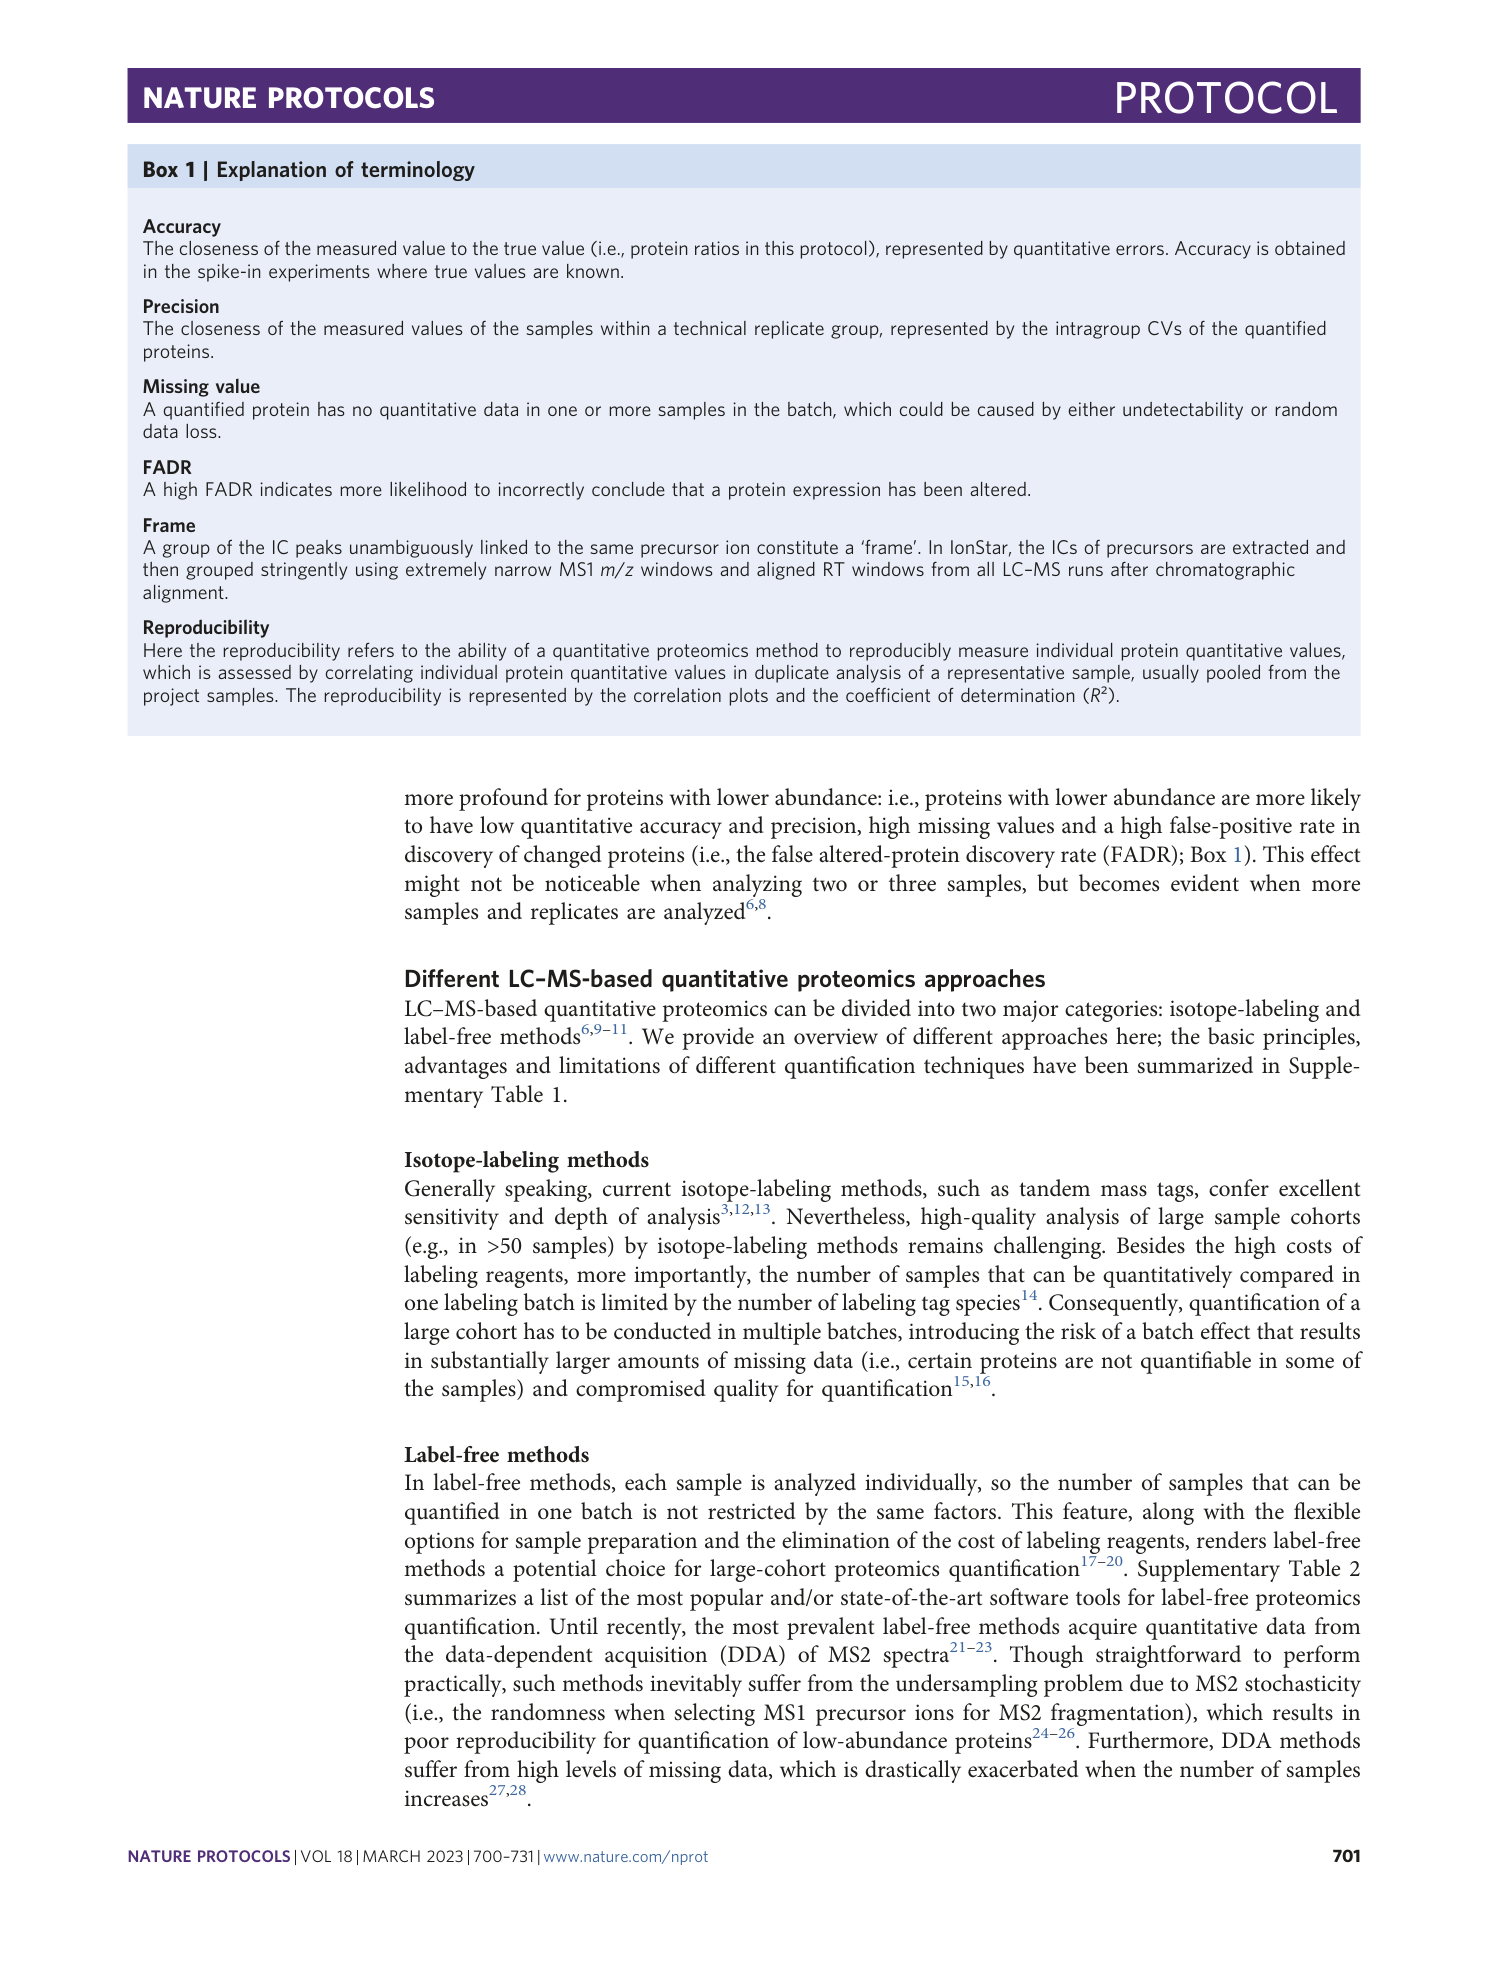
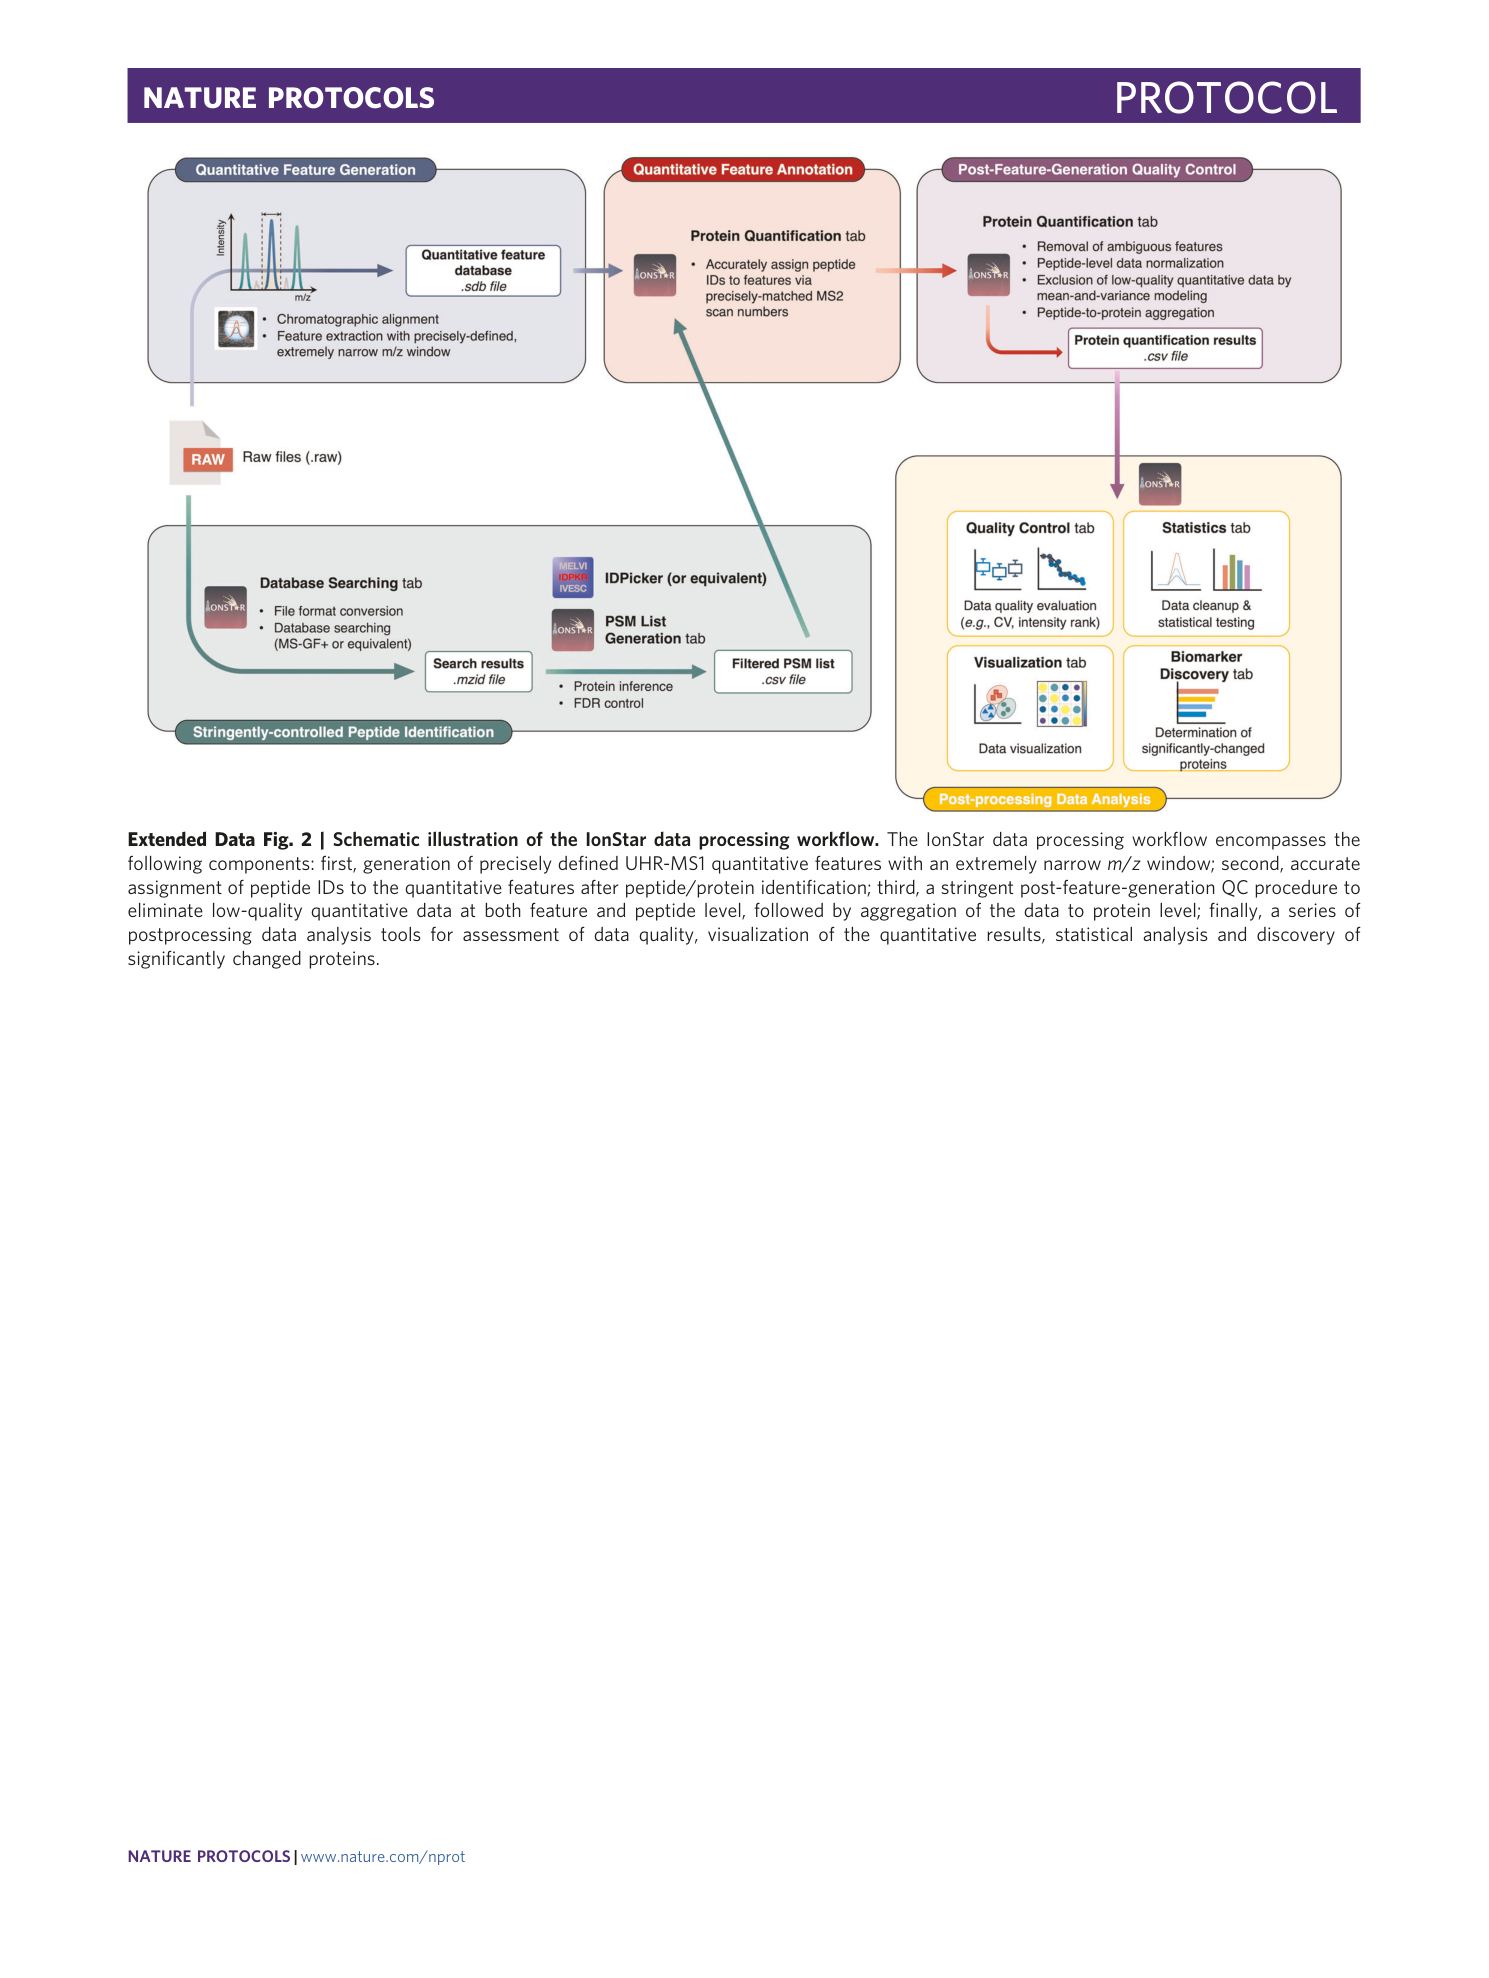
Extended Data Fig. 2 Schematic illustration of the IonStar data processing workflow.
The IonStar data processing workflow encompasses the following components: first, generation of precisely defined UHR-MS1 quantitative features with an extremely narrow m / z window; second, accurate assignment of peptide IDs to the quantitative features after peptide/protein identification; third, a stringent post-feature-generation QC procedure to eliminate low-quality quantitative data at both feature and peptide level, followed by aggregation of the data to protein level; finally, a series of postprocessing data analysis tools for assessment of data quality, visualization of the quantitative results, statistical analysis and discovery of significantly changed proteins.
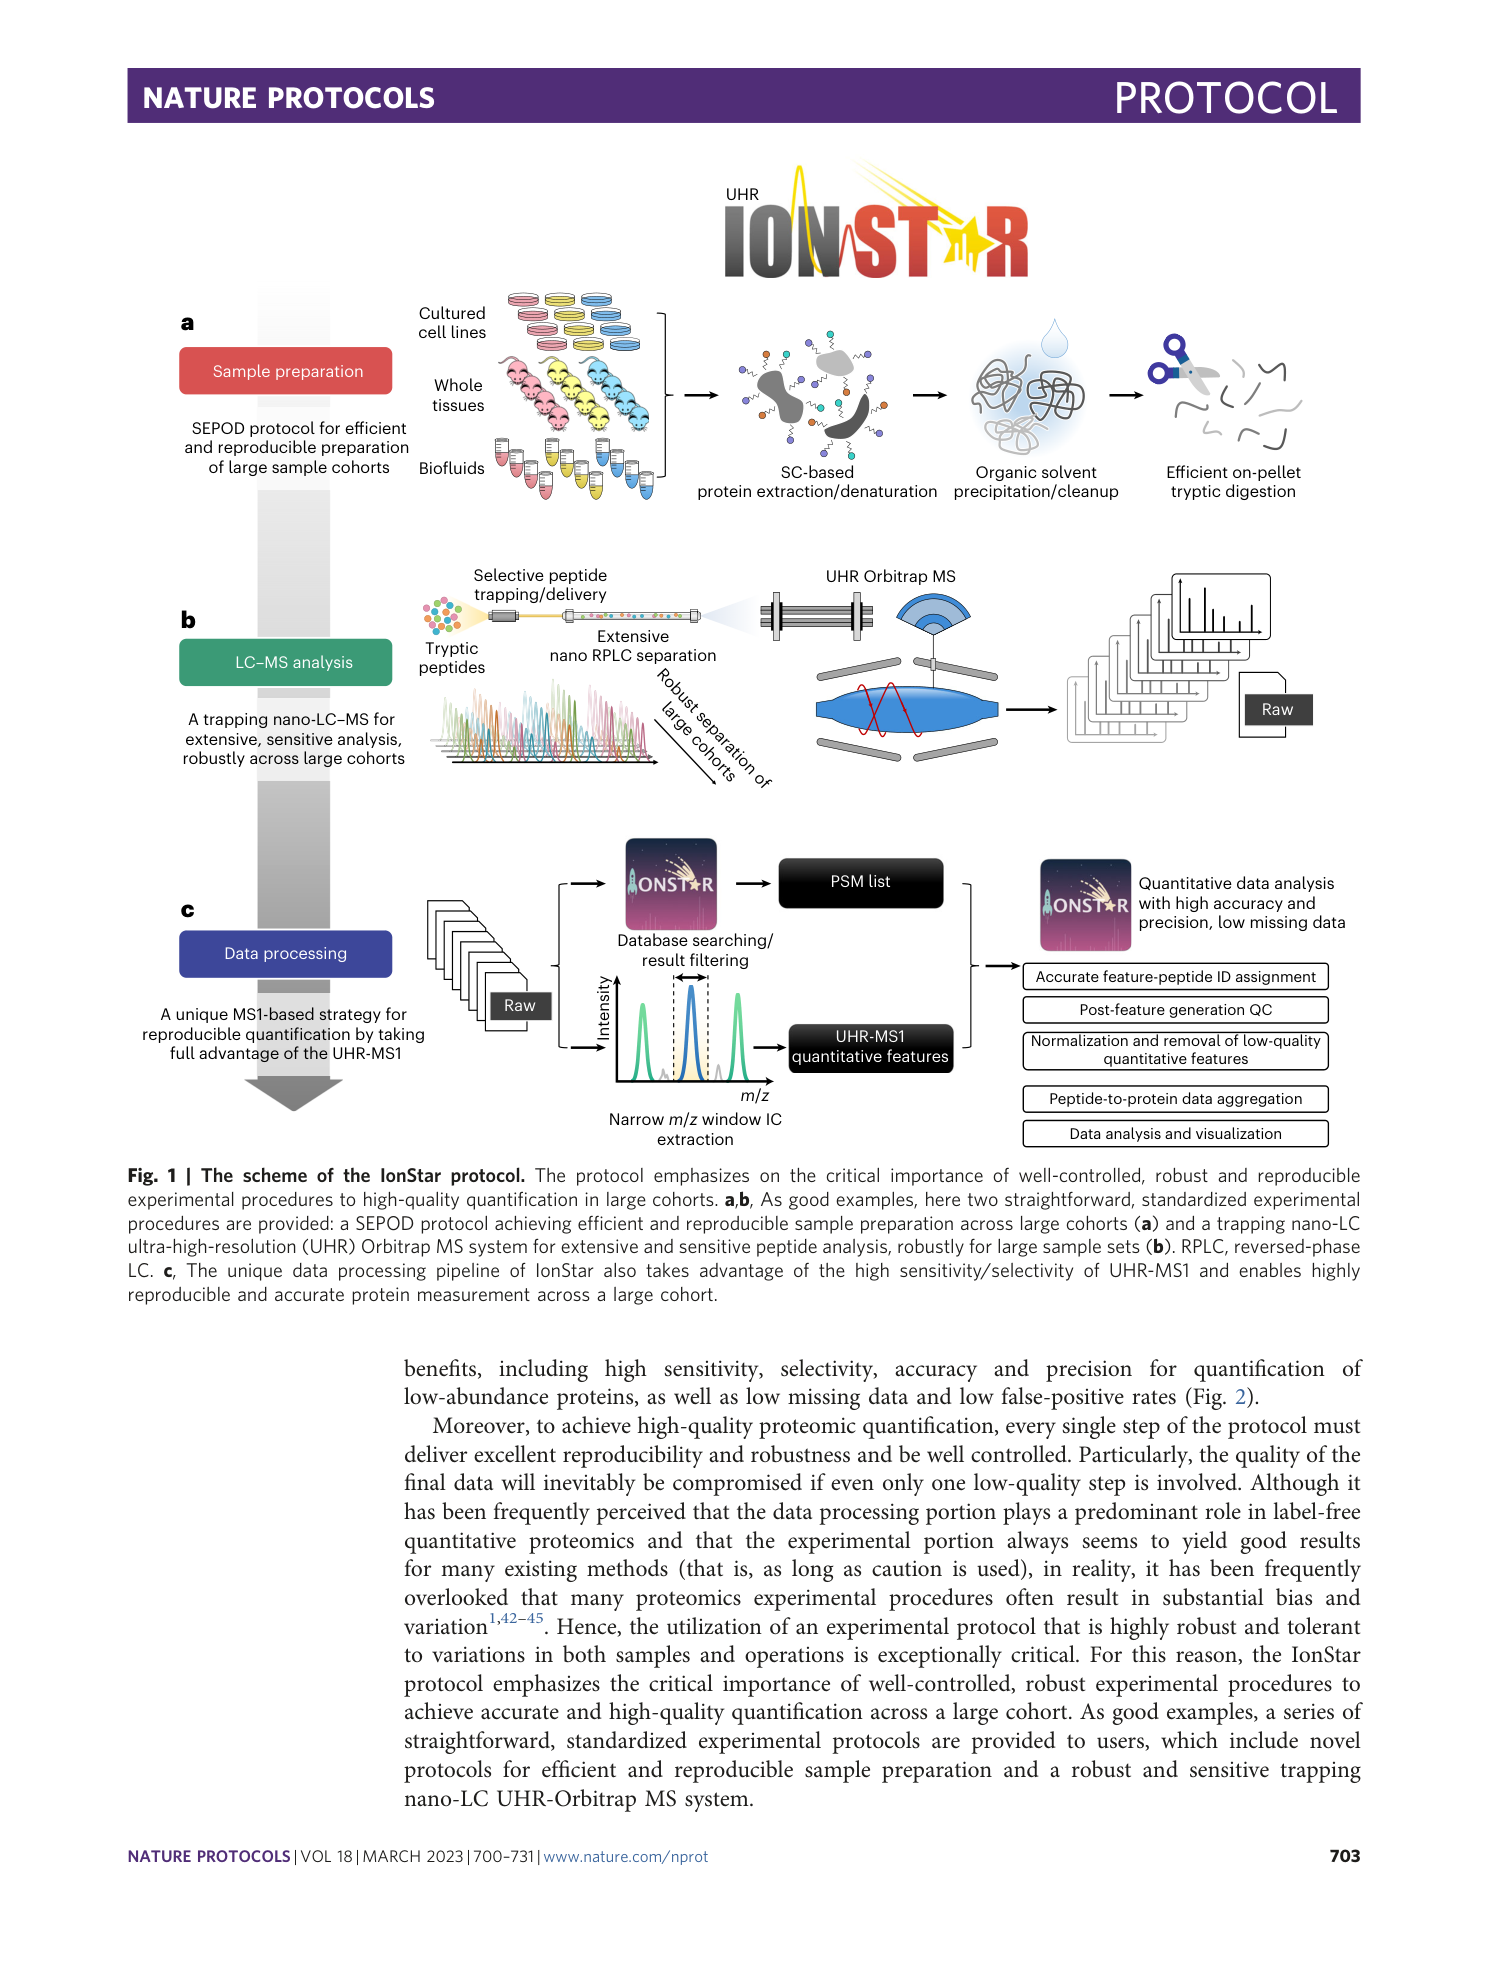
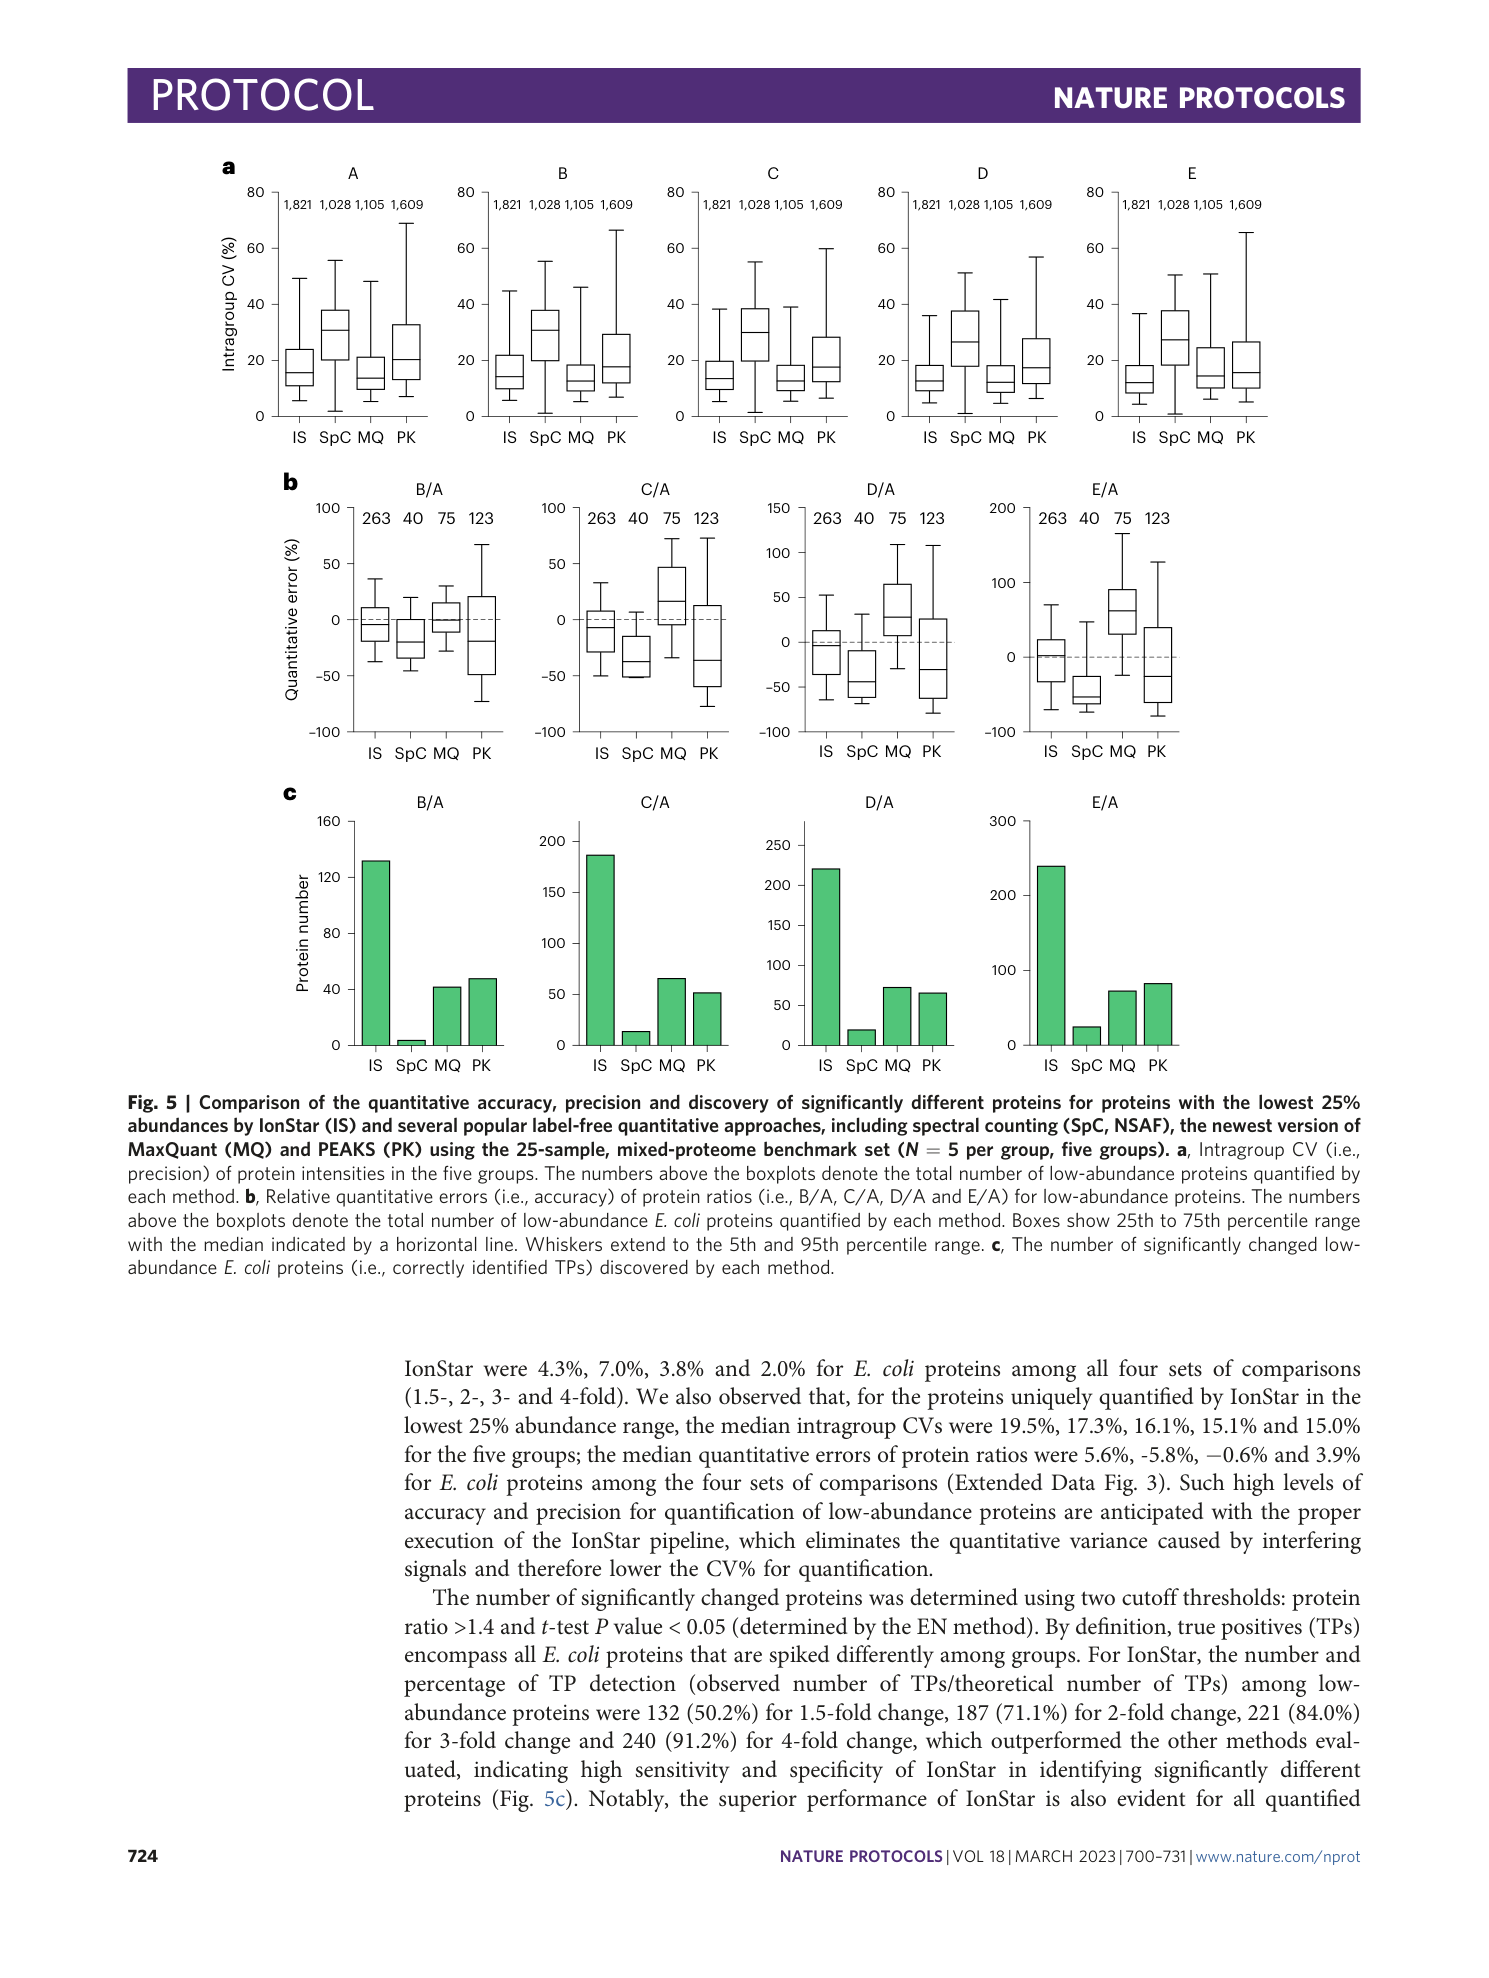
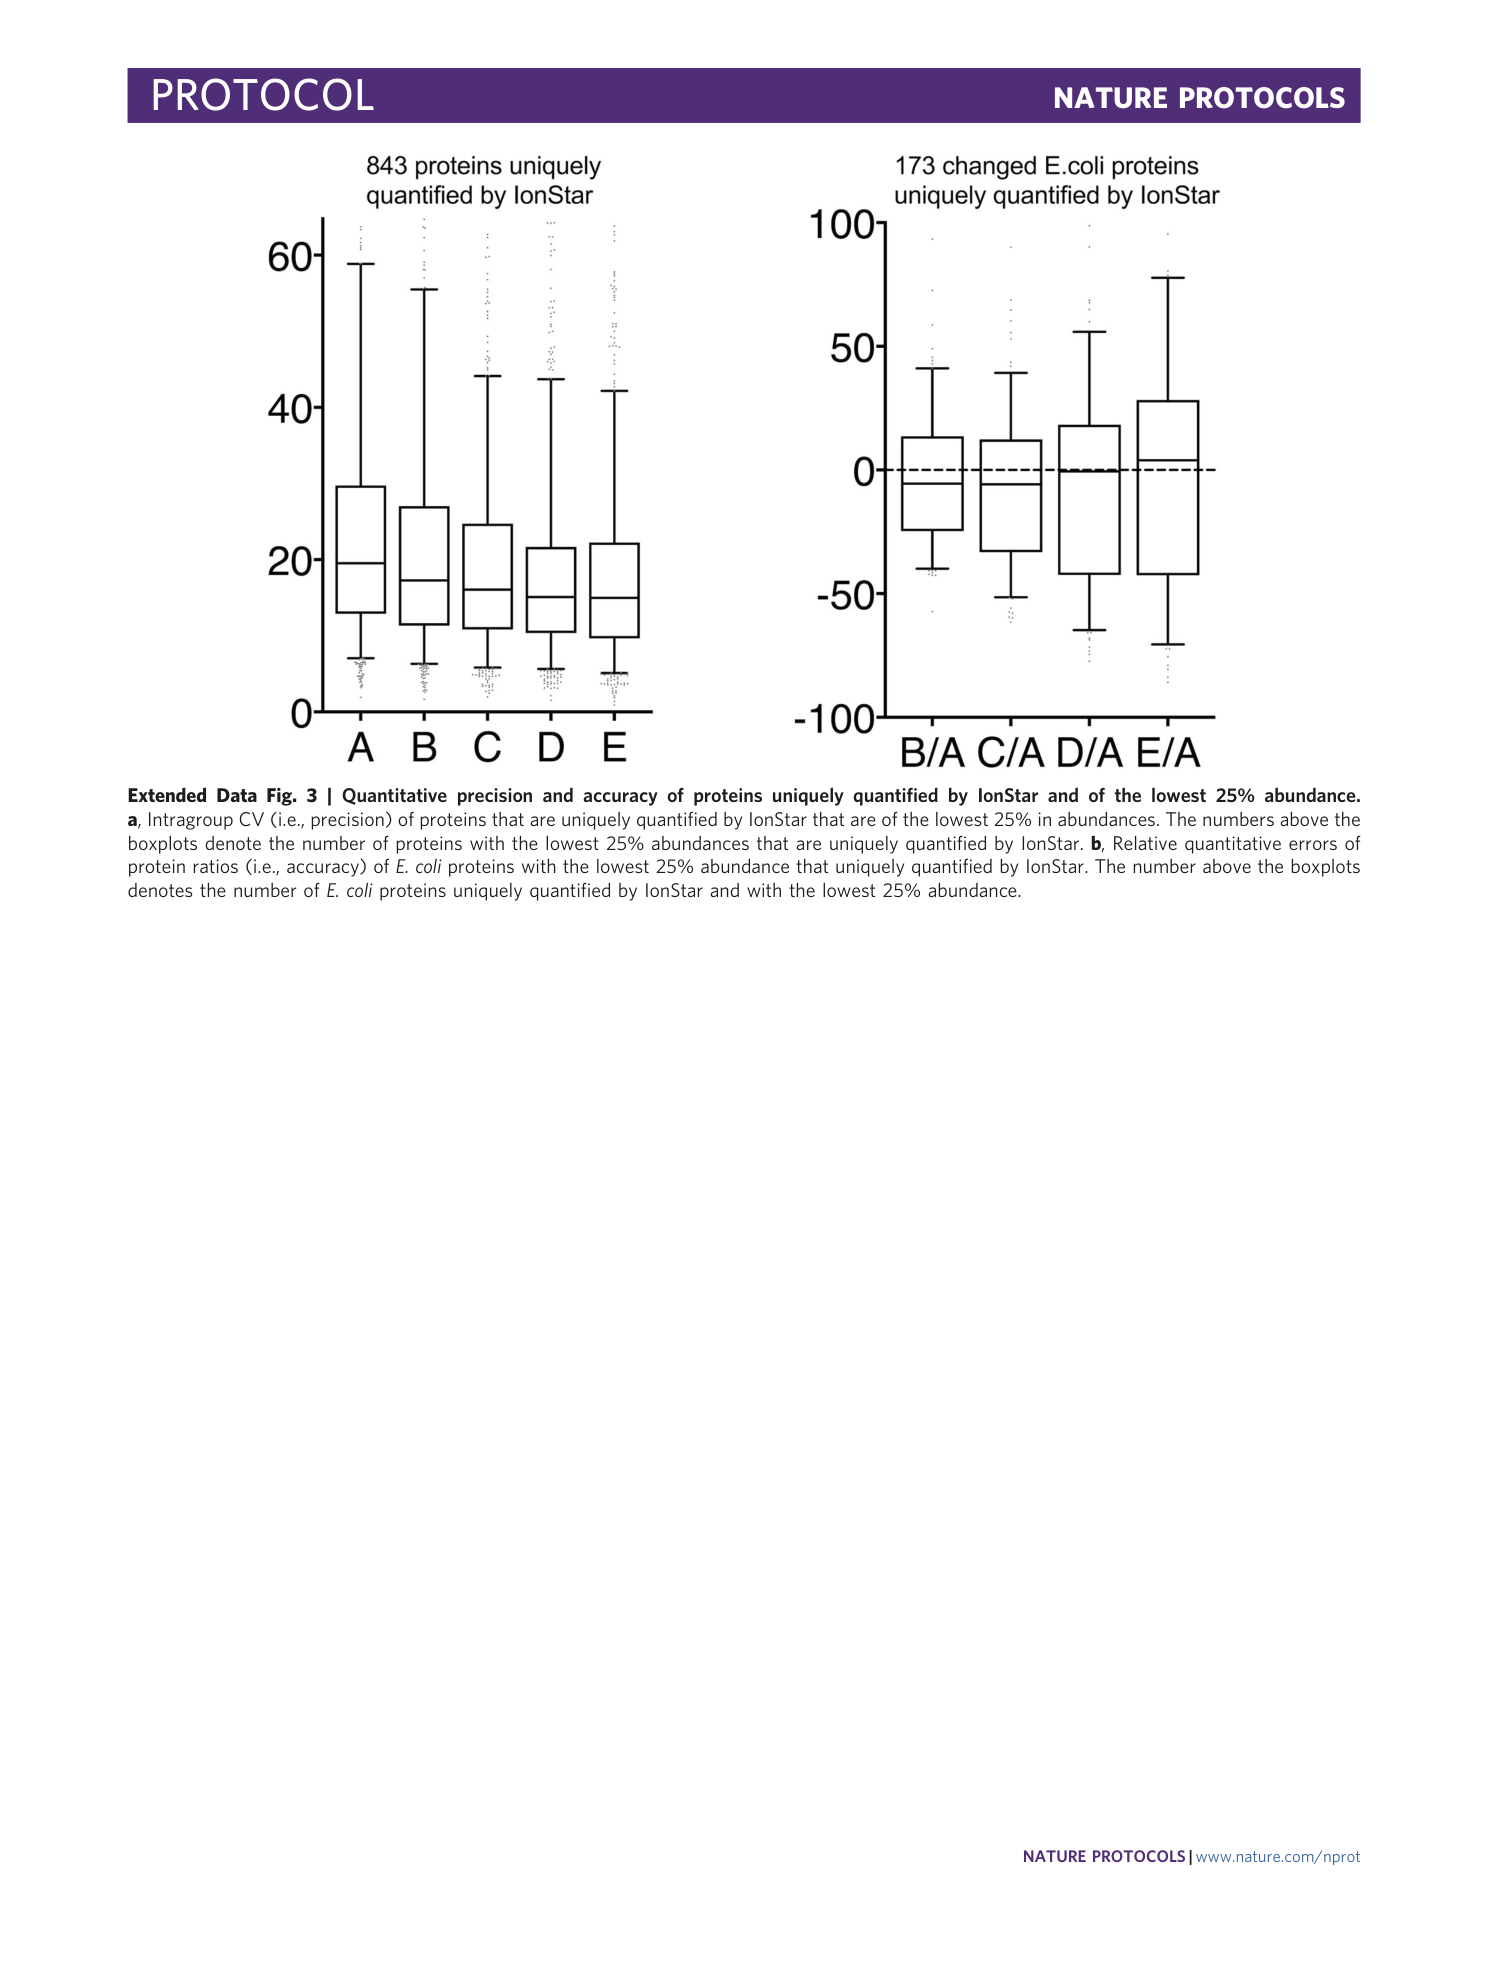
Extended Data Fig. 3 Quantitative precision and accuracy of proteins uniquely quantified by IonStar and of the lowest 25% abundance.
a , Intragroup CV (i.e., precision) of proteins that are uniquely quantified by IonStar that are of the lowest 25% in abundances. The numbers above the boxplots denote the number of proteins with the lowest 25% abundances that are uniquely quantified by IonStar. b , Relative quantitative errors of protein ratios (i.e., accuracy) of E. coli proteins with the lowest 25% abundance that uniquely quantified by IonStar. The number above the boxplots denotes the number of E. coli proteins uniquely quantified by IonStar and with the lowest 25% abundance.
