Heron Data Suite: biomedical quantitative analysis applications for Skyline results files
Mary Cunningham, Stephen Cunningham, Matthew Renfrow
Proteomics
Skyline
Skyline MS
mass spectrometry
biomedical
absolute quantification
AQUA peptides
targeted quantification
calibration curve
peptide ratio results
light:heavy ratio
Heron Data
Abstract
This protocol describes the use of the Heron Data Suite application (https://www.herondata.app/). The Heron Data Suite simplifies the analysis of biomedical proteomics results processed in Skyline. Post-data processing, Heron Data organizes results and goes the extra mile to account for technical replicates. Heron Data contains two apps currently: Replicate Absolute Quantification ( Heron Quant ) and Glycopeptide Area Under the Curve ( Heron Glyco ).
The purpose of Heron Quant is to further analyze 'Peptide Ratio Quantification' .csv exports from the open source proteomics tool Skyline (https://skyline.ms/project/home/software/Skyline/begin.view). Heron Quant improves the rigor and reproducibility of Skyline for biomedical proteomics purposes by averaging replicates of a single sample or standard and plots the averaged calibration curves and outputting concentration averages. Heron Quant will calculate the R-squared value and linear equations of the calibration curves, as well as the coefficient of variance and the standards deviation of replicates.
Heron Glyco is designed specifically for analysis of glycopeptide area under the curve CSV files from Skyline. Heron Glyco will organize your Skyline AUC data by glycopeptide into separate worksheets, calculate the percent relative abundance of glycopeptide for each replicate, and plot the percent relative abundance in pie charts of all grouped glycopeptides in each sample.
Heron Data Suite will receive future updates and new application additions.
Need support? Contact us using the form on our website: https://www.herondata.app/contact
Before start
Before using Heron Data Suite , all mass spec files should have been processed in Skyline by quantification using their absolute quantification features ( Heron Quant ) or for glycopeptide area under the curve ( Heron Glyco ). This will give you the 'Peptide Ratio Results' .csv export file you need to submit to Heron Data for further analysis. Step 1 of this protocol will instruct you where to find this document in Skyline. A helpful tutorial for absolute quantification of proteins in Skyline can be found on their website in this PDF: https://skyline.ms/_webdav/home/software/Skyline/@files/tutorials/AbsoluteQuant-20_1.pdf
Visit this page on Skyline's website for more information and webinars on absolute quantification: https://skyline.ms/wiki/home/software/Skyline/page.view?name=tutorial_absolute_quant .
ASSUMPTIONS
Assumptions using Heron Data: Replicate Absolute Quantification (Heron Quant) Heron Quant )
- 'Peptide Ratio Results' .csv export file comes from Skyline and has been quantified using their tutorial for Absolute Quantification
- Mass spec file nomenclature should use the following template to allow proper parsing of replicates: date_samplename_numberofreplicate Ex. 20240312_sampleX_1 , 20240312_sampleX_2 , 20240312_sampleY_1 , 20240312_sampleY_2 , 20240312_STD1_1 , 20240312_STD1_2. If your nomenclature was not setup in this format, go into the .csv file and manually edit the sample names to fit this template (Excel find and replace feature will streamline file name editing). File name formatting is how Heron Quant groups your technical replicates for a single sample.
- Technical replicates are ran sequentially as shown above
Assumptions using Heron Data: Glycopeptide AUC (Heron Glyco) Heron Glyco )
- 'AUC' .csv export file comes from Skyline. Data has been completely processed (i.e. peak boundaries have been verified)
- Mass spec file nomenclature should use the following template to allow proper parsing of replicates: date_samplename_numberofreplicate Ex. 20240312_sampleX_1 , 20240312_sampleX_2 , 20240312_sampleY_1 , 20240312_sampleY_2 , 20240312_STD1_1 , 20240312_STD1_2. If your nomenclature was not setup in this format, go into the .csv file and manually edit the sample names to fit this template (Excel find and replace feature will streamline file name editing). File name formatting is how Heron Glyco groups your technical replicates for a single sample.
- When naming the glycopeptides in Skyline analysis, please use this nomenclature for "Protein Name": GalNAc#Gal#
- If including sialic acid in analysis, use this nomenclature: SA#GalNAc#Gal#
Steps
1. Using Heron Data: Replicate Absolute Quantification with your Skyline 'Peptide Ratio Results" .csv export
If you're wanting replicate absolute quantification, stay here. If you want glycopeptide area under the curve, proceed to section 2.
Please read the Replicate Absolute Quantification Assumptions under "Guidelines" of this protocol before beginning to ensure your document's compatibility with Heron Quant .
To get the "Peptide Ratio Results" .csv Excel file needed for Heron Quant , open your analyzed and quantified Skyline document.
Click "View" and click "Document Grid"
In the top left corner of the Document Grid pop-up, click the "Reports" drop-down menu. Select "Peptide Ratio Results"
In the middle of the Document Grid table, select "Export..". Name your file and where you would like to save it in the file browser.
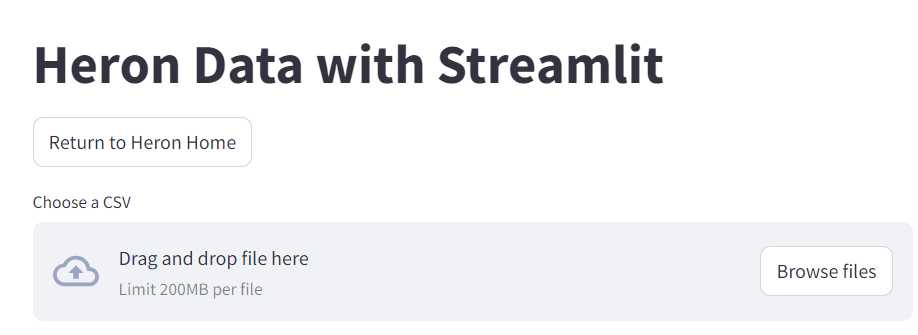
Once you have your "Peptide Ratio Results" .csv Excel export file from Skyline, visit the app's website: https://www.herondata.app/
Click the "Heron Quant" button.
Click "Choose File" and upload your .csv Excel file.
Use the pop-up file browser to locate and select your Excel file. THe name of the file should appear in the window.
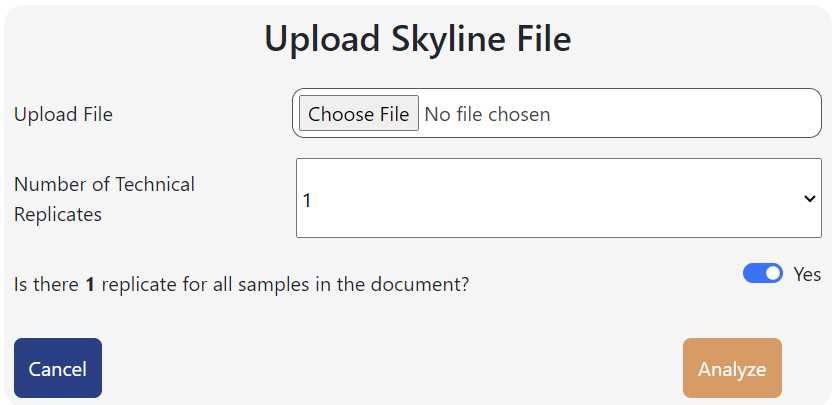
Below, use the drop-down menu to select the number of technical replicates each of your samples has.
It will then ask if if there are that number of technical replicates for each sample. This is an option in case one sample lost replicates during running either due to running error, bad samples, not wanting to use certain replicates, or not all of the samples in your run had the same amount of replicates.
If all samples have the same number of replicates you selected, select "Yes".
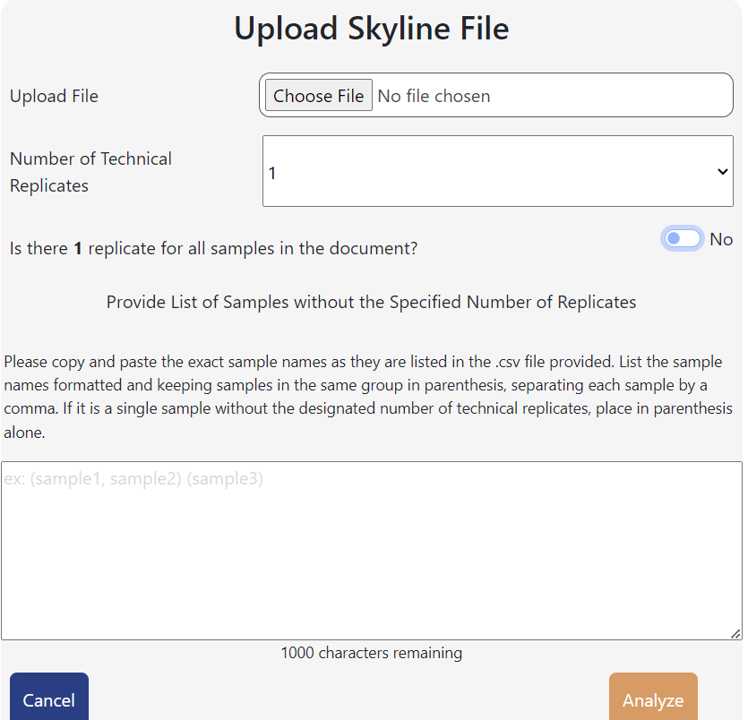
If not all samples in your data set have the same amount of technical replicates, select no. A dialogue box will appear. Provide a list of samples without the specified number of replicates.
- Please copy and paste the exact sample names as they are listed in the .csv file provided. This is how the technical replicates will be grouped together. List the sample names formatted keeping replicates in same group in parenthesis, separating each sample in the group by a comma. If it is a single replicate, place in parenthesis alone.
- Ex. (sample1, sample2, sample3, sample4) (sampleA) (sampleB) (sampleC, sampleD)
Click "Analyze"
The analyzed data page will appear. Table 1 is the data for averaging replicates to generate calibration curves. You can choose how many rows you would like to display per page and toggle through pages at the bottom of the table.
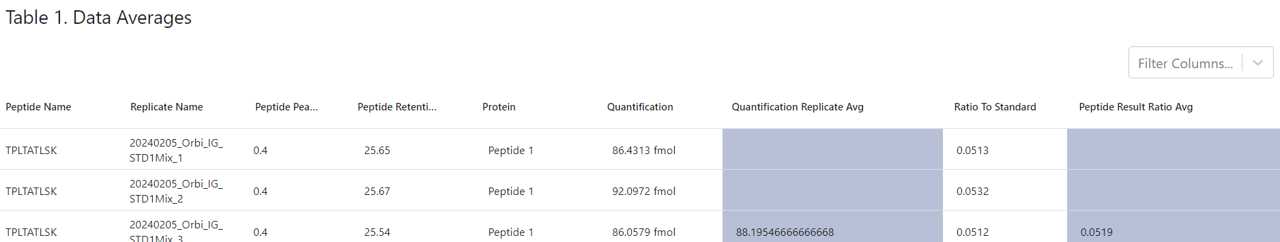
This table contains:
Peptide Name, Replicate Name, Peptide Peak Ratio, Peptide Retention Time, Protein, Quantification, and Ratio To Standard as were exactly listed in the .csv file analyzed
In addition, Heron Quant has now grouped the replicates for each sample and averaged both the quantification (blue highlighted column named "Quantification Replicate Avg) and the ratio to standard (blue highlighted column "Ratio Replicate Avg")
Scroll below Table 1 to see Table 2. Table 2 is statistical analysis of your averaged replicates. You can choose how many rows you would like to display per page and toggle through pages at the bottom of the table. You'll see the quantification average and peptide ratio averages from Table 1.
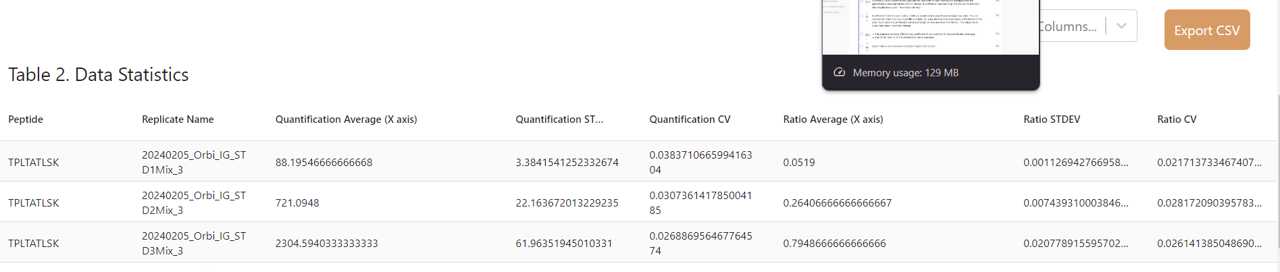
The values Heron Quant calculates in addition includes:
The standard deviation (STDEV) and coefficient of variance (CV) of the quantification averages* The STDEV and CV of the peptide ratio results averages
Export Table 2 as a CSV by clicking the "Export CSV" button.
Below Table 2 are all calibration curves for each peptide in the .csv with the averages plotted of each sample and standard. The X-axis is the Quantification Averages titled Analyte Concentration (units). The Y-axis is the Peptide Ratio Results average titled "Light : Heavy Peak Area Ratio". Standards (STD) are plotted a red dot and "unknown" samples are plotted a blue triangle.
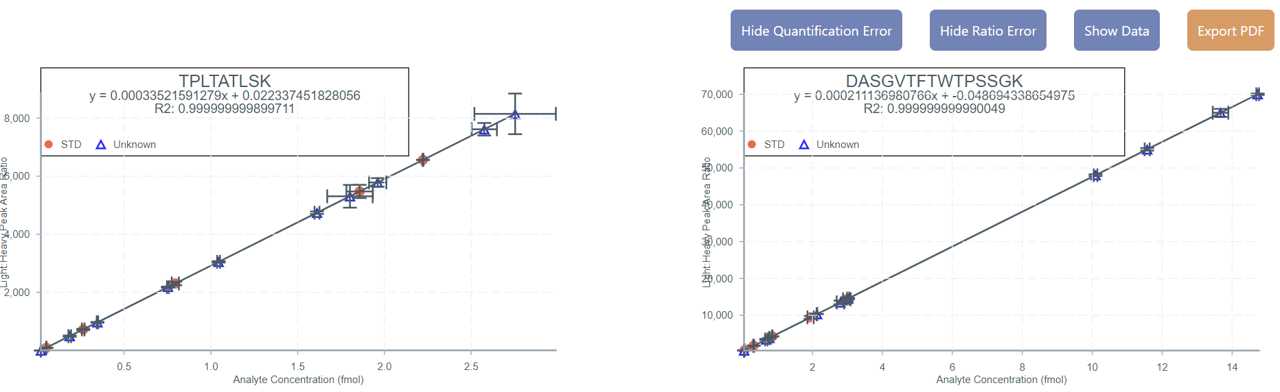
The linear regression equation and R2 values are provided at the top of each calibration curve.
You can click on each data point to see the sample name toggle on and click again to toggle it off.
Click the "Show Data" button to show the exact x and y coordinates over each data point. Click again to "Hide Data".
Click "Export PDF" to export the calibration curves as a PDF file
Note: Leaving the tab open will store your results. If you exit the tab or the browser the page will refresh to the home page.
2. Using Heron Data: Glycopeptide AUC with Skyline 'AUC' .csv export
If you're wanting glycopeptide area under the curve, stay here. If you want replicate absolute quantification, go to section 1.
Please read the Heron Glyco Assumptions under "Guidelines" of this protocol before beginning.
To get the "AUC" .csv Excel file needed for Heron Glyco , open your analyzed Skyline document.
Click "View" and click "Document Grid"
In the top left corner of the Document Grid pop-up, click the "Reports" drop-down menu. Select "AUC".
You can customize this report to include any additional data you would like. Heron Glyco will only consider the following data columns: protein name, replicate name, and total area. NOTE: If you have multiple charge states, Heron Glyco recognizes multiple total areas for the same protein (glycopeptide) and same replicate and will add the two charge states together. For more information on Skyline reports, visit Skyline's tutorial on custom reports that defines values in the report document. https://skyline.ms/wiki/home/software/Skyline/page.view?name=tutorial_custom_reports
In the middle of the Document Grid table, select "Export..". Name your file and where you would like to save it in the file browser.
Once you have your "AUC" .csv Excel export file from Skyline, visit the app's website: https://www.herondata.app/
Click the Glycopeptide Area Under the Curve button.
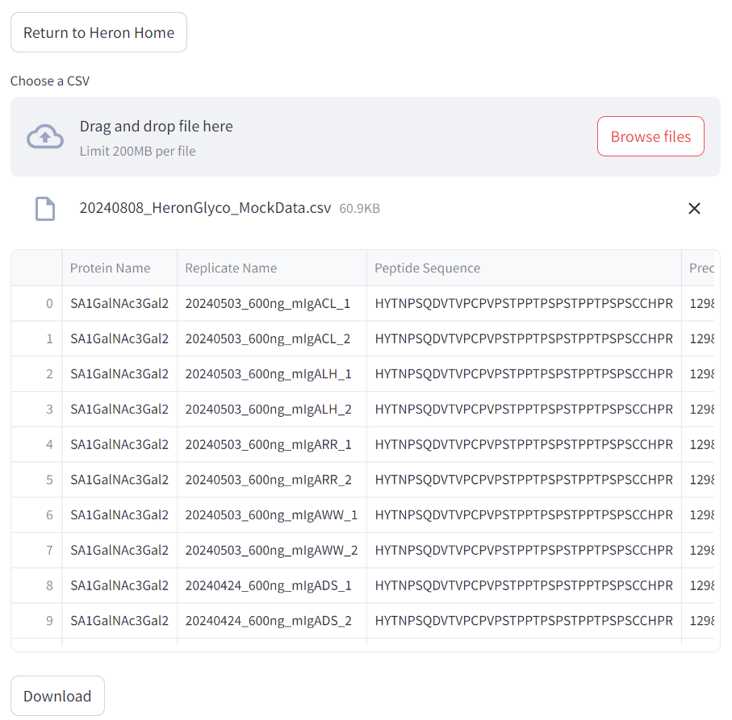
Click Browse Files and select the .csv export from Skyline for your AUC data and click open. The page will then update to show in grid format the data in the file you have selected.
After visually confirming this is the correct file, scroll down and click the download button. Name the file in the file browser and click save. This will download your results file.
Open the download.
Note: Heron Glyco has now made the file type saved as an Excel Workbook file.
About the download: Your data will be organized by glycopeptide. Each glycopeptide will have it's own tabbed worksheet and will have the areas (and/or averaged areas if multiple charge states) listed horizontally by replicate.

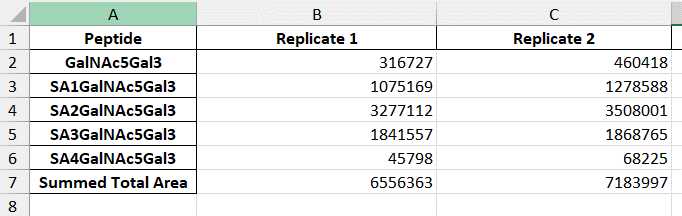
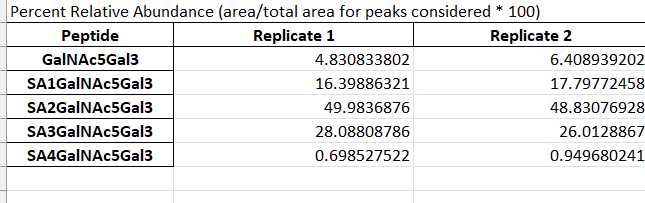
Below the Total Areas, you'll see a section titled "Percent Relative Abundance". Heron Glyco has calculated the percent relative abundance by the area of the single glycopeptide divided by the total of the area of all glycopeptides in that worksheet multiplied by 100. This is done per replicate.
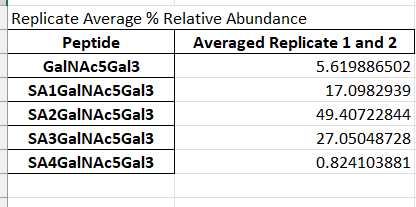
The next section below is the Replicate Average Percent Relative Abundance. Here, Heron Glyco has averaged any replicates' percent relative abundance together. Replicates are determined by nomenclature specified in the Assumptions under G uidelines of this protocol. Please see that for more information on setting up replicate names. If no replicates are denoted, it will use the percent relative abundance calculated above.
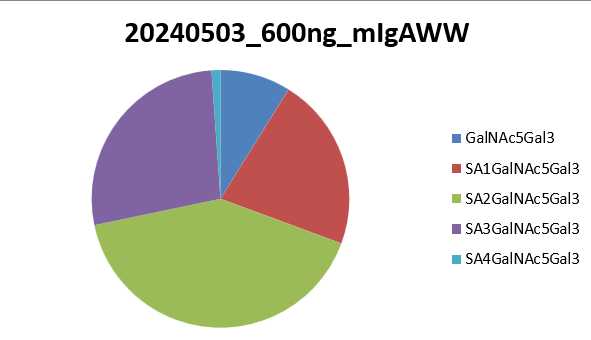
Each worksheet contains a pie chart, per sample using the value calculated in the Replicate Average Percent Relative Abundance. Each pie chart title is the name of the replicate it represents. The pie chart is showing what percentage of the whole sample that each glycopeptide within that worksheet represents.