Graph Neural Network Framework for Web-Based Prediction of Protein-Ligand Docking Scores across multiple organs
Vidya Niranjan, Chandrashekar K, Anagha S Setlur, Arjun Balaji
QSAR
machine learning and deep learning
graph convolution networks
graph neural networks
data pre-processing
human organs
web-based predictions
Abstract
Estimating the docking score between proteins and drugs is very important in the application of structure-based drug design. This project explores the application of Graph Neural networks (GNN) in the field of molecular property prediction using SMILES representation, the trained models are then deployed on a web-based platform for broader accessibility and use. The primary dataset utilized in this study includes molecular data represented by MolPort IDs and associated docking scores, which are critical in assessing molecular interactions. A significant aspect of this project is data preprocessing, where each molecule, initially represented as a SMILES string, is converted into a graph format. Effective molecular representation learning is pivotal to facilitate molecular property prediction. Models are then evaluated based on various performance metrics and deployed on the web-based platform.
Keywords: QSAR, machine and deep learning, graph convolution networks, graph neural networks, data pre-processing, human organs, web-based predictions
Before start
Check system compatibility to run pre-processing of models and GCN/hybrid GCN models.
Steps
IMPORTING LIBRARIES
Import all necessary libraries
Ensure the installation and importation of all the necessary libraries needed for both the data preprocessing and the model training and evaluation. Provided below is a screenshot of the required libraries to be imported.


DATASET CREATION
In the present scenario, Quantitative Structure Activity Relationship (QSAR) data generated from Schrodinger Maestro was used for dataset creation. QSAR models were first generated for specific proteins and by taking a set of ligands from MolPort.
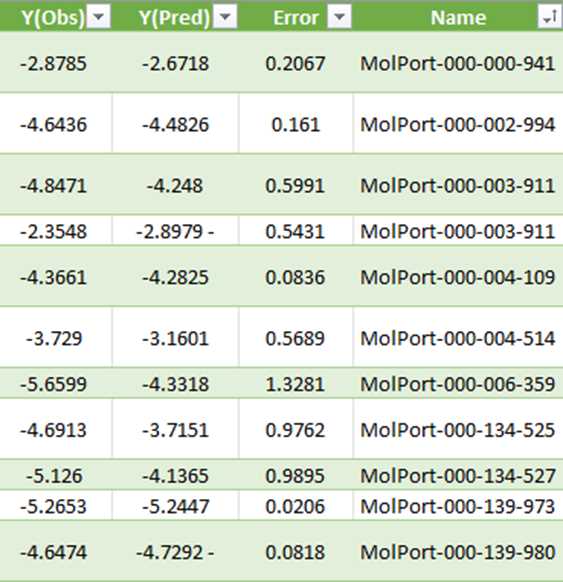
Taking an example for Brain, O14672. Here, Y(Obs) is the docking score. This dataset has the MolPort IDs and the docking scores obtained from QSAR modeling data.

Creation of analytical dataset
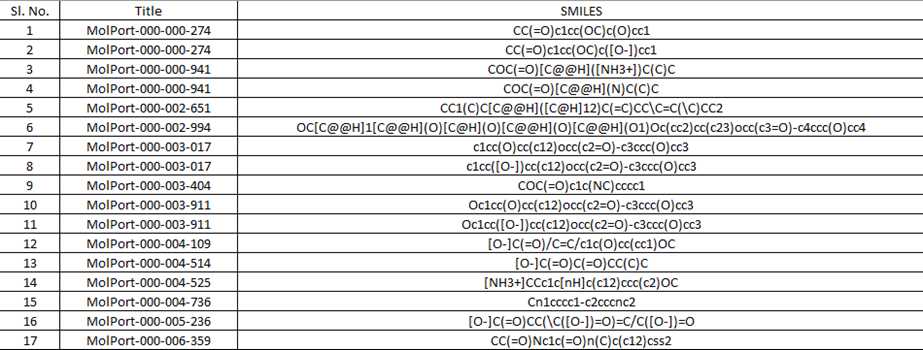
Using the second dataset containing MolPort IDs and the SMILES string. An analytical dataset was created.

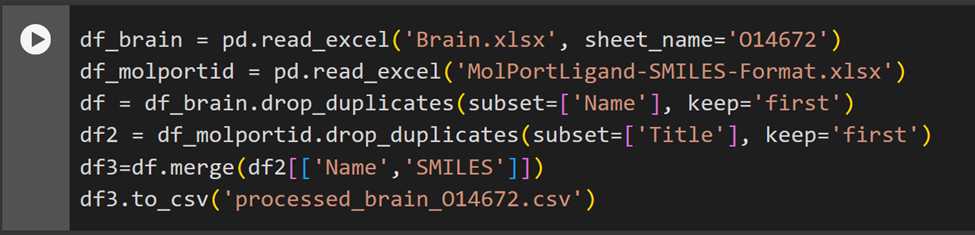
The following is performed to prepare an analytical dataset:

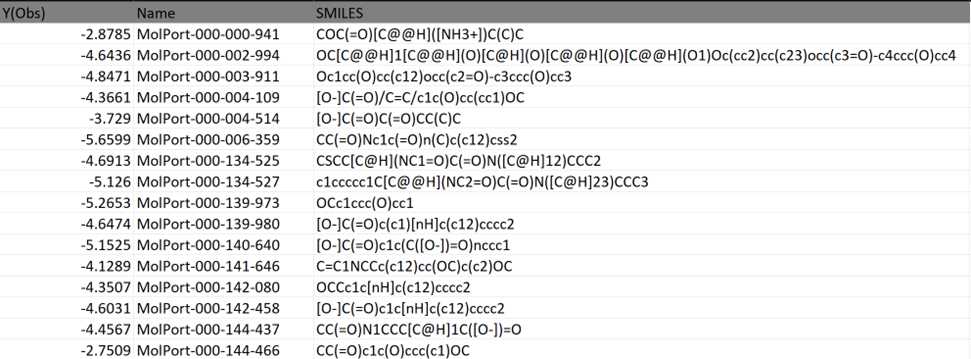
The processed dataset looks as follows:

DATA PRE-PROCESSING
SMILES to graph conversion
Data preprocessing is a pivotal step in this model. Each molecule represented by a SMILES string is converted into a graph, with atoms as nodes and chemical bonds as edges. This graph representation is essential for the GNN to accurately interpret molecular structures.
Feature Representation
● Atom Features: Each atom is represented by a one-hot encoded feature vector, indicating the atom type. The model considers four types of atoms (C, O, N, B), leading to a 4-dimensional feature vector for each atom.
● Bond Features: Bonds are characterized by their type (single, double, triple, aromatic) and their inclusion in a ring structure. Each bond is represented by a 5-dimensional feature vector.
| A | B |
|---|---|
| Feature | Dimensions |
| One-hot encoding of atom types (C, O, N, B) | 4 |
| Edge features for bond types (single, double, triple, aromatic) | 4 |
| Edge features for bond presence in a ring structure | 1 |
| Atom features for atom presence in a ring structure | 1 |
| Bond indices for atom connectivity | 2 per bond |
Using RDKit library for feature representation
So, to represent all these features, we utilize the functionalities of the RDKit library. The function converts a SMILES string into a molecular graph, encoding atom types using one-hot encoding and representing bonds with their types and ring membership.


MODEL TRAINING AND EVALUATION
Model defining and training
Define the models and train with early stopping along with appropriate parameters.
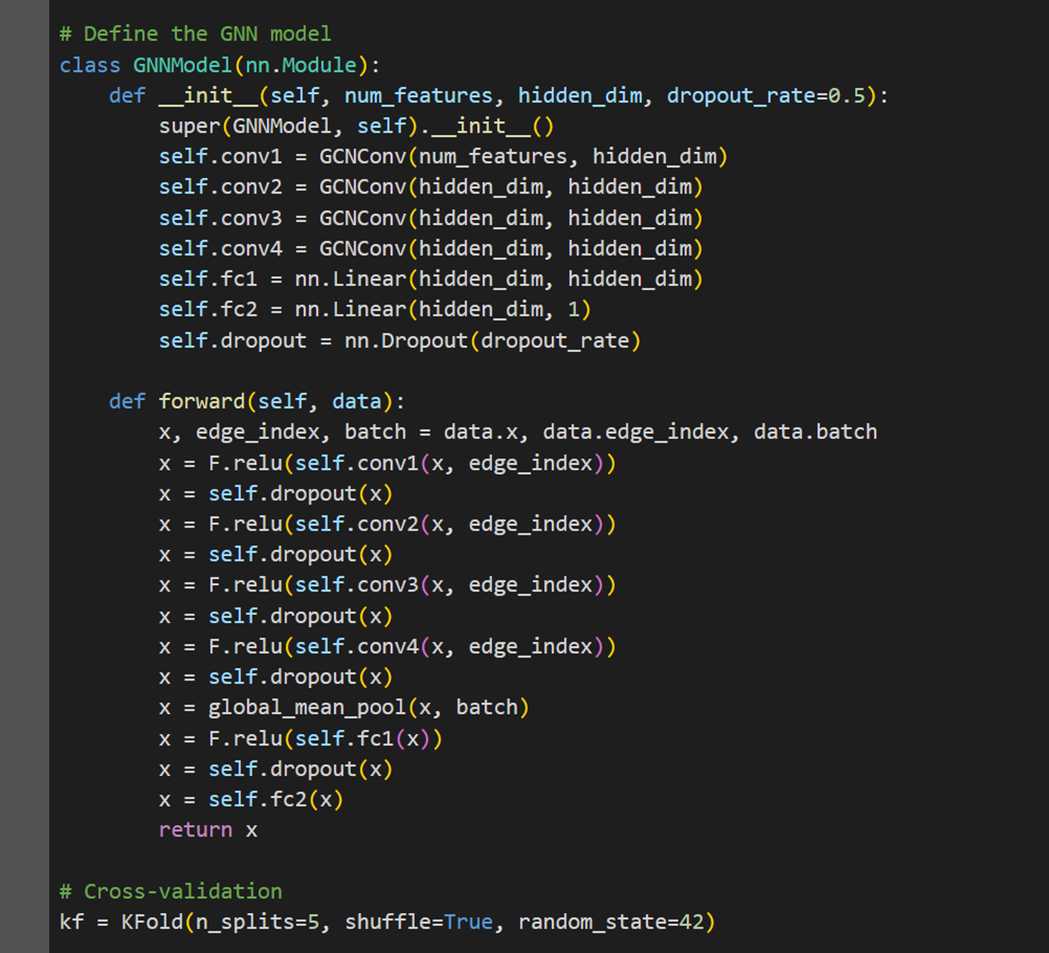
MODEL 1- GRAPH CONVOLUTION NETWORK (GCN)
The first model we explore is a Graph Convolution Network (GCN) with 2 convolution layers.

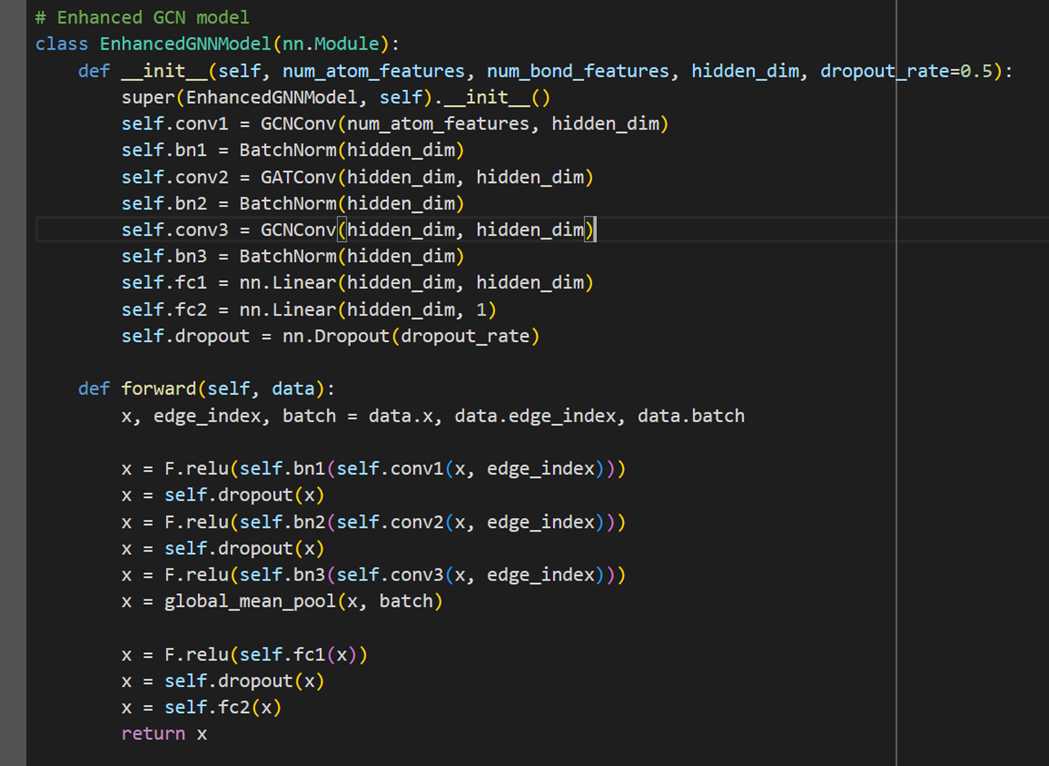
MODEL 2- HYBRID GCN
The second model we explore is a hybrid GCN model:

5-fold cross validation
Utilizing 5-Fold cross-validation for training enhancing its robustness and reliability. This method ensured a comprehensive evaluation by systematically partitioning the data into distinct subsets for both training and validation.
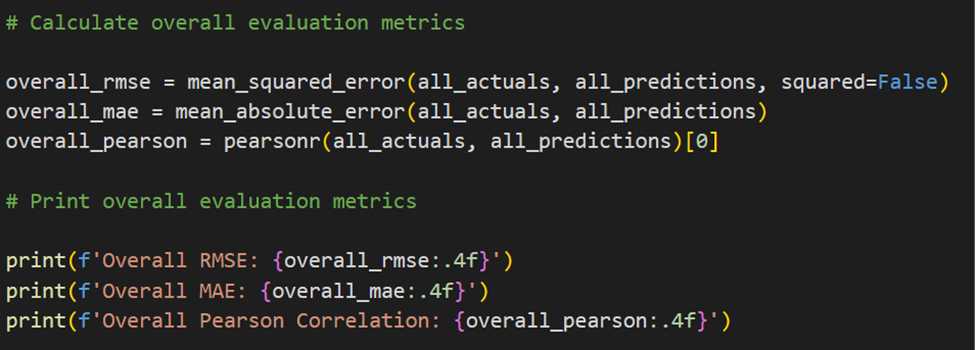

The model's performance was further evaluated using metrics like Root Mean Squared Error (RMSE) and Mean Average Error(MAE), providing insights into its predictive accuracy and overall performance.
PICKING THE BEST MODEL AND UPLOADING IN REPOSITORY
The best possible model was picked and the weights were saved. Then, these weights were uploaded onto the Streamlit repository.
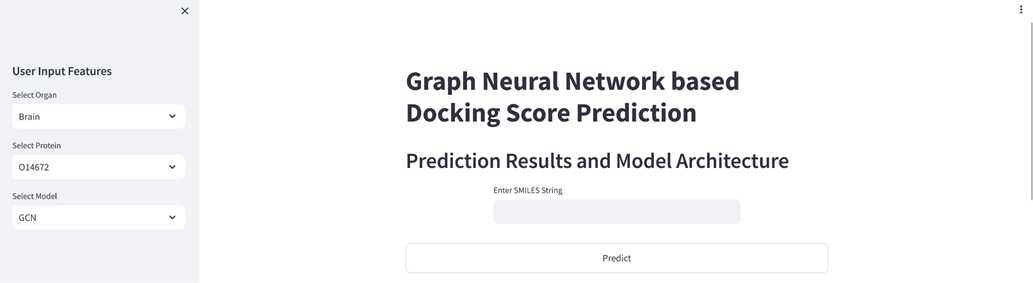
These same steps were repeated across different proteins, datasets and models to integrate all models from each human organ into a single platform.

CONCLUSION
This protocol briefs the steps required to integrate all predicted QSAR data from each organ into a single, all-in-one platform for all human organs and proteins associated with them, to enable users to provide a SMILES structure and estimate the predicted docking score after mapping with the integrated models. Data pre-processing is the primary step in this protocol, followed by creation of analytical dataset for conversion into graphs. Advanced machine and deep learning technique called the graph convolution network (GCN) is shown as model 1, where high dimensional data is converted to low dimensional data and the graphs are correlated to the target variables (in this case, docking scores). The hybrid model, shown as model 2, also adds an additional concept of attention mechanism, that employs positional encoding along with traditional GCN. The web-application allows users to choose which model to utilise for their prediction. This protocol allows for the direct binding affinity predictions of small molecules to important proteins in the human organs, thereby, providing an overall safety information on the small molecules.
ACKNOWLEDGEMENTS
The authors thank Mr. Akshay Uttarkar for providing inputs throughout.
