GC/MS Method for the Detection of Terbufos, Diazinon and Parathion in Blood
Christina Wilson-Frank, Michael Ewbank
Disclaimer
Reference to any commercial materials, equipment, or process does not in any way constitute approval, endorsement, or recommendation by the Food and Drug Administration.
Abstract
Scope
This is a multi-residue method for the detection of the organophosphate pesticides, terbufos, diazinon and parathion in blood by gas chromatography and mass spectrometry (GC/MS). This is a qualitative screening method intended to isolate and concentrate organophosphate pesticides from sample extracts for GC/MS confirmation. This method also allows for adequate separation and detection of 42 other organophosphorus, carbamate and organochlorine pesticides.
In this multi-residue method, pesticides are extracted from blood samples in acetonitrile and isolated using a dual-layer, ENVI-Carb-IITM/PSA solid-phase extraction procedure. The pesticides are subsequently separated and detected using gas chromatography and detected using electron-impact mass spectrometry.
Table 1. Instrument and Method Limits of Detection
| A | B | C | D |
|---|---|---|---|
| Instrument LOD* | Method LOD** | Method Assurance Levels*** | |
| This is the lowest concentration of analyte, which can be detected in solvent. Procedure: Solvent is spiked and injected into GC/MS directly | This is the lowest concentration of analyte which can be detected in blood. Procedure: Blood is spiked and processed though the method’s extraction protocol | These levels can be observed with a higher degree of confidence vs. the method LOD levels | |
| Terbufos | 0.2 ppm | 0.3 ppm | 1 ppm |
| Diazinon | 0.2 ppm | 0.2 ppm | 1 ppm |
| Parathion | 0.2 ppm | 0.2 ppm | 1 ppm |
*Instrument limits of detection (LODs) are specific to the type of instrument used and therefore, can impact the method LODs. Hence, instrument and method LODs may need to be established in-house by each collaborating laboratory.**Method levels of detection are levels of the analytes that can be detected that have been reported in cases of chronic exposure in animals. The ability of the method to detect analytes at these low levels may make the method suitable for research purposes in addition to diagnostic analyses.***The method assurance levels are in the appropriate range for identifying the analytes at concentrations in the blood which could be related to adverse clinical signs in cases of acute toxicity (i.e. when clinical signs appropriate for acute exposure to these insecticides are present in animals).
Method validation/evaluation/verification:
In-house method validation data and evaluation by an independent laboratory (Vet-LIRN) in collaborative multi-laboratory studies
Attachments
Steps
Preparation of Pesticide Standards and Spiking Solutions
Preparation of 20 ppm terbufos, diazinon and parathion mixed pesticide standard solution
Record manufacturer, manufacturer part number, lot number, and expiration date for all standards and reagents in laboratory notebook.
Pipet 1.50mL of acetonitrile:toluene (3:1) into a 5 mL glass vial.
Transfer 0.75mL of each of the 100 ppm terbufos, 100 ppm diazinon and 100 ppm parathion. Label on the 5 mL glass vial should include contents, expiration date, laboratory notebook reference, analyst initials and hazard communication designations. The expiration date for the solution should be the earliest expiration date of the two reagents/standards used.
Cap and vortex mix well.
The 20 ppm mixed standard solution is stable for up to 5 weeks when stored at refrigeration temperature and for 24 hours at room temperature.
Extraction Solution and Standard Diluent Preparation
Preparation of acetonitrile:toluene (3:1) solution:
Transfer 600mL of acetonitrile to 1L graduated cylinder.
Add 200mL of toluene to the 1L graduated cylinder containing the acetonitrile.
Transfer contents to a properly labeled 1L glass storage bottle and store at room temperature.
Label should include contents, expiration date, laboratory notebook reference, analyst initials and hazard communication designations. The expiration date for the solution should be the earliest expiration date of the two reagents/standards used.
Preparation of 1 ppm terbufos, diazinon, and parathion mixed standard solution:
Record all pertinent information regarding the standard stock solution in laboratory notebook.
Aliquot2.00mLof acetonitrile:toluene (3:1) into a 5 mL glass vial.
Transfer 106µL of the 20 ppm terbufos, diazinon, and parathion mixed standard solution prepared above. Label on the 5 mL glass vial should include contents, expiration date, laboratory notebook reference, analyst initials and hazard communication designations. The expiration date for the solution should be the earliest expiration date of the two reagents/standards used.
Cap and vortex mix well.
The 1 ppm mixed standard solution is stable for up to 3 weeks when stored at refrigeration temperature and for 24 hours at room temperature.
Control Samples
Negative control: Negative control blood must be a blood sample that is absent of pesticides. Transfer 2mL of blood to a properly labeled, 15 mL polypropylene tube. Proceed to step 6.2.
Positive control : Positive control blood is negative control blood that is fortified with a known concentration of pesticides. Transfer 2mL of blood to a properly labeled test tube and add 106µL of the 20 ppm terbufos, diazinon, and parathion mixed standard solution to obtain a spike level of 1 ppm. Proceed to step 6.2.
Procedure for Samples
Sample Extraction Procedure:
Aliquot 2mL of blood sample into a properly labeled 15 mL polypropylene tube. Record sample ID, sample volume and any other pertinent information in laboratory notebook.
Proceed with SPE clean-up procedure.
Add 4mL acetonitrile to the sample and vortex mix for approximately 0h 1m 0s.
Centrifuge sample at approximately 4,000 RPM (~ 1500 RCF) for 0h 10m 0s
Aliquot and transfer supernatant to properly labeled 15 mL polypropylene tube.
Add an additional 4mL of acetonitrile to the remaining pellet from step 6.4. Vortex mix for approximately 0h 1m 0s.
Centrifuge sample at approximately 4,000 RPM (~ 1500 RCF) for 0h 10m 0s
Aliquot supernatant and combine with supernatant from step 6.4.
Add 1 g of Na2SO4 to the combined supernatants and vortex mix for approximately 0h 1m 0s to dry the extract. Allow Na2SO4 to settle before proceeding.
Using a disposable glass pipet, transfer all of dried acetonitrile extract to a 15 mL polypropylene tube. (Stopping point: This extract is stable for 24 hours under refrigeration conditions).
SPE Clean-up Procedure:
Condition a multi-layer supelclean ENVI-Carb-II/PSA SPE cartridge (20 or 6 mL capacity) with 5mLacetonitrile:toluene (3:1). Collect the eluate as waste in a properly labeled waste beaker.
Load the acetonitrile extract from above (step 6.9) into the SPE cartridge and collect the eluate in a properly labeled waste beaker.
Elute pesticides from SPE cartridge with 15 mL acetonitrile:toluene (3:1) into a properly labeled 50 mL glass test tube.
Place test tube containing SPE extract in a nitrogen evaporator heating block (set at approximately 40oC) and evaporate eluate to dryness under low nitrogen gas flow. (Stopping point: Dried residue is stable for 24 hours under refrigeration conditions)
Reconstitute residue with0.5mL acetonitrile:toluene (3:1), vortex well to reconstitute entire residue and transfer to spin-x microcentrifuge tubes with nylon filters.
Vortex tubes for 0h 0m 30s. Transfer the filtrate to a properly labeled GC/MS autosampler vial containing a vial insert. (Stopping point: This solution is stable for 24 hours under refrigeration conditions)
Proceed to GC/MS analysis
GC/MS Analysis for the Detection of Pesticides
Instrument Parameters:
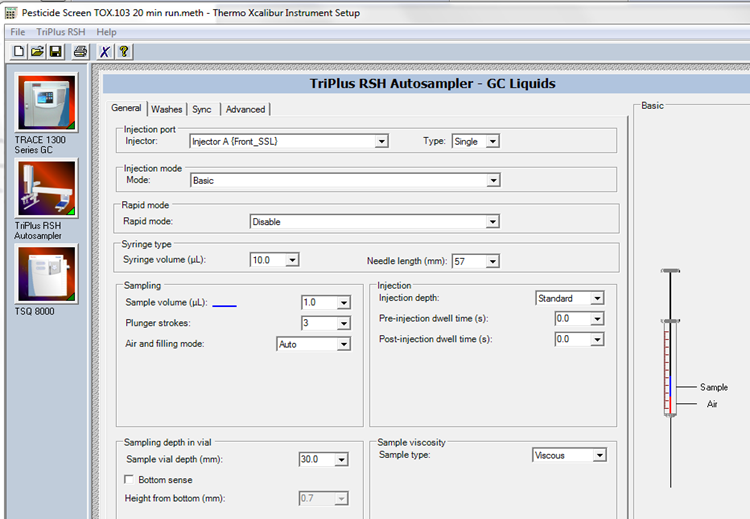
Inject 1µL of the reconstituted sample extract into a GC/MS that is equipped with a triple quadrupole mass spectrometer under conditions found in Table 1.
Initial results have shown that the use of an ion-trap mass spectrometer has significantly higher instrument and method LODs when compared to using triple quadrupole MS.
Table 1: Instrument Parameters for GC/MS for the Detection of Terbufos, Diazinon, and Parathion in Blood Samples
| A | B | C |
|---|---|---|
| GC Parameters | ||
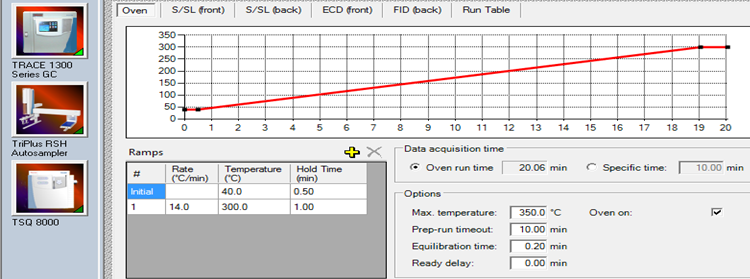
| Initial Oven Temp and Hold | 40 °C for 0.5 min | |
| Final Oven Temp and Hold | 300 °C for 1.0 min | |
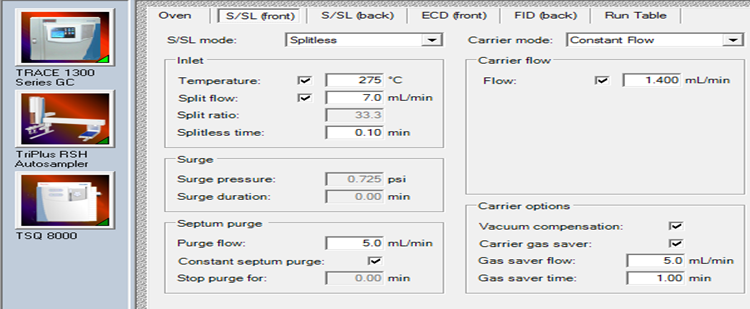
| Injector Temp | 275 °C (splitless) | |
| Carrier Gas Flow | 1.4 ml/min | |
| Injection Volume | 1 µL | |
| Column | ThermoFisher TR-5 MS | |
| Column Size | 30 m X 0.25 mm | |
| Column Film Size | 0.25 µL | |
| Rinse for Autosampler | Toluene | |
| MS Parameters | ||
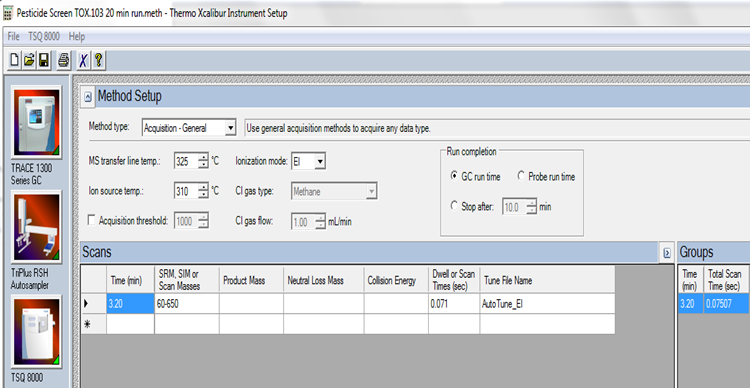
| Transfer Line Temp | 325 °C | |
| Ion Source Temp | 310 °C | |
| Ionization Mode | EI | |
| Scan Range | 50-650 m/z | |
| Quadrupole Temp | ||
| MS Type | Triple Quadrupole |
Acceptance Criteria to Determine the Presence of the Pesticide:
The retention time needs to be within 3% of the retention time of the positive controls or the 1 ppm standard solution. (See Table 2 for more information)
Table 2: Retention Time (RT) Information for Pesticides
| A | B | C | D |
|---|---|---|---|
| Pesticide | Approximate RT* (Minutes) | Relative RT** (Minutes) | |
| Terbufos | 13.20 | 1.000 | |
| Diazinon | 13.17 | 1.012 | |
| Parathion | 14.60 | 1.121 | |
| Myristic Acid (FA) | 12.73 | 0.978 | |
| Palmitic Acid (FA) | 14.20 | 1.091 |
- RT can differ with changing column**Notes: The relative retention time is the comparison of the approximate retention time of one pesticide relative to the retention time of another. This value can serve as a predictor of anticipated retention times for other analytes in a given GC run. For example, if a GC analysis of the pesticides indicated that the retention time of terbufos for that run is 12.98 minutes, then multiplying 12.98 minutes by 1.012 would provide an approximate retention time to be expected for diazinon at 13.14 minutes.
The signal-to-noise (S/N) ratio for pesticide needs to be greater than 3 RMS.
All observed ions need to be present (See Table 3 for more information).
Table 3: Ions Monitored for the Detection of Terbufos, Diazinon, and Parathion | A | B | | --- | --- | | Pesticide | Observed Ions | | Terbufos | 231 103 153 | | Diazinon | 137 179 152 199 | | Parathion | 109 139 291 |
- Major ions monitored to detect each pesticide are listed in bold above.
The relative ion intensities for secondary ions monitored need to be within 30% of the major ion observed for each pesticide when compared to ions in the positive control sample or the 1 ppm mixed standard
solution.
High concentration of fatty acids may interfere with the method performance and therefore need to be monitored. See Appendix 1 for details.
Appendix 1
To reduce the false negative observations, expanding the acceptance criteria ranges was explored and resulted in the following:
- The retention time shall be within 3% of the retention time of the positive controls or the 1 ppm standard solution.
- The signal-to-noise (S/N) ratio for terbufos shall be greater than 3 RMS.
- The ions 231 m/z, 103 m/z and 153 m/z shall be present for terbufos.
- One of the relative intensities for ion 103 m/z or 153 m/z shall be within 30 % of the major ion o
An “Alert Criteria” was established to determine if a false positive result could be suspected for this method. This concern stems from the possibility of co-eluting peaks with m/z values of 103 and 153 from
blood matrix interferences. For this particular method that could not be successfully achieved due to co-elution peaks (103 and 153) from the blood matrix.
- The “Alert Criteria” is the ratio of the sum of the S/N ratios of the fatty acids myristic and palmitic acid divided by the S/N of terbufos peak. See equation 1 below.
S/N for Myristic Acid peak + S/N for Palmitic Acid peak
Alert Criteria= ---------------------------------------------------------
S/N for Terbufos peak
Studies were completed to determine what could influence intensities or the amount of terbufos after extraction and clean-up procedures. The first study included examiningdifferent lot
numbers of blood determine their effects on terbufos intensities. These findings were significant.

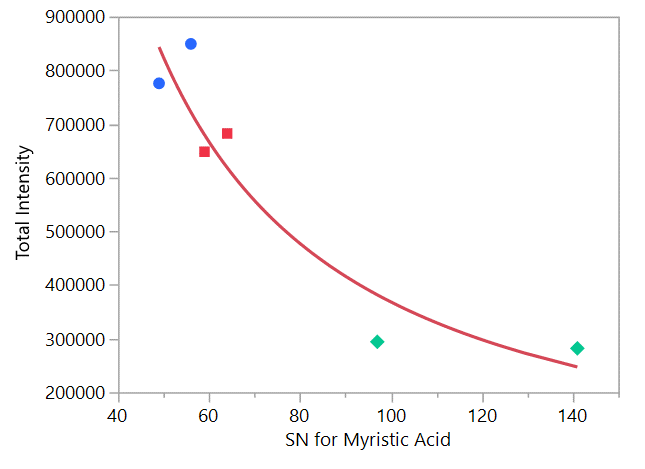
The intensities were then correlated with the S/N ratio for myristic acid. This correlation was also found to be significant.
A main effects screening design for water and its removal was completed to determine their influences on the process. All samples were spiked with 0.3 ppm of terbufos, diazinon, and parathion. However, the identification of terbufos was the focus. This study showed the amount of water and the amount of Na2SO4 used was significant to fatty acid removal. The lot number of the blood control and time the Na2SO4 was added were found not to be significant in the removal of fatty acids.
Further statistical examination revealed differences in identification probabilities related to the sum of the S/N ratio of the fatty acids, however there were samples that did not correlate with these criteria, apparently due to baseline variations. To account for these differences in the baseline, the S/N ratio for terbufos was introduced into the equation to eliminate baseline variability.
<img src="https://static.yanyin.tech/literature_test/protocol_io_true/protocols.io.j8nlkw83dl5r/k3kfbwgmf2.png" alt="Figure 4: The “Fatty Acid to Terbufos Ratio (SN)” versus “Identification” for Terbufos with one-way analysis. Since all samples were spiked with terbufos, an indicator of "absent" is incorrect while "present" is correct." loading="lazy" title="Figure 4: The “Fatty Acid to Terbufos Ratio (SN)” versus “Identification” for Terbufos with one-way analysis. Since all samples were spiked with terbufos, an indicator of "absent" is incorrect while "present" is correct."/>
In summary, the removal of key saturated fatty acids appears to be important in identifying terbufos at low levels in bovine, blood samples. Levels of fatty acids can fluctuate by the amount of water, amount of sodium sulfate, and the blood from the particular animal. The levels can fluctuate from sample to sample due to what may carry forward into the clean-up step of the work-up procedure.
Possible solutions to help reduce the fatty acid concentrations during the preparation of the sample:
- Switch from sodium sulfate to magnesium sulfate as previous research has shown sodium sulfate is not as effective drying agent for acetonitrile solutions.
- Change the extraction/elution solvents during the process.Solutions in published literature include using acetone, acetone:toluene (65:35), and acetone:cyclohexane (various compositions) with the current SPE cartridges containing PSA.
Appendix 2. Pesticide SOP TOX.103 Software and Instrument Details
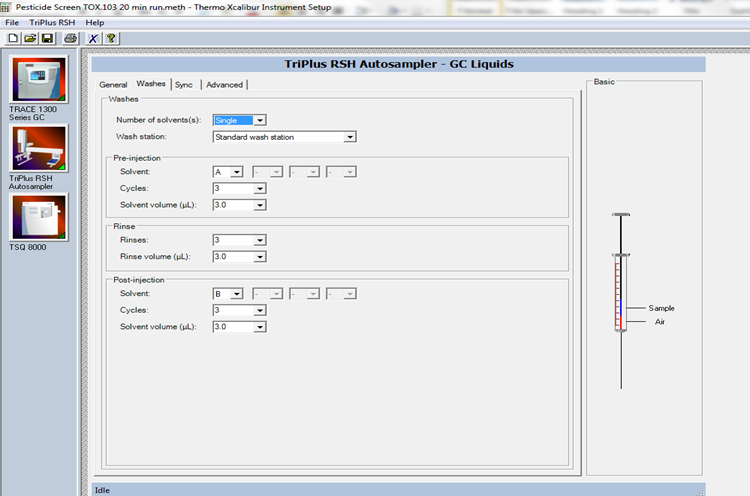
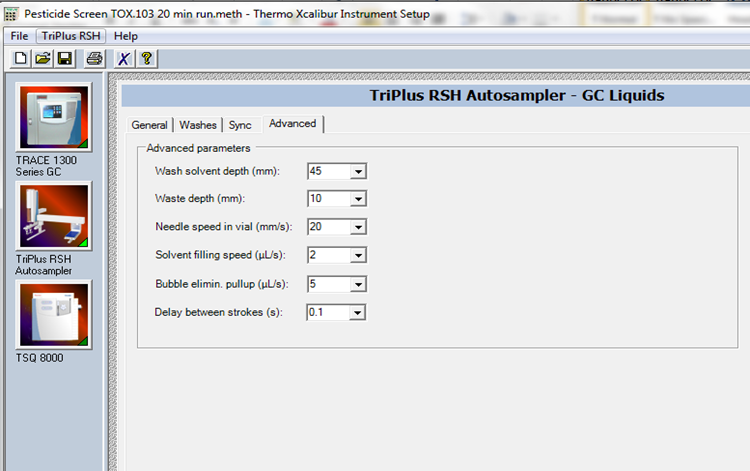
The figures are examples for using Xcalibur at the Purdue University ADDL. These screen shots are subject to change and are not representative of other software.
GC/MS Instrument Control Method: Pesticide Screen Tox.103 20 min
- Inject
1µLof reconstituted sample extract into GC/MS (GC/MS operating system is equipped with Trace 1310 gas chromatography/TSQ 8000 mass spectrometer and TriPlus RSH autosampler) under the conditions found in Table 1 using the Xcalibur software system. These conditions should currently be in the method entitled "TOX.103 20 min." - If method "TOX.103 20 min" cannot be found or needs to be modified, then follow the instructions below.
GC Conditions and Settings
MS Conditions and Settings
Analyzing Samples in System Control (Xcalibur)
Open “Xcalibur” by double-clicking the “Xcalibur” icon. Double-click on “Qual Browser” to create the data file for your analysis.
Injection Volume: 1.0 (1 µL).
Once sample set information has been entered, go to “File” --> “Save As” --> and type in the name of the method to save the method file in XCalibur --> Methods --> FDA Vet-LIRN Grant Method Files. Make sure to include the date, description, and notebook number and pages.
With Qual Browser open, go to “File” --> “Open.” The “Open Raw File” window will be displayed.
Right click inside the list of files and create a new folder (“New” --> “Folder”). Name the data file with the date and any descriptors. Once the data folder is created, exit out of Qual Browser
Sample type: Select one from the drop-down box
- Unknown: This is selected for all samples and extracted samples.
- Blank: This is for all blank vials (e.g. containing acetonitrile: toluene (3:1) method blank vials).
- QC: This is for positive, negative, and internal control samples.
- Std Bracket: This is for neat/pure standard injections.
File name: Enter name of sample, standards or control vials used (cannot use spaces).
Path: Select the data folder previously created in Qual browser.
Instrument Method: Select “Pesticide Screen Tox.103 20 min run”
Position: Enter the position number for the vial placed in the auto sampler tray
Viewing and Processing Data using Qual Browser in Xcalibur: Viewing and Processing Data using Qual Browser in Xcalibur
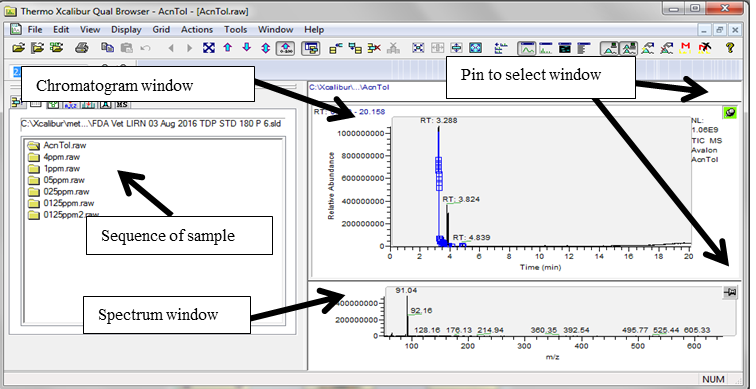
Go to “Road Map View” in XCalibur and double-click on the “Qual Browser” icon. Select “File" --> “Open Sequence” --> then select the sequence file for that sample set.
Click and select the pin (turns green on selection) on the top right corner of the chromatogram to allow viewing and zooming of the chromatographic data.
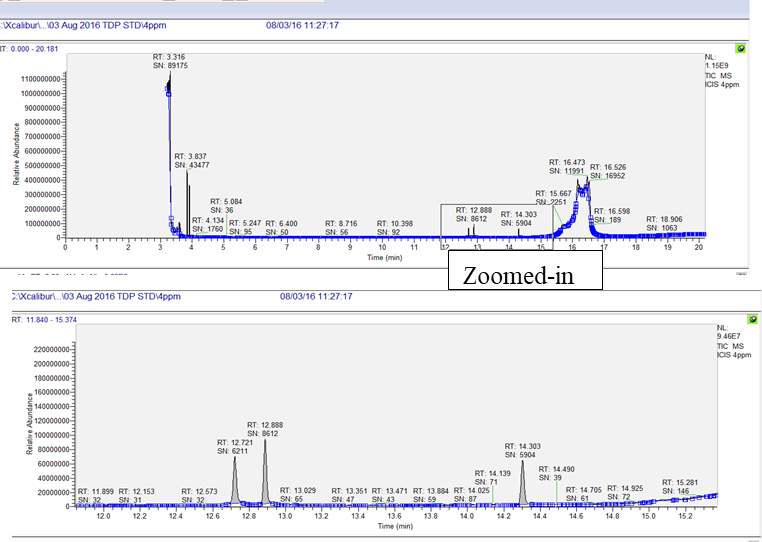
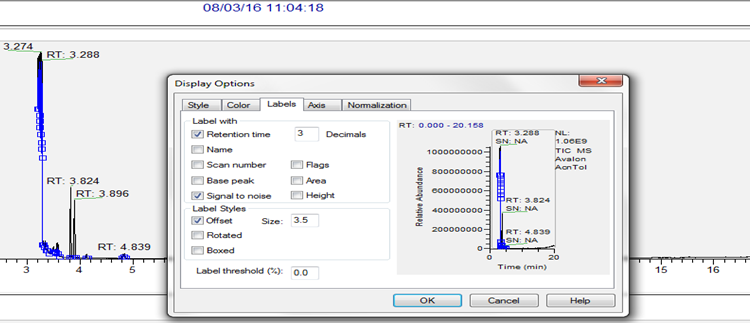
Then, right click in the top window (chromatogram) and select “Display Options.” Another window will be opened for the display options --> select the tab labeled “Labels.” Check the boxes for “Signal-to-Noise,” and “Retention Time” --> Then select “OK.”.
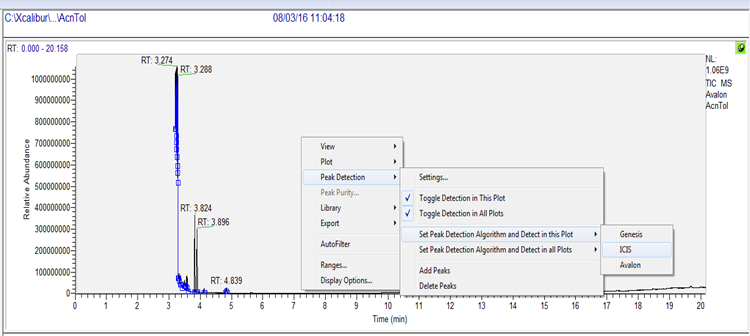
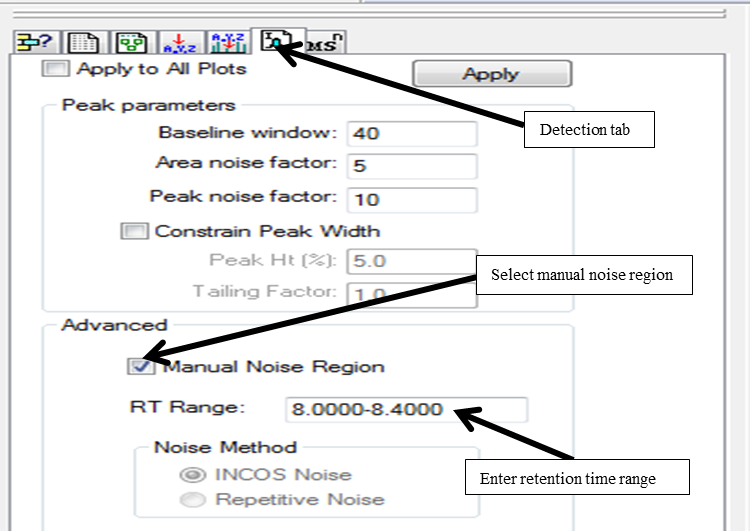
When peak detection is selected, “Detection tab” button appears (letter ‘I’ in the button stands for ICIS detection algorithm selected earlier). Select the detection tab, check “Manual noise region” and enter the retention time range to be used for calculating signal-to-noise region.
Viewing and Processing Data using Qual Browser in Xcalibur: · Viewing and Processing MS Data
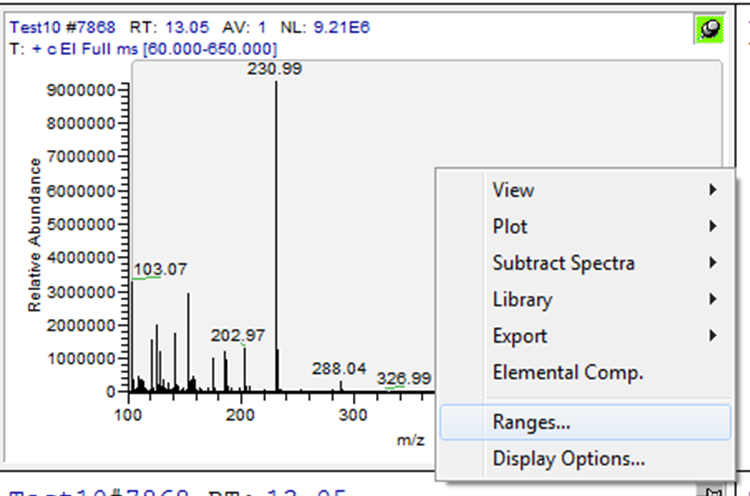
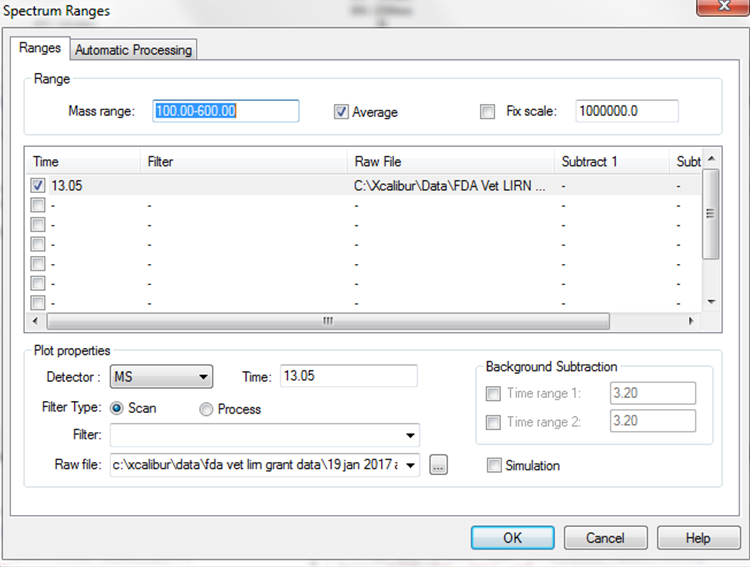
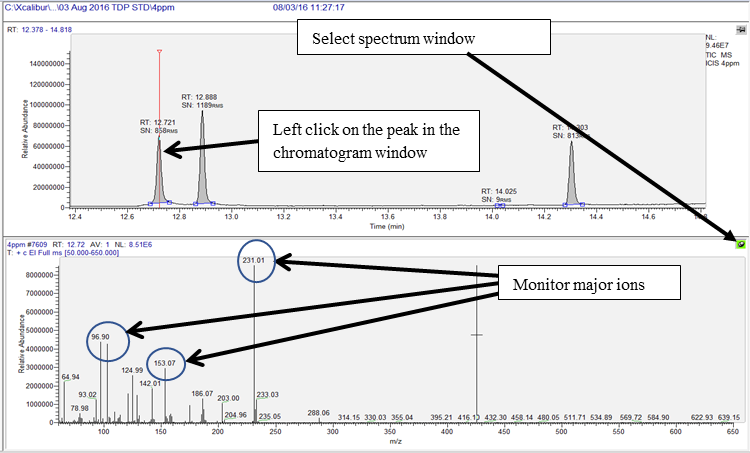
Select the MS window by clicking on the pin (turns green on selection) on the top right corner of the MS window (bottom window) to allow matching the spectrum and the major ions in the spectral list for confirming identity of the analytes of interest.
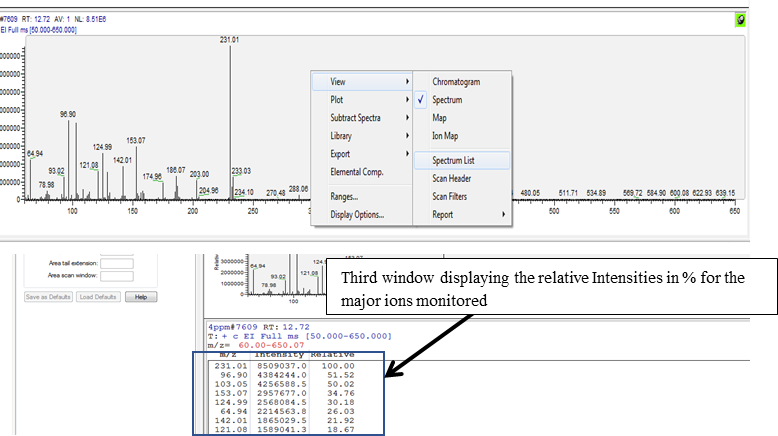
Left click over the peak of interest from the chromatogram and match the major ions to be monitored for the analyte of interest from the spectral window. For example, peak seen at RT 12.72 min, selection of this peak shows the spectrum with presence of the major ions m/z 231, m/z 103 and m/z 153 (circled in blue in the bottom window of the image below).
Process the MS data for all the analytes by selecting the peak of interest in the chromatogram window as shown in steps above.


