Discovery proteomic (DIA) LC-MS/MS data acquisition and analysis
Yan Chen, Jennifer Gin, Christopher J Petzold
Disclaimer
This protocol is for research purposes only.
Abstract
This protocol details steps in discovery proteomic data-independent acquisition with a standard-flow UHPLC-Obitrap system and a subsequent DIA-NN library-free database search. The data acquisition method was adapted from González Fernández-Niño, S. M., et al. "Standard flow liquid chromatography for shotgun proteomics in bioenergy research." Frontiers in bioengineering and biotechnology, 3 (2015): 44.
Before start
Prepare the following solvents:
Needle wash solvents: Add 100mLinto 900mL.
Solvent A: Add 0.1% volumeinto LC-MS grade water.
Solvent B: Add 0.1% volumeinto LC-MS grade acetonitrile.
Steps
Proteomics: HPLC and Mass Spectromtery
Thaw peptide samples On ice , and transfer 30µLof each sample to LC autosampler vials (Agilent, Cat.#5182-0567,#5182-0564) or 96-well plate (Bio-Rad, Cat.#HSP9655).
Liquid chromatography-tandem mass spectrometry (LC-MS/MS) analysis is performed with a Thermo Orbitrap Exploris 480 mass spectrometer (Thermo Fisher Scientific, San Jose, CA) coupled with an Agilent 1290 Infinity UHPLC system (Agilent Technologies, Santa Clara, CA).
Equipment
| Value | Label |
|---|---|
| Obitrap Exploris 480 | NAME |
| Mass spectrometer | TYPE |
| Thermo Fisher | BRAND |
| BRE725532 | SKU |
Equipment
| Value | Label |
|---|---|
| 1290 Infinity UHPLC | NAME |
| Ultra-high performance liquid chromatography system | TYPE |
| Agilent Technologies | BRAND |
| 1290 Infinity UHPLC | SKU |
Samples were loaded into a temperature controlled autosampler operating at 4°C. The separation on the UHPLC is achieved by using an Agilent InfinityLab Poroshell 120 EC-C18 (2.1 mm ID,100 mm length,1.9 µm particle size, 120-Å pore size) (Agilent, Cat.#695675-902) coupled with an Agilent InfinityLab Poroshell 120 EC-C18 guard column (2.1 mm ID,5 mm length,1.9 µm particle size, 160-Å pore size)(Agilent, Cat.#821725-940). The column is operated at 60°C.
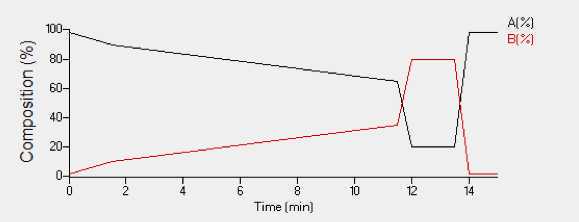
Twenty micrograms 20µg of peptides are loaded onto the column from each sample and separated using a gradient separation with 0.1% formic acid in water (Solvent A) and 0.1% formic acid in acetonitrile (Solvent B) operating at a flow rate of 0.4 ml/min. A 15 minute total acquisition time with a 10 minute linear elution gradient of chromatographic separation is as follows:
| A | B | C | D |
|---|---|---|---|
| Step | %A | %B | Time (minute) |
| 1 | 98 | 2 | 0.0 |
| 2 | 90 | 10 | 1.5 |
| 3 | 65 | 35 | 11.5 |
| 4 | 20 | 80 | 12.0 |
| 5 | 20 | 80 | 13.5 |
| 6 | 98 | 2 | 14.0 |
| 7 | 98 | 2 | 15.0 |
Table 1. Chromatographic gradient table

The eluted peptides were ionized via OptaMaxTM NG Electrospray Ion Source operating in positive ion mode with the following source parameters:
| A | B |
|---|---|
| Vaporizer temp | 250 °C |
| Ion transfer tube temp | 300 °C |
| Positive ion voltage | 3500 V |
| Shealth gas | 50 |
| Aux gas | 20 |
Table 2. Source conditions
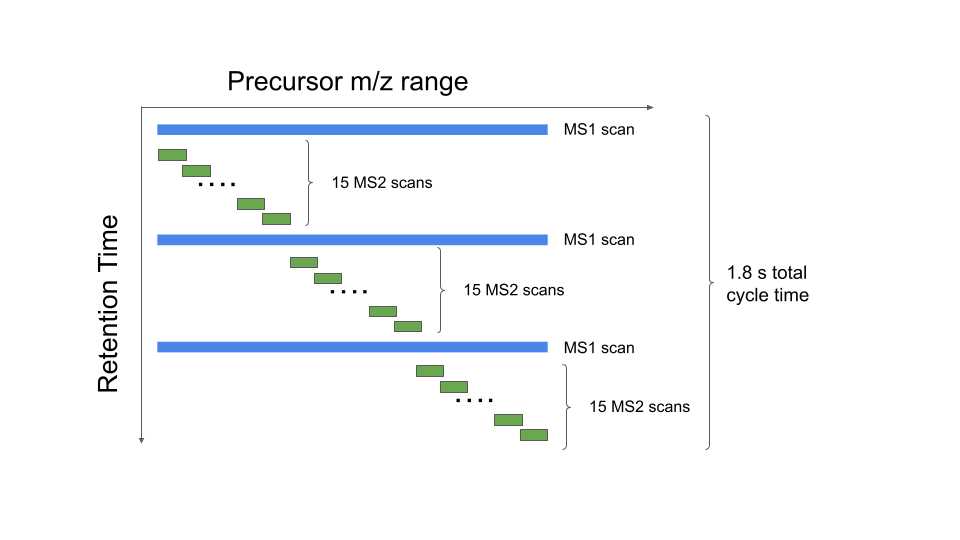
The mass spectrometer is operated in data independent mode with a duty cycle of 3 survey scans and 45 MS2 scans . The survey scan and MS2 scan parameters are as follows:

| A | B |
|---|---|
| Survey scan obitrap resolution | 60K |
| Survey scan MS range | 380 to 985 m/z |
| Survey scan AGC target | 300% |
| Survey scan maximum ion injection time | 45 ms |
| DIA precusor isolation window | 13.5 m/z |
| MS2 scan range | 145 to 1450 m/z |
| MS2 scan obitrap resolution | 15K |
| MS2 scan AGC target | 1000% |
| MS2 scan maximum ion injection time | 22 ms |
Table 3. DIA survey scan and MS2 scan parameters
The MS raw data were acquired using Thermo Scientific Xcalibur version 4.3.73
Software
| Value | Label |
|---|---|
| Thermo Fisher Scientific | NAME |
| Thermo Fisher Scientific | DEVELOPER |
| https://www.thermofisher.com/order/catalog/product/OPTON-30965#/OPTON-30965 | LINK |
| 4.3.73 | VERSION |
The acquired DIA raw data files were analyzed by an integrated software suite DIA-NN v 1.8.1.
DIA-NN configurations for Library-free search and peptide quantification:
| A | B |
|---|---|
| Enzyme | Trypsin |
| Maximum missed cleavages | 1 |
| Precusor and Fragment MS accuricies | Automatically determined |
| Precusor length range | 7-30 |
| Precusor charge range | 2-4 |
| Fixed modifications | Carbamidomethyl (Cys) |
| Variable modifications | Deamination (Asn, Gln); Oxidation (Met) |
| Precusor and protein identificaiton FDR | 1% |
| Quantification strategy | Robust LC |
| Spectral library | Generated from fasta files of latest proteomes at Uniprot |
Main configurations for DIA-NN search in library-free mode
Protein quantity reported by DIA-NN was further processed and visualized using an jupyter notebook described in detail through an established protocol.
Label-free quantification (LFQ) proteomic data analysis from DIA-NN output files
LCMS QC and performance monitoring
The Exploris mass spectrometer is subjected to mass calibration check prior to analyzing samples to verify mass accuracy, intensity, and resolution of ions using Pierce™ FlexMix™ Calibration Solution purchased from Thermo Fisher Scientific.
A weekly mass calibration is performed to maintain <3 ppm mass accuracy without correction from internal calibrant.
The mass spectrometer is subjected to a system calibration at least quarterly (and more frequently, if transmission tune fails, or performance issues arise).
UHPLC-Obitrap system performance is monitored at the beginning, middle, and end of large sample sets by running full LC-MS/MS data collection of 20 ug E.coli cell lysate protein tryptic digest. The protein identification, mass accuracy, peak shape, and resolution of peptides are evaluated.

