Determine the Size of Sonicated Samples and the DNA Concentration

Vasso Makrantoni, Daniel Robertson, Adele L. Marston

Published: 2021-09-22 DOI: 10.17504/protocols.io.bn33mgqn

Abstract

A plethora of biological processes like gene transcription, DNA replication, DNA recombination, and chromosome segregation are mediated through protein–DNA interactions. A powerful method for investigating proteins within a native chromatin environment in the cell is chromatin immunoprecipitation (ChIP). Combined with the recent technological advancement in next generation sequencing, the ChIP assay can map the exact binding sites of a protein of interest across the entire genome. Here we describe a-step-by step protocol for ChIP followed by library preparation for ChIP-seq from yeast cells.

Before start

Use sonicated chromatin samples (step 15 from "Cell Lysis and Sonication") to determine the fragment size.

Steps

Determine the Size of Sonicated Samples and the DNA Concentration

1.

To a 100µL add 80µL containing 300millimolar (mM).

2.

Decross-link at 65°C 0h 0m 30s.

3.

Add 2µL and incubate at 37°C for 1h 0m 0s.

Note
RNase treatment is important as high levels of RNA will interfere with DNA purification when using commercially available PCR purification kits. DNA yield can be markedly reduced as the columns become saturated.

4.

Add 20µL and incubate at 65°C for 2h 0m 0s.

5.

Purify DNA using a PCR purification kit. Run purified DNA on a 2% agarose gel with a 100 bp DNA ladder marker to determine fragment size. Ideally sonication should yield an enrichment of fragments between 200 and 400 bp (Fig. 2a).
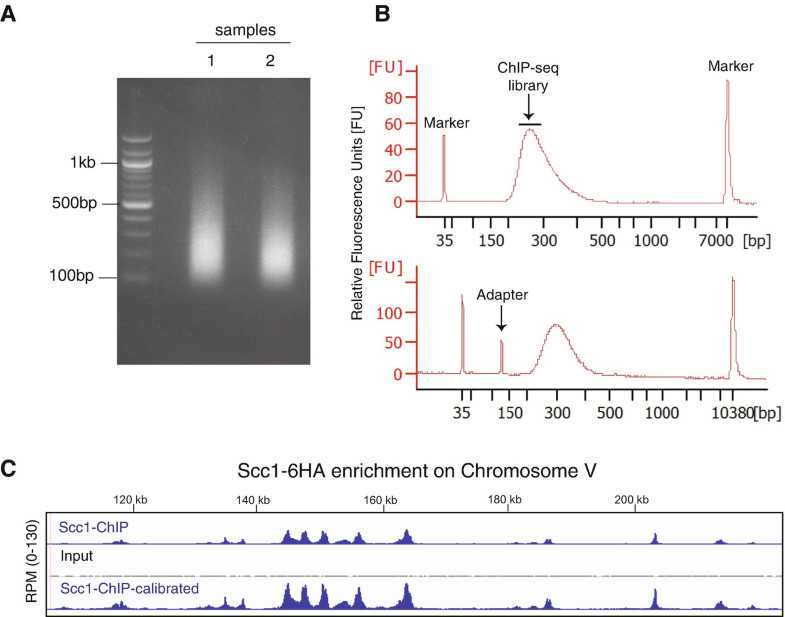
Fig. 2(a) Representative image of mitotic yeast cells sonicated with a Bioruptor Twin (Diagenode) for a 30-min round (power setting: High, 30 s ON/30 s OFF). DNA from two different samples was loaded on a 2% agarose gel with a 100 bp marker ladder. (b) Representative optimal BioAnalyzer trace (upper panel) and contaminated trace with adapter (bottom panel) (c). Examples of profiles generated by chromatin immunoprecipitation followed by sequencing (ChIP–seq) of the cohesin subunit Scc1 in wild-type cells (IP shown in blue; Input shown in grey) and calibrated withS. pombeScc1 distribution in representative chromosome V (IP shown in blue, bottom panel)
6.

Measure DNA concentration using a Qubit HS assay kit.

推荐阅读

Nature Protocols
Protocols IO
Current Protocols
扫码咨询