Aureococcus anophagefferens population count, and relative size (Violet SSC) by flow cytometry (CytoFLEX S Flow Cytometer Beckman Coulter)
Alex Truchon, Steven W Wilhelm, Emily E. Chase
Abstract
A method for obtaining relative cell size, population density, etc., of the brown tide algae Aureococcous anophagefferens by a Violet Side Scatter configuration on a Beckman Coulter CytoFLEX S Flow Cytometry System (CytExpert software).
Before start
Boot up the CytExpert Software and follow the start up protocol. Familiarity with the machine and its setting will permit necessary adjustments for your experiments and help ensure accurate results.
Steps
CytoFLEX Experiment Setup
Create a new experiment with sample acquisition settings as follows:
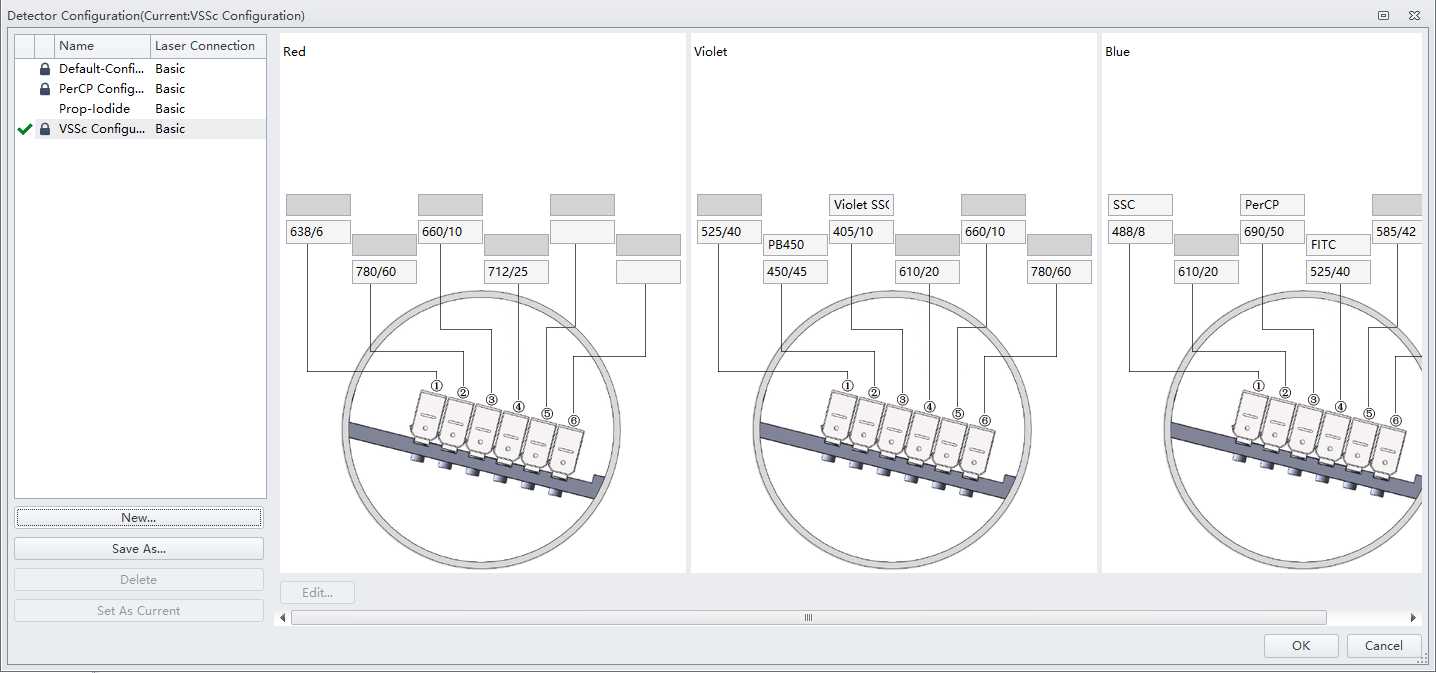
- FSC 200
- SSC 40
- VioSSC 75
- FITC 200
- PerCP 150
- PB450 1 [placeholder; this could be set for a different dye than Pacific Blue shown here, this will not change the results]
- Threshold: (manual) PerCP 5000
Set the flow rate to medium (30 μL/minute), the sampling to 60 seconds (not by events), and the display to 100,000 events.

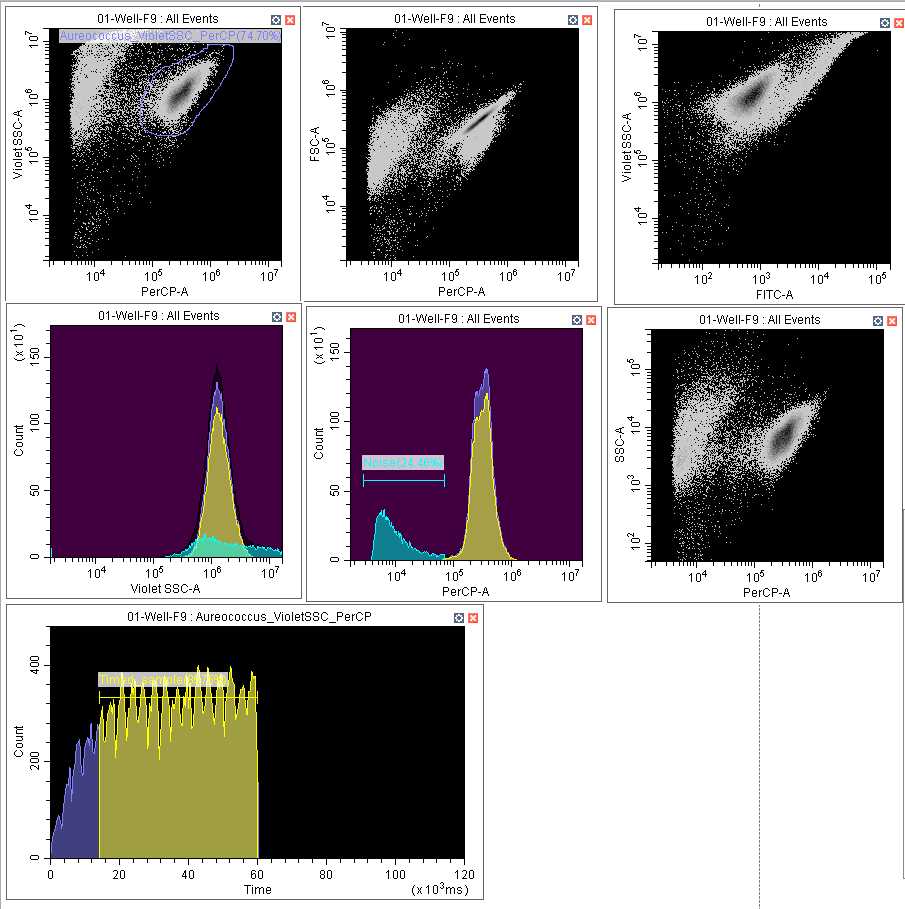
Optional Create a combination of density plots and histograms best suited for your analyses. An example set up is provided in the image below ( Figure 2 ), where A. anophagefferens populations are clearly achieved. It is recommended to set up a histogram with time on the x-axis (final histogram) to account for the machine's measuring consistency as sampling will often start out slower and then stabilize. This can be applied to any gated population you have selected by clicking the text at the top of the histogram and selecting the population within the dropdown menu.

Sampling Process
250 μL of each sample to be measured ( e.g., A. anophagefferens culture) are pipetted into a 96 well CoStar [REF#3795] Assay Plate round bottom plate (can be substituted) and loaded into the CytoFLEX. After opening the "Plate" window and clicking "Add Plate", samples can then be labelled.
Labelled samples can then be run sequentially using the "Auto Record". Upon completion data can be either exported (most conveniently as a .csv) or reviewed using the "Statistics" window according to all events and events within user defined gated populations. Population counts are achieved by number of events within the A. anophagefferens gates, and subsequent relative size of events (cells) can be achieved through Violet Side Scatter channel results.

