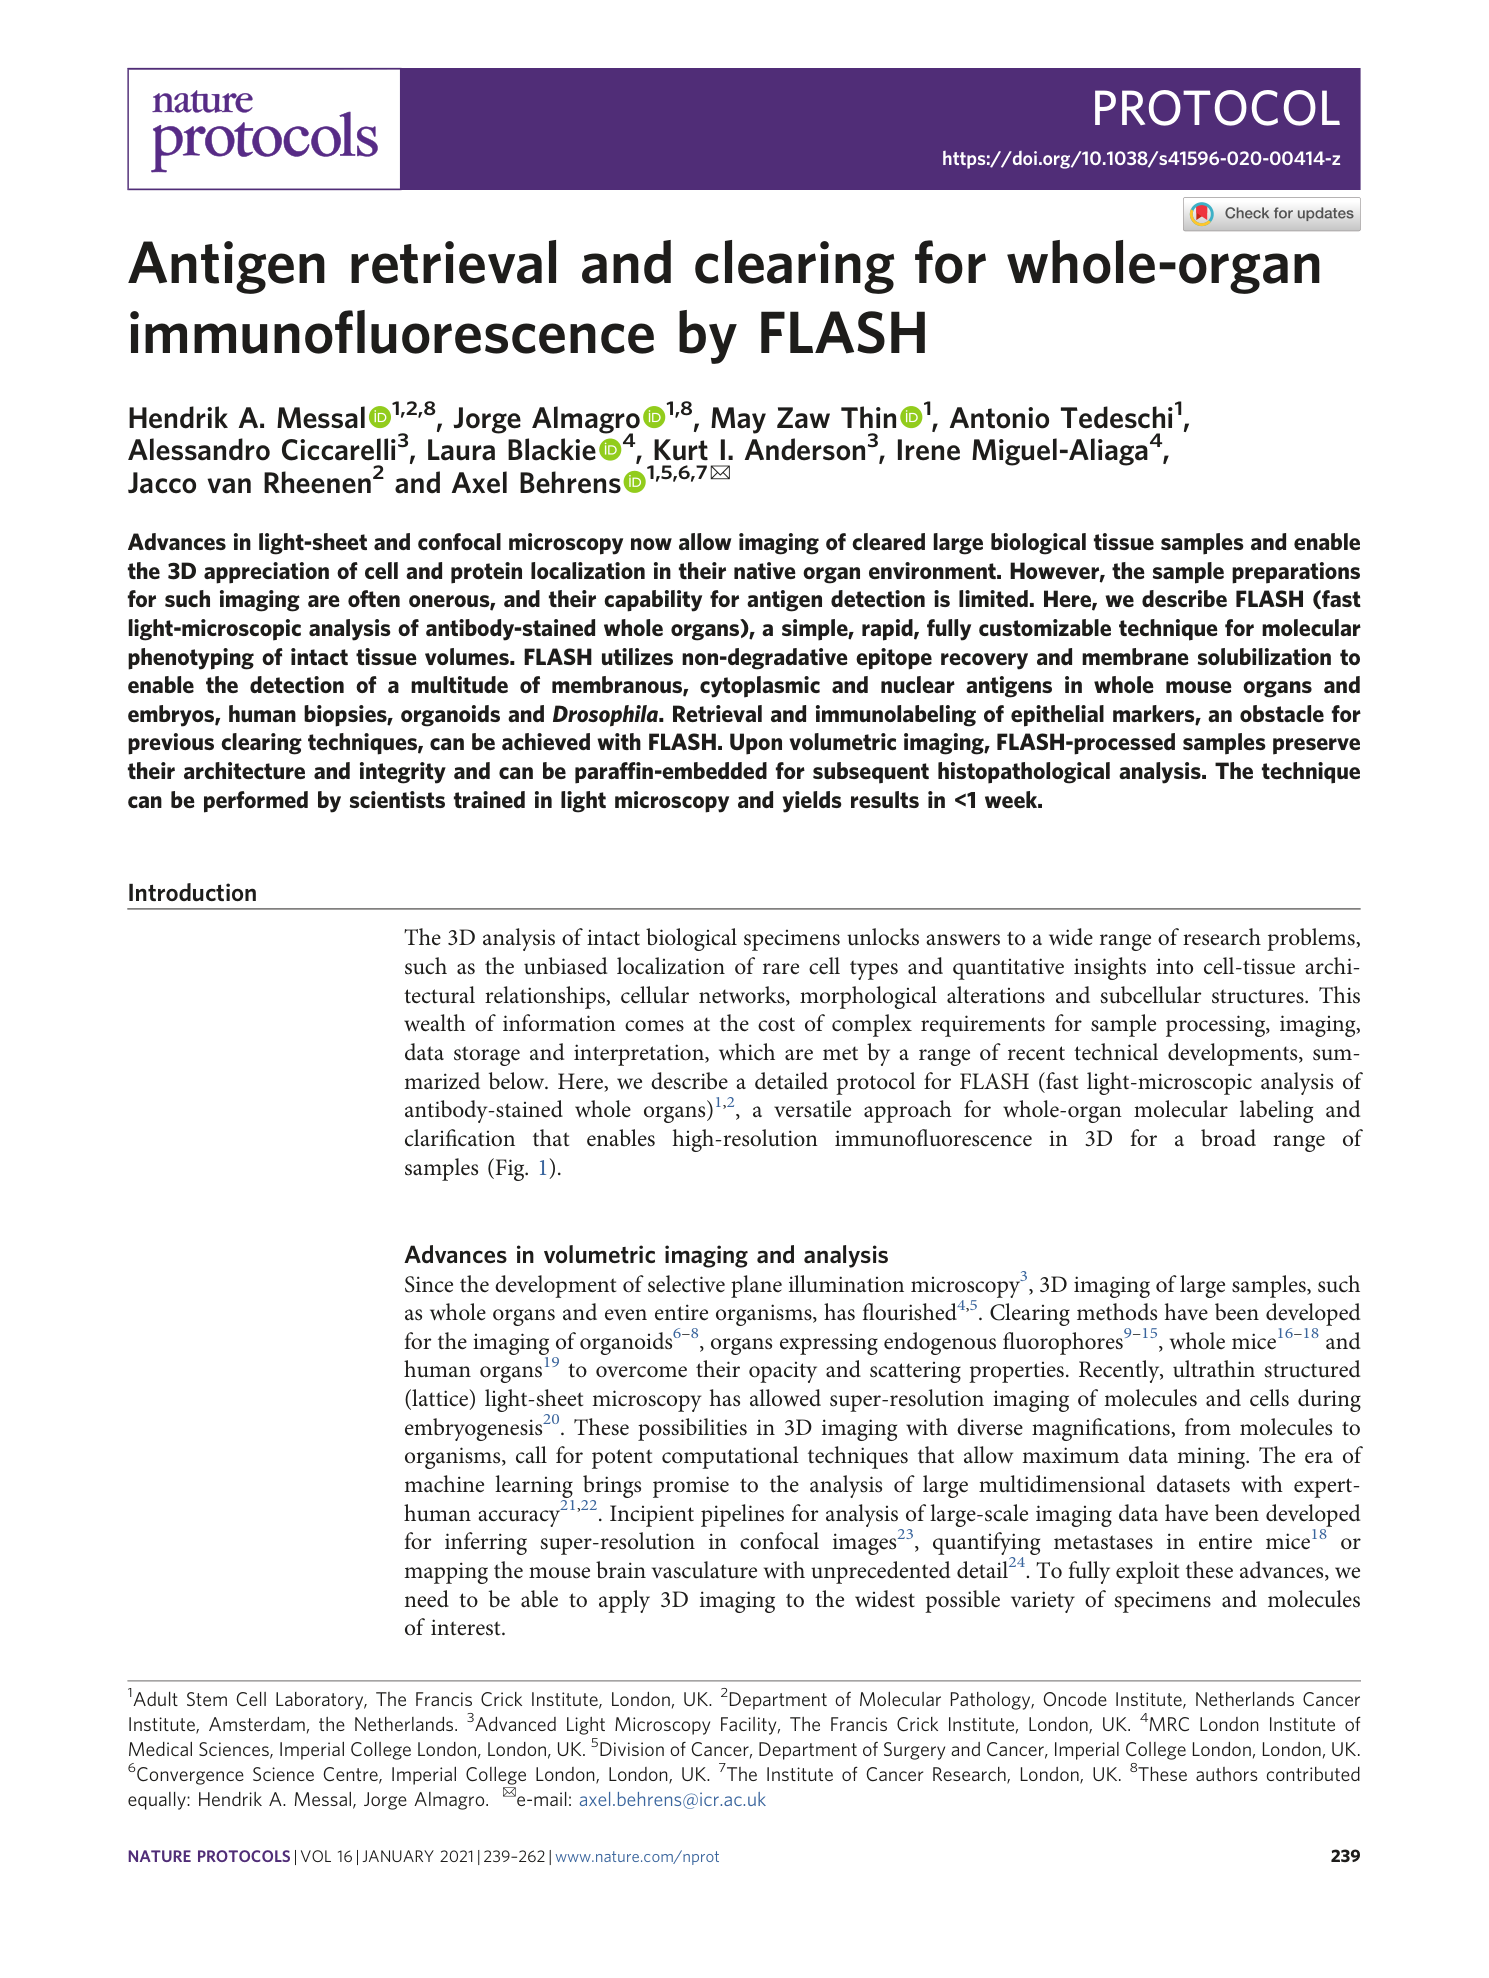
Antigen retrieval and clearing for whole-organ immunofluorescence by FLASH
Hendrik A. Messal, Jorge Almagro, May Zaw Thin, Antonio Tedeschi, Alessandro Ciccarelli, Laura Blackie, Kurt I. Anderson, Irene Miguel-Aliaga, Jacco van Rheenen, Axel Behrens
tissue clearing
light-sheet microscopy
antigen retrieval
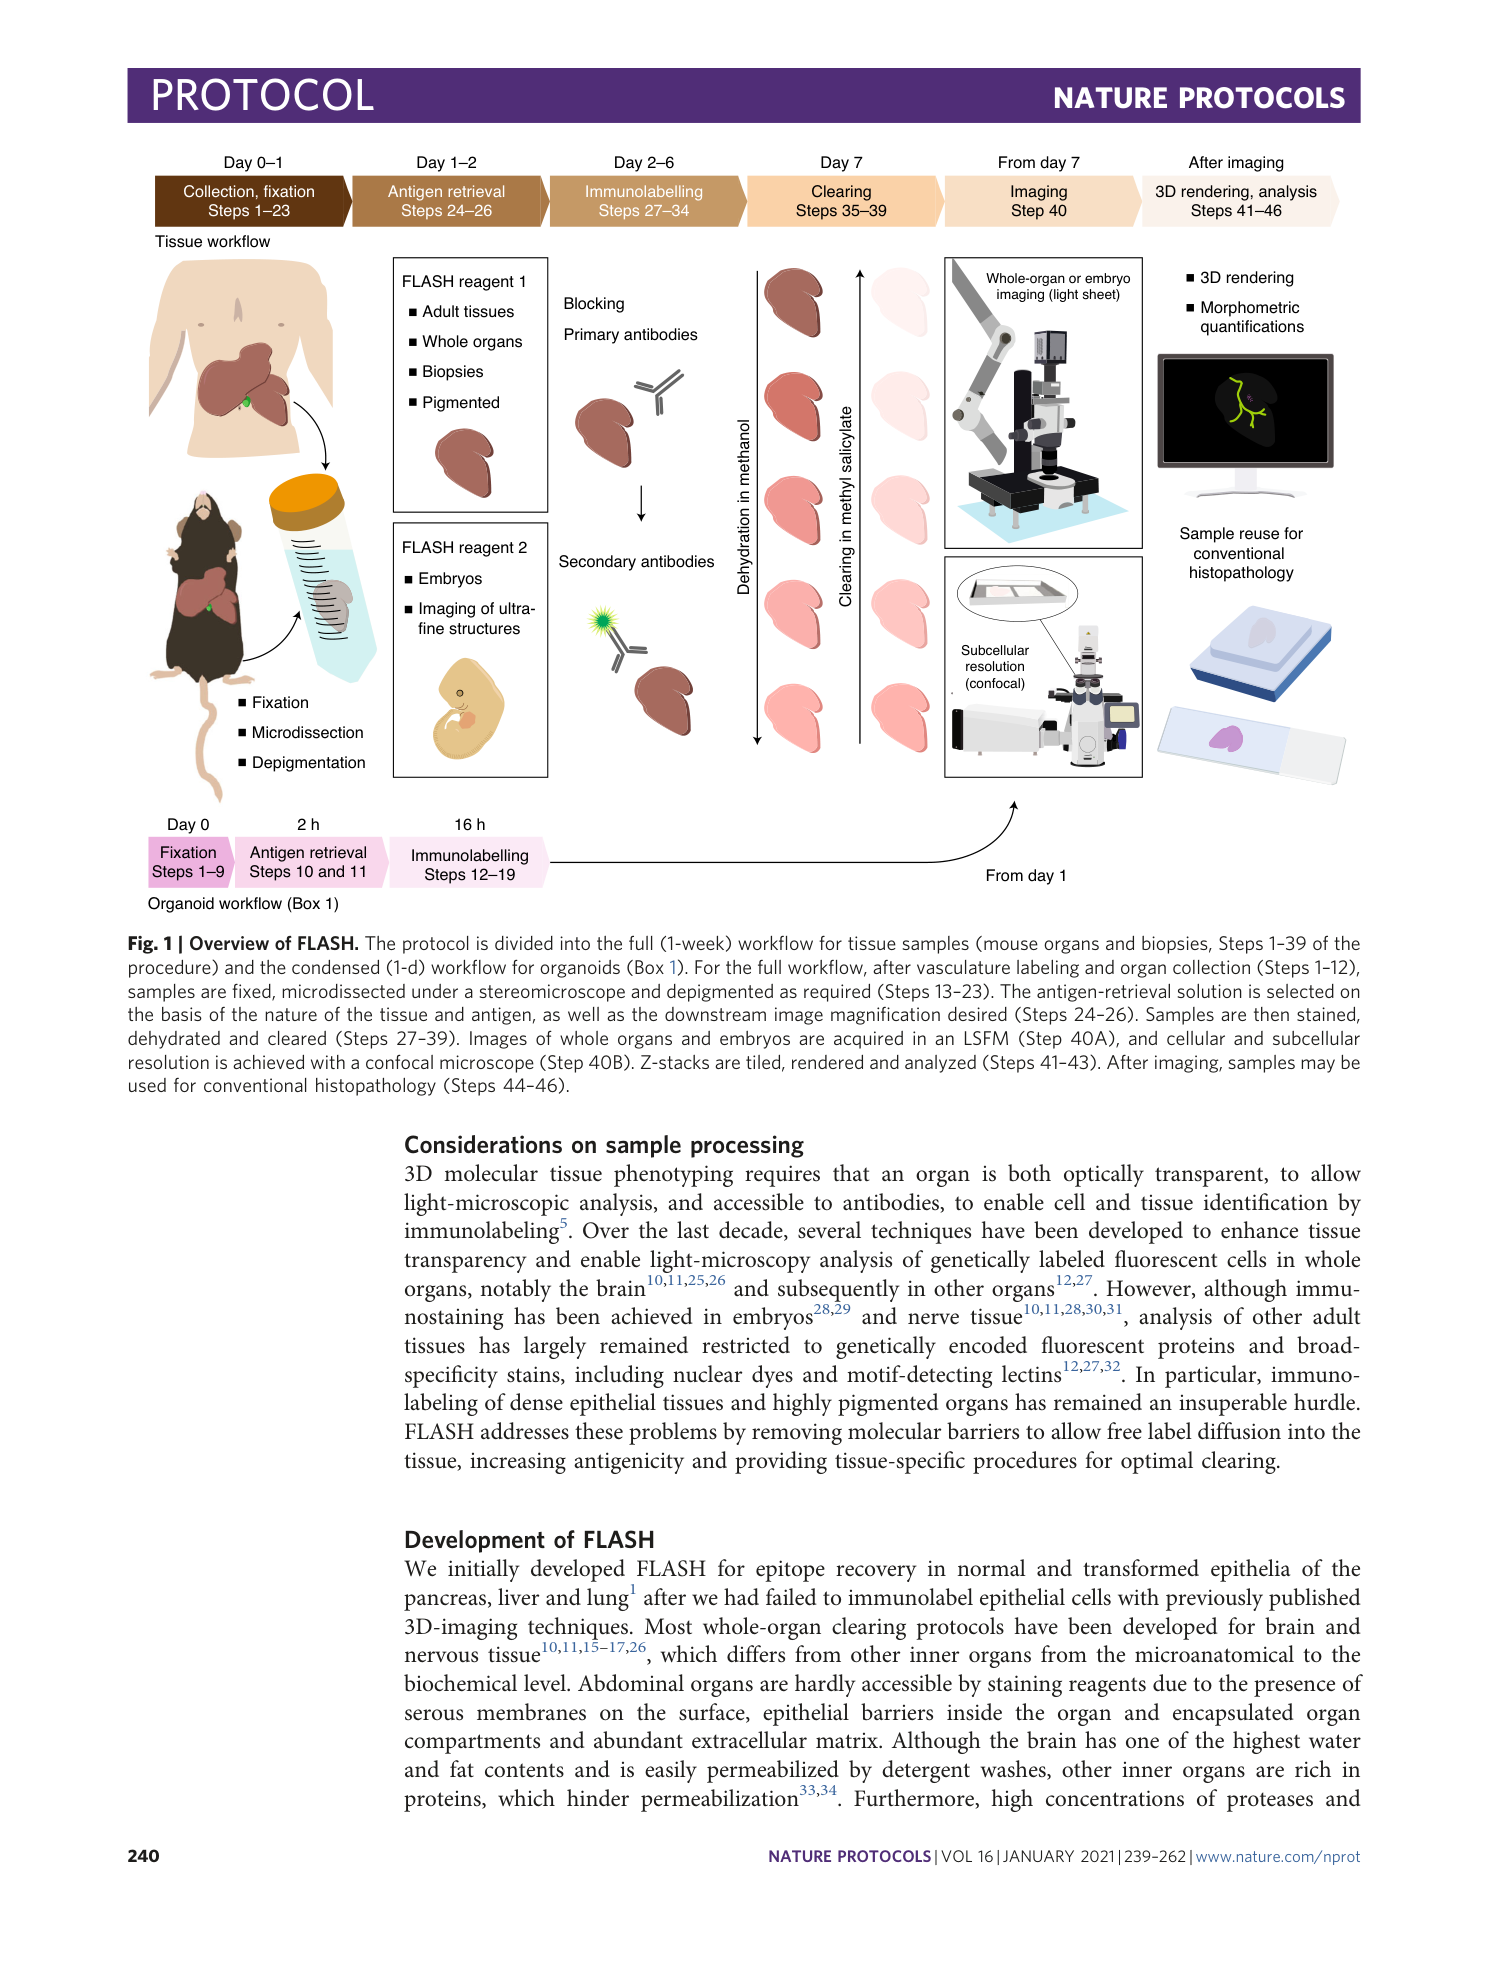
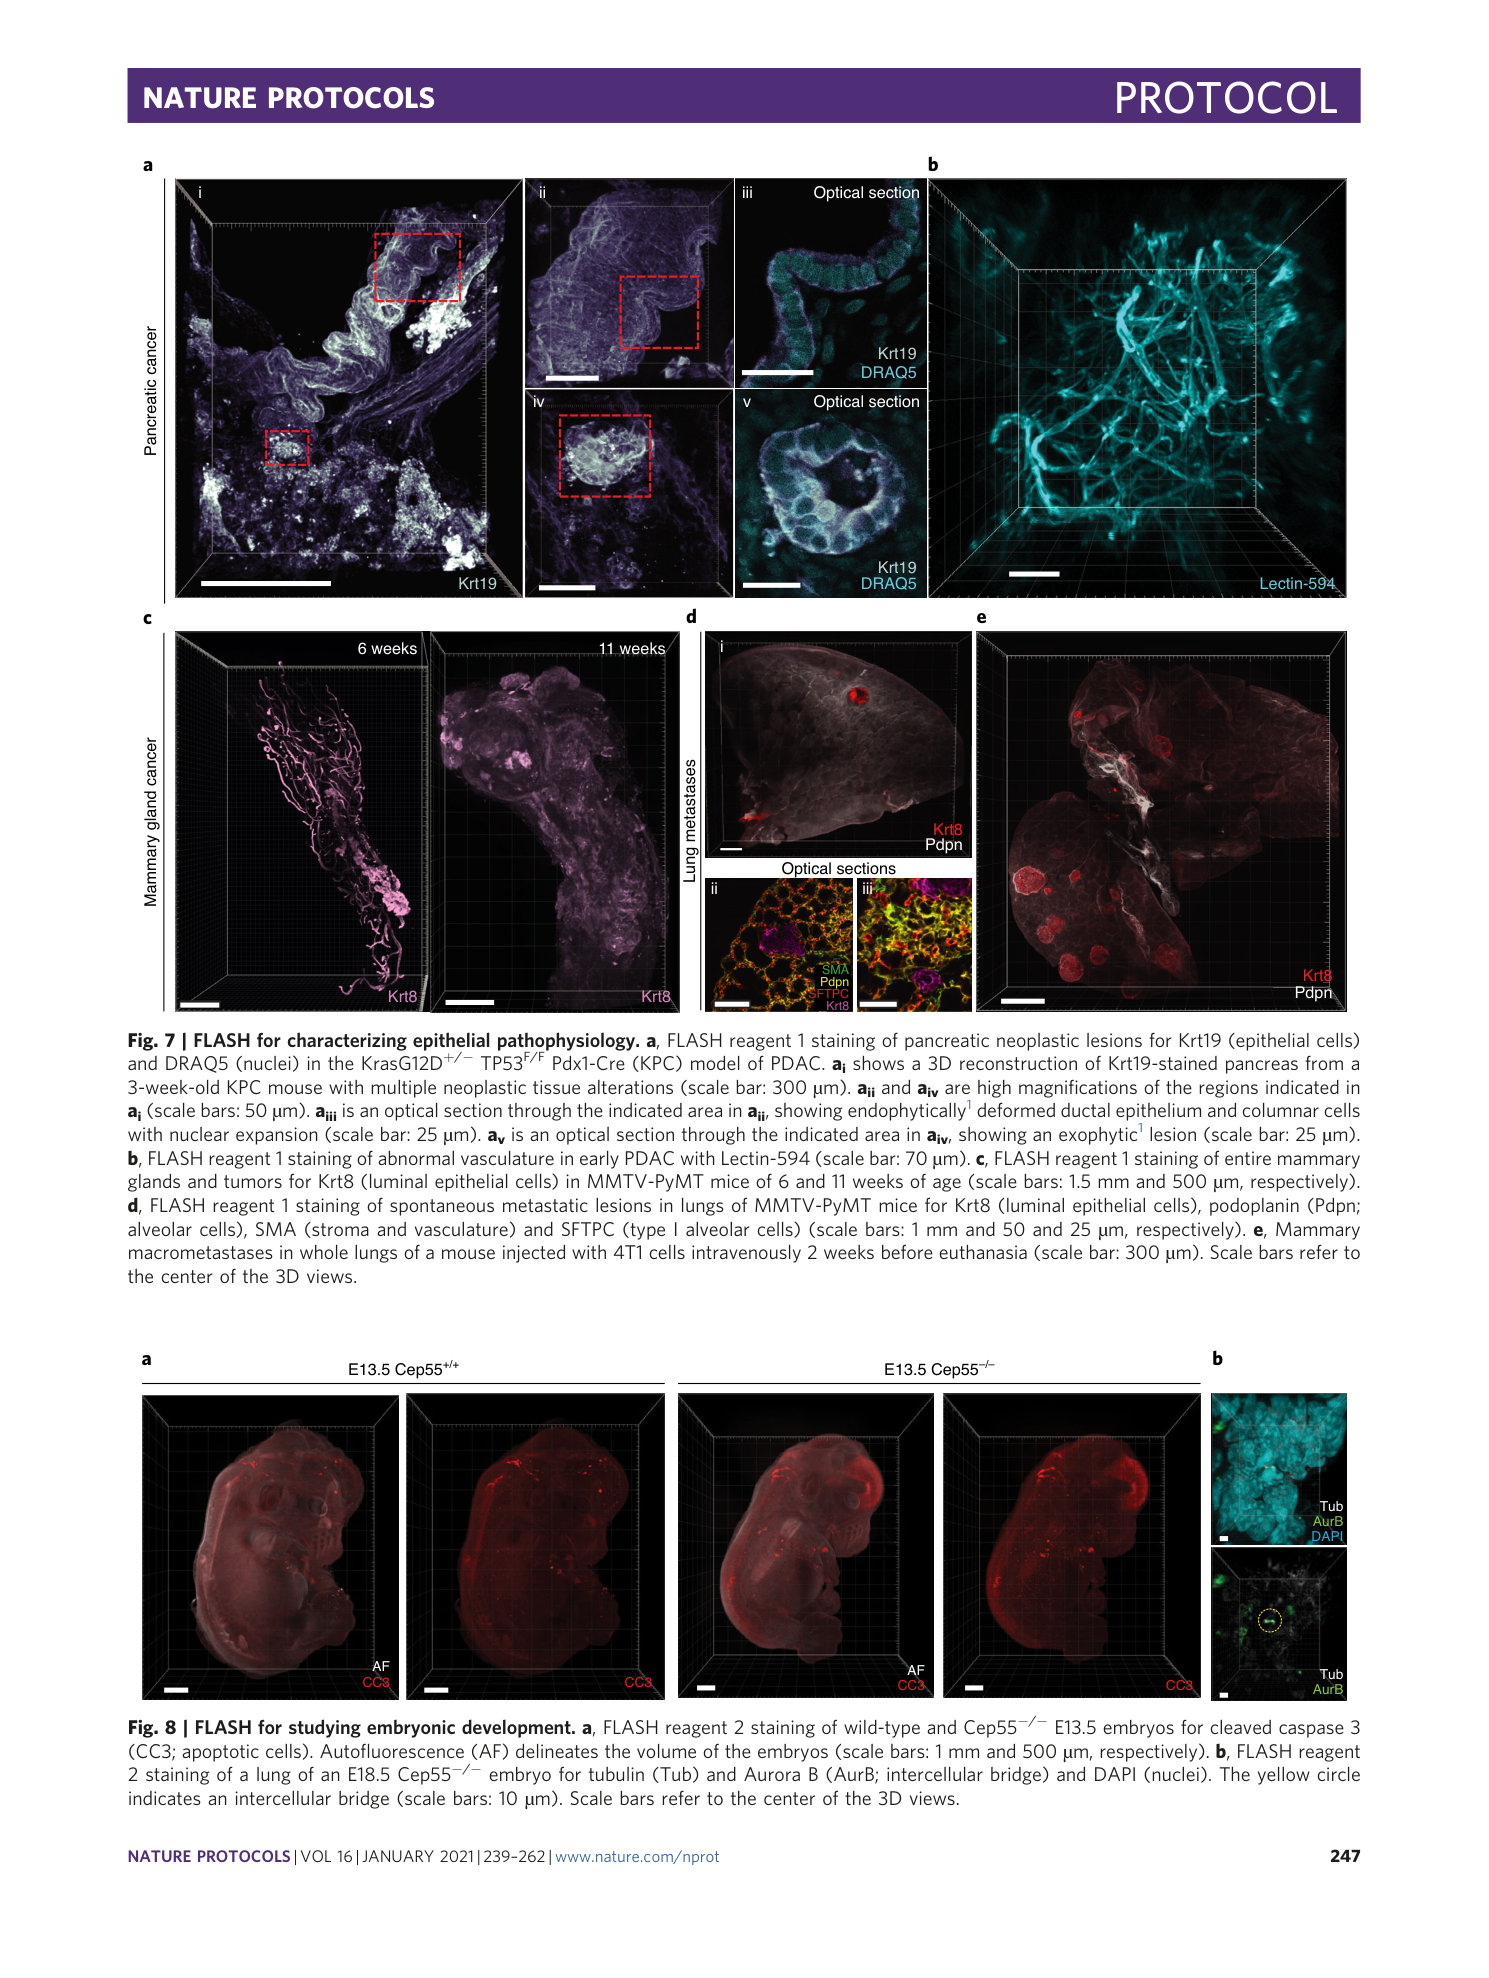
FLASH technique
whole-organ immunofluorescence
Extended
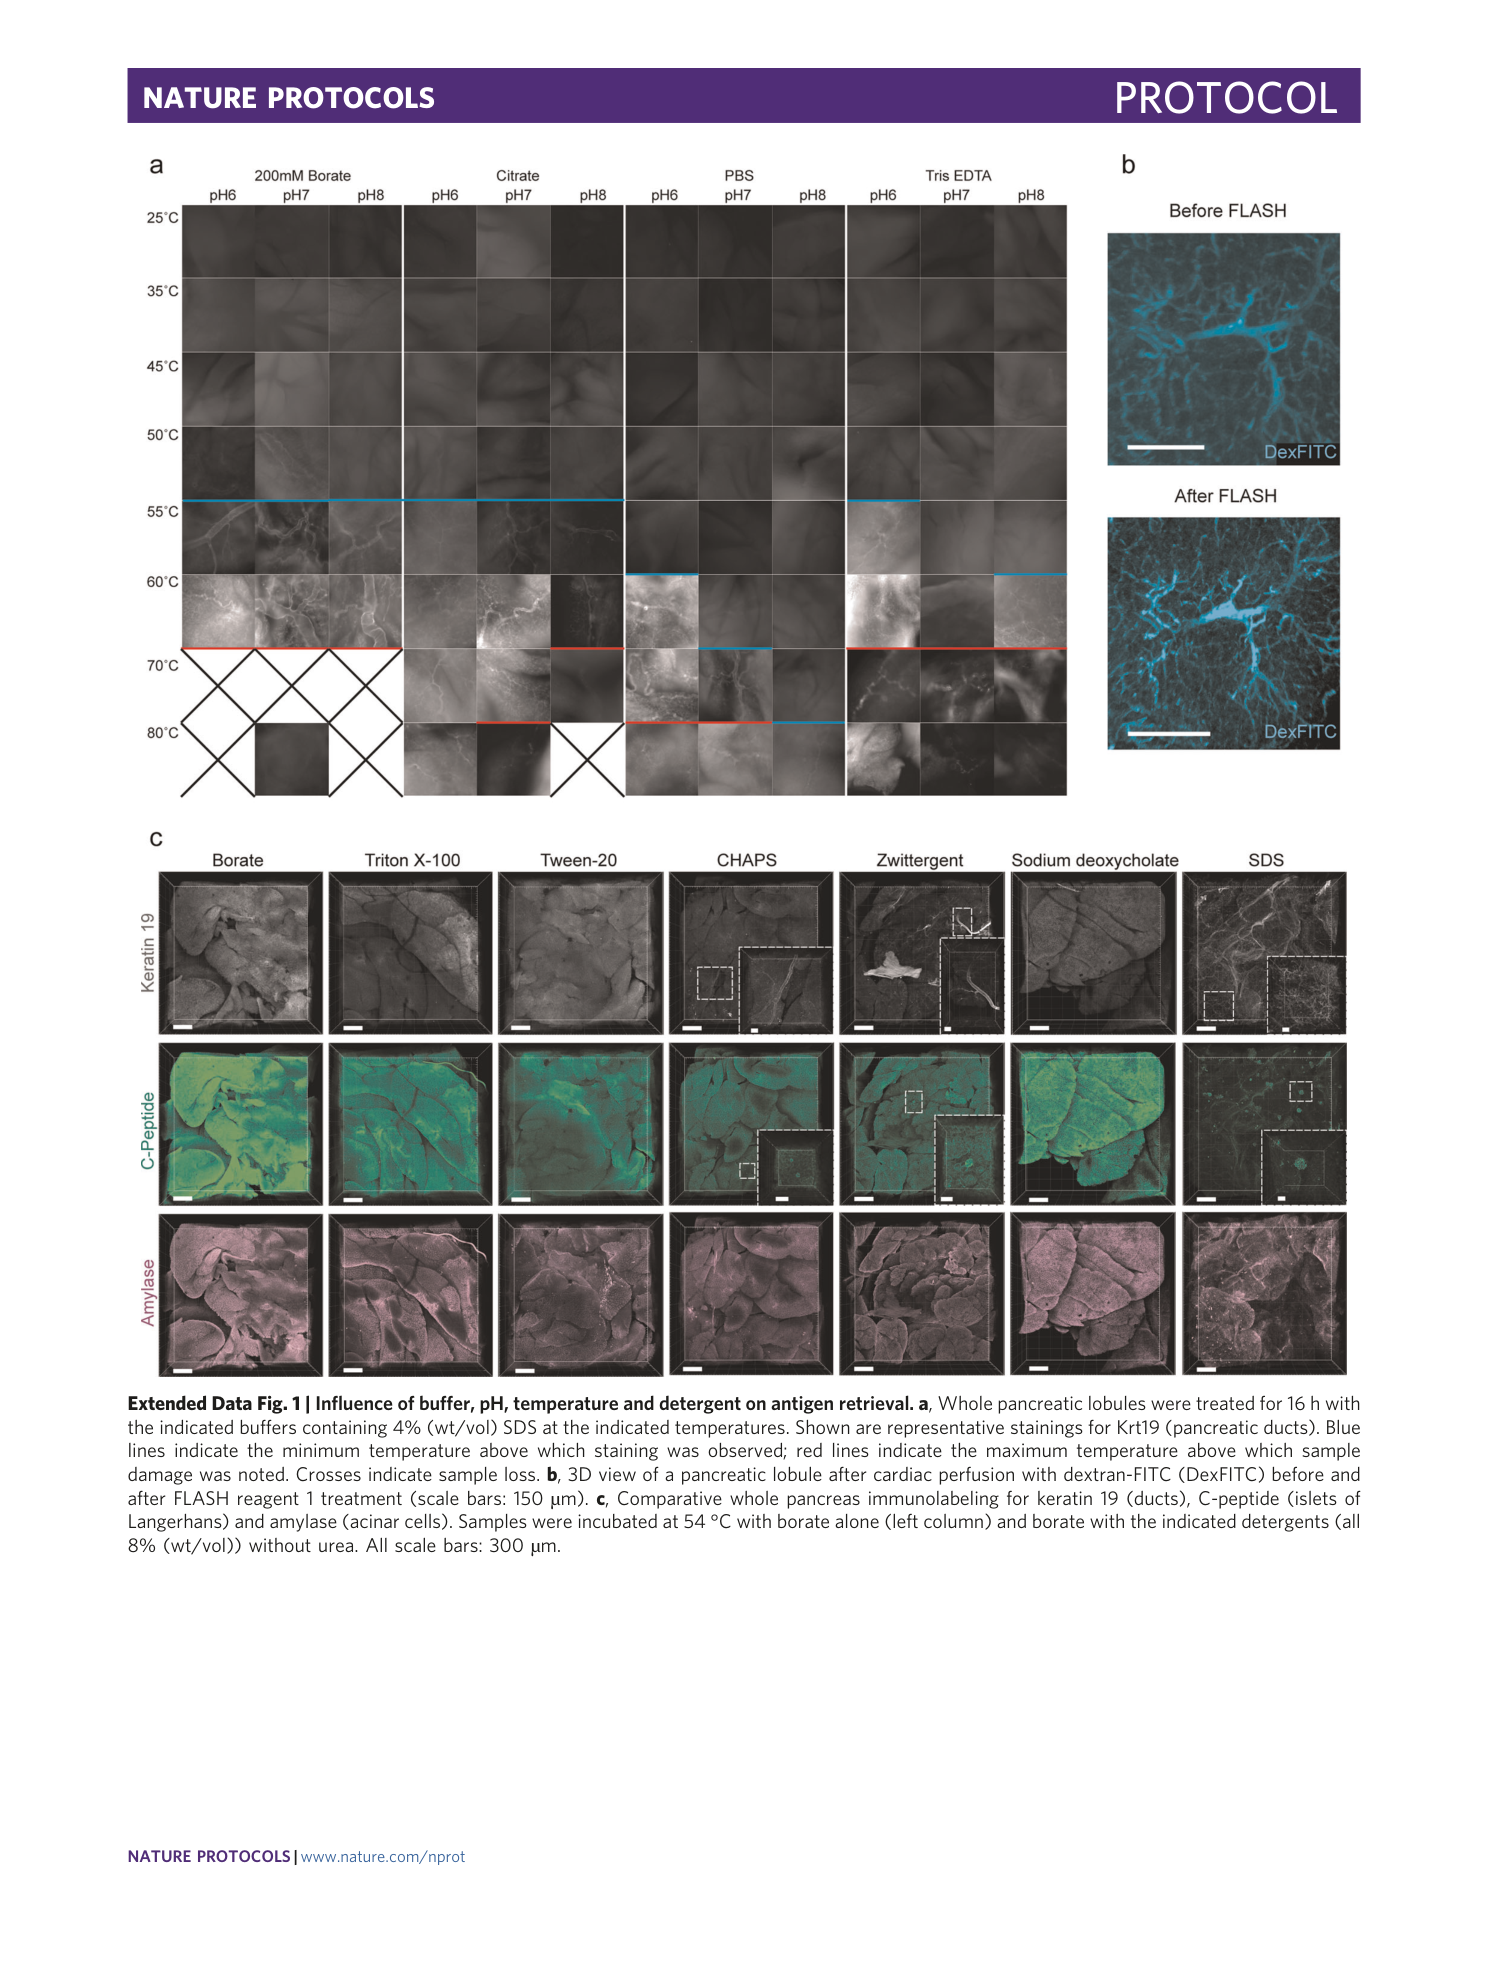
Extended Data Fig. 1 Influence of buffer, pH, temperature and detergent on antigen retrieval.
a , Whole pancreatic lobules were treated for 16 h with the indicated buffers containing 4% (wt/vol) SDS at the indicated temperatures. Shown are representative stainings for Krt19 (pancreatic ducts). Blue lines indicate the minimum temperature above which staining was observed; red lines indicate the maximum temperature above which sample damage was noted. Crosses indicate sample loss. b , 3D view of a pancreatic lobule after cardiac perfusion with dextran-FITC (DexFITC) before and after FLASH reagent 1 treatment (scale bars: 150 µm). c , Comparative whole pancreas immunolabeling for keratin 19 (ducts), C-peptide (islets of Langerhans) and amylase (acinar cells). Samples were incubated at 54 °C with borate alone (left column) and borate with the indicated detergents (all 8% (wt/vol)) without urea. All scale bars: 300 µm.
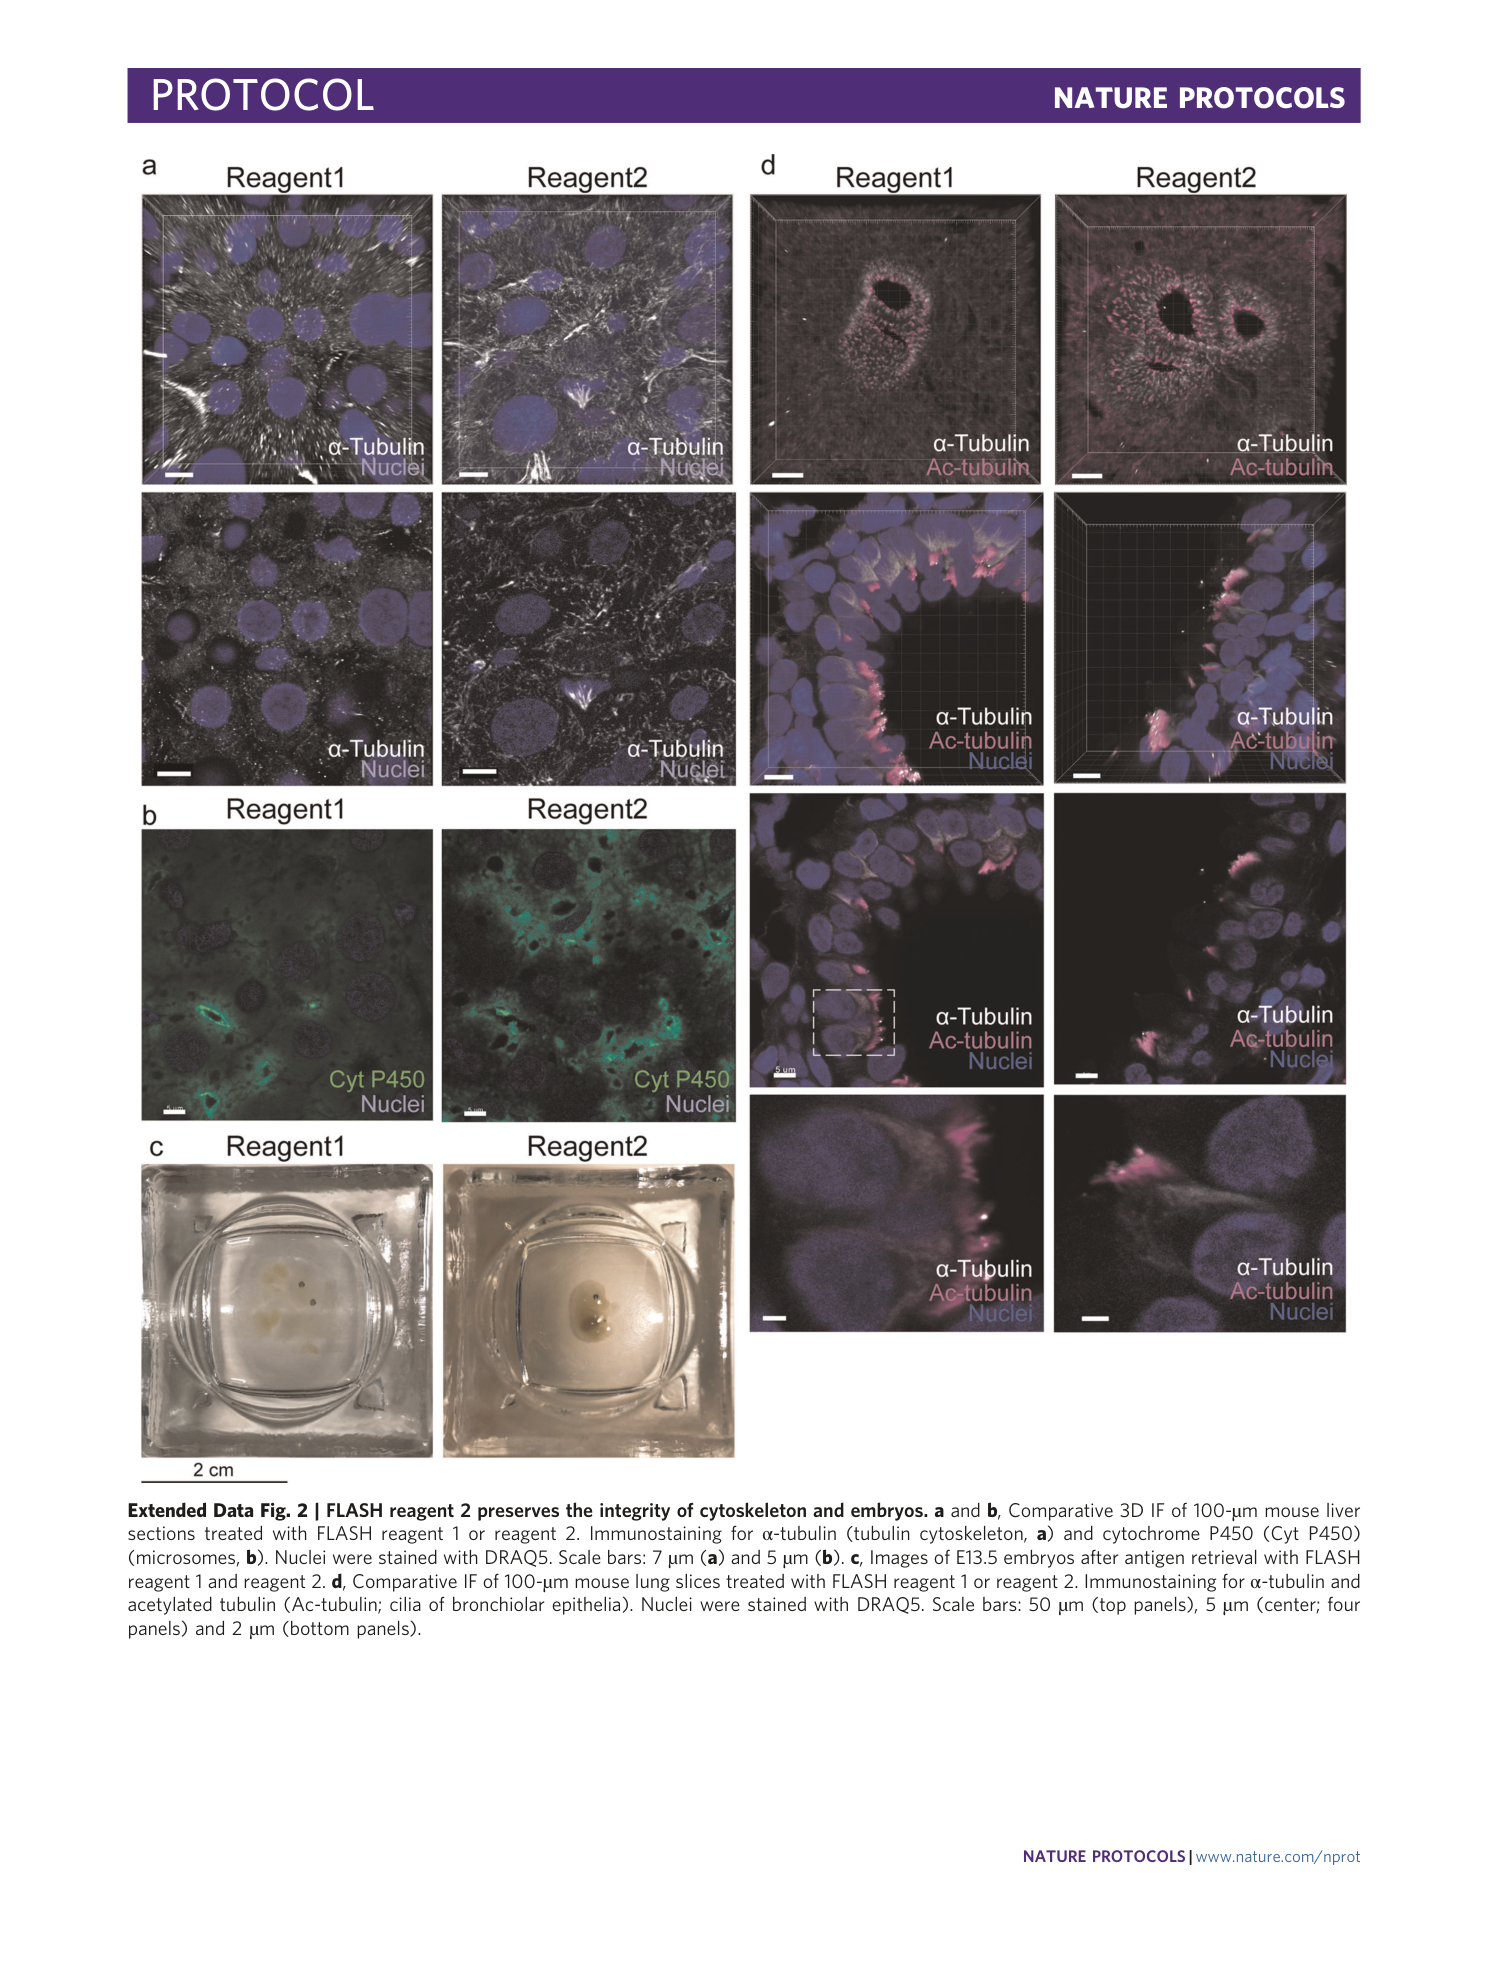
Extended Data Fig. 2 FLASH reagent 2 preserves the integrity of cytoskeleton and embryos.
a and b , Comparative 3D IF of 100-µm mouse liver sections treated with FLASH reagent 1 or reagent 2. Immunostaining for α-tubulin (tubulin cytoskeleton, a ) and cytochrome P450 (Cyt P450) (microsomes, b ). Nuclei were stained with DRAQ5. Scale bars: 7 µm ( a ) and 5 µm ( b ). c , Images of E13.5 embryos after antigen retrieval with FLASH reagent 1 and reagent 2. d , Comparative IF of 100-µm mouse lung slices treated with FLASH reagent 1 or reagent 2. Immunostaining for α-tubulin and acetylated tubulin (Ac-tubulin; cilia of bronchiolar epithelia). Nuclei were stained with DRAQ5. Scale bars: 50 µm (top panels), 5 µm (center; four panels) and 2 µm (bottom panels).
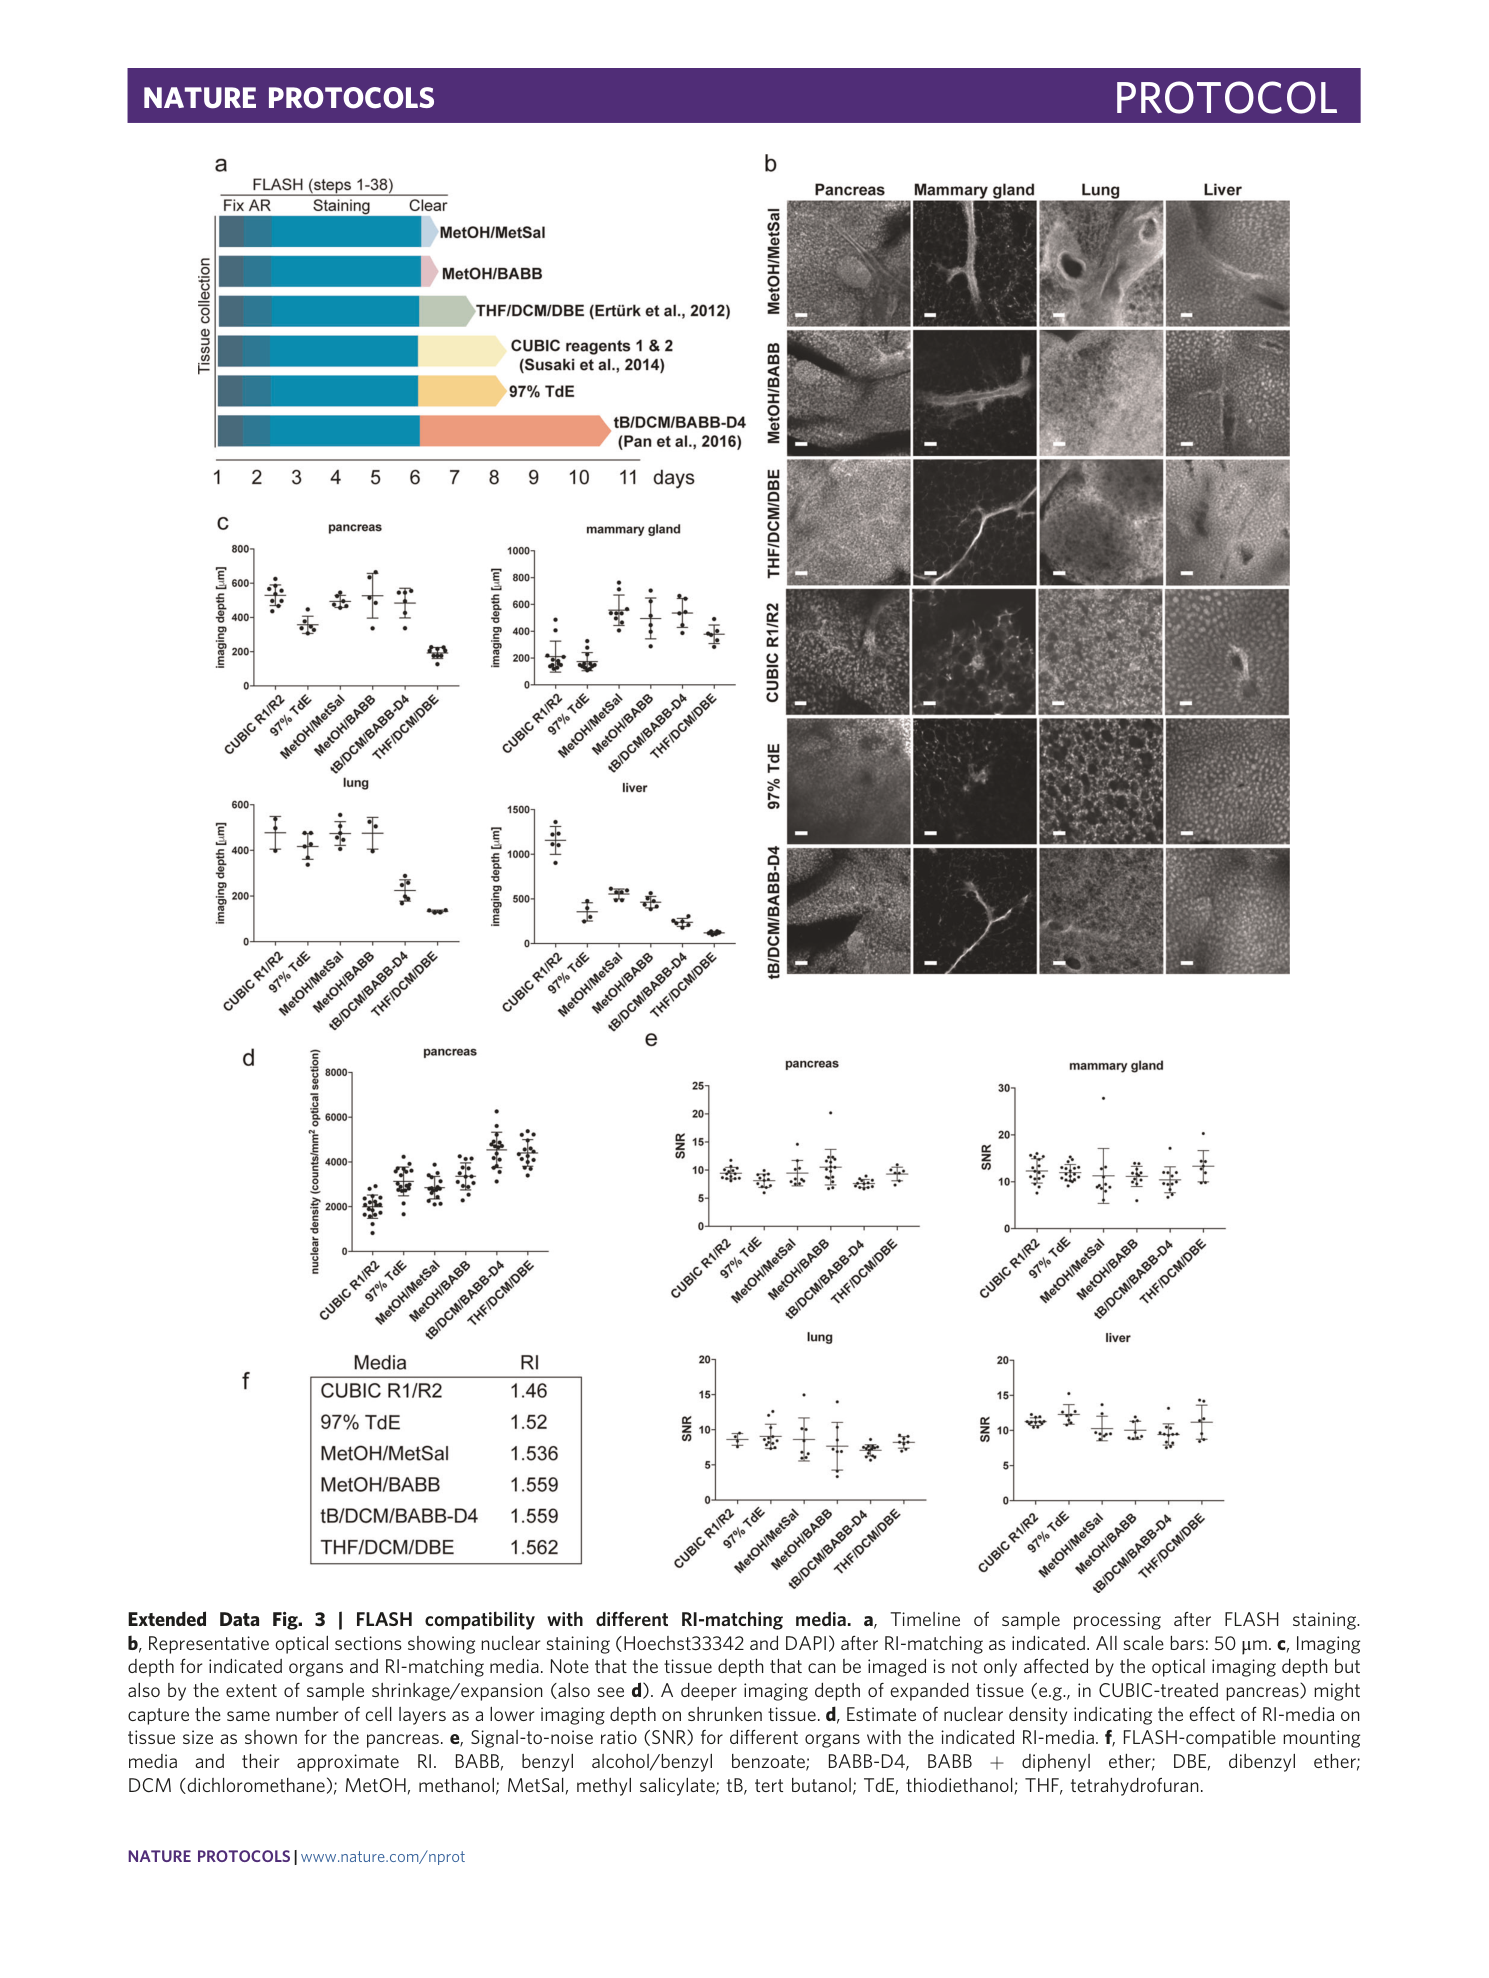
Extended Data Fig. 3 FLASH compatibility with different RI-matching media.
a , Timeline of sample processing after FLASH staining. b , Representative optical sections showing nuclear staining (Hoechst33342 and DAPI) after RI-matching as indicated. All scale bars: 50 μm. c , Imaging depth for indicated organs and RI-matching media. Note that the tissue depth that can be imaged is not only affected by the optical imaging depth but also by the extent of sample shrinkage/expansion (also see d ). A deeper imaging depth of expanded tissue (e.g., in CUBIC-treated pancreas) might capture the same number of cell layers as a lower imaging depth on shrunken tissue. d , Estimate of nuclear density indicating the effect of RI-media on tissue size as shown for the pancreas. e , Signal-to-noise ratio (SNR) for different organs with the indicated RI-media. f , FLASH-compatible mounting media and their approximate RI. BABB, benzyl alcohol/benzyl benzoate; BABB-D4, BABB + diphenyl ether; DBE, dibenzyl ether; DCM (dichloromethane); MetOH, methanol; MetSal, methyl salicylate; tB, tert butanol; TdE, thiodiethanol; THF, tetrahydrofuran.
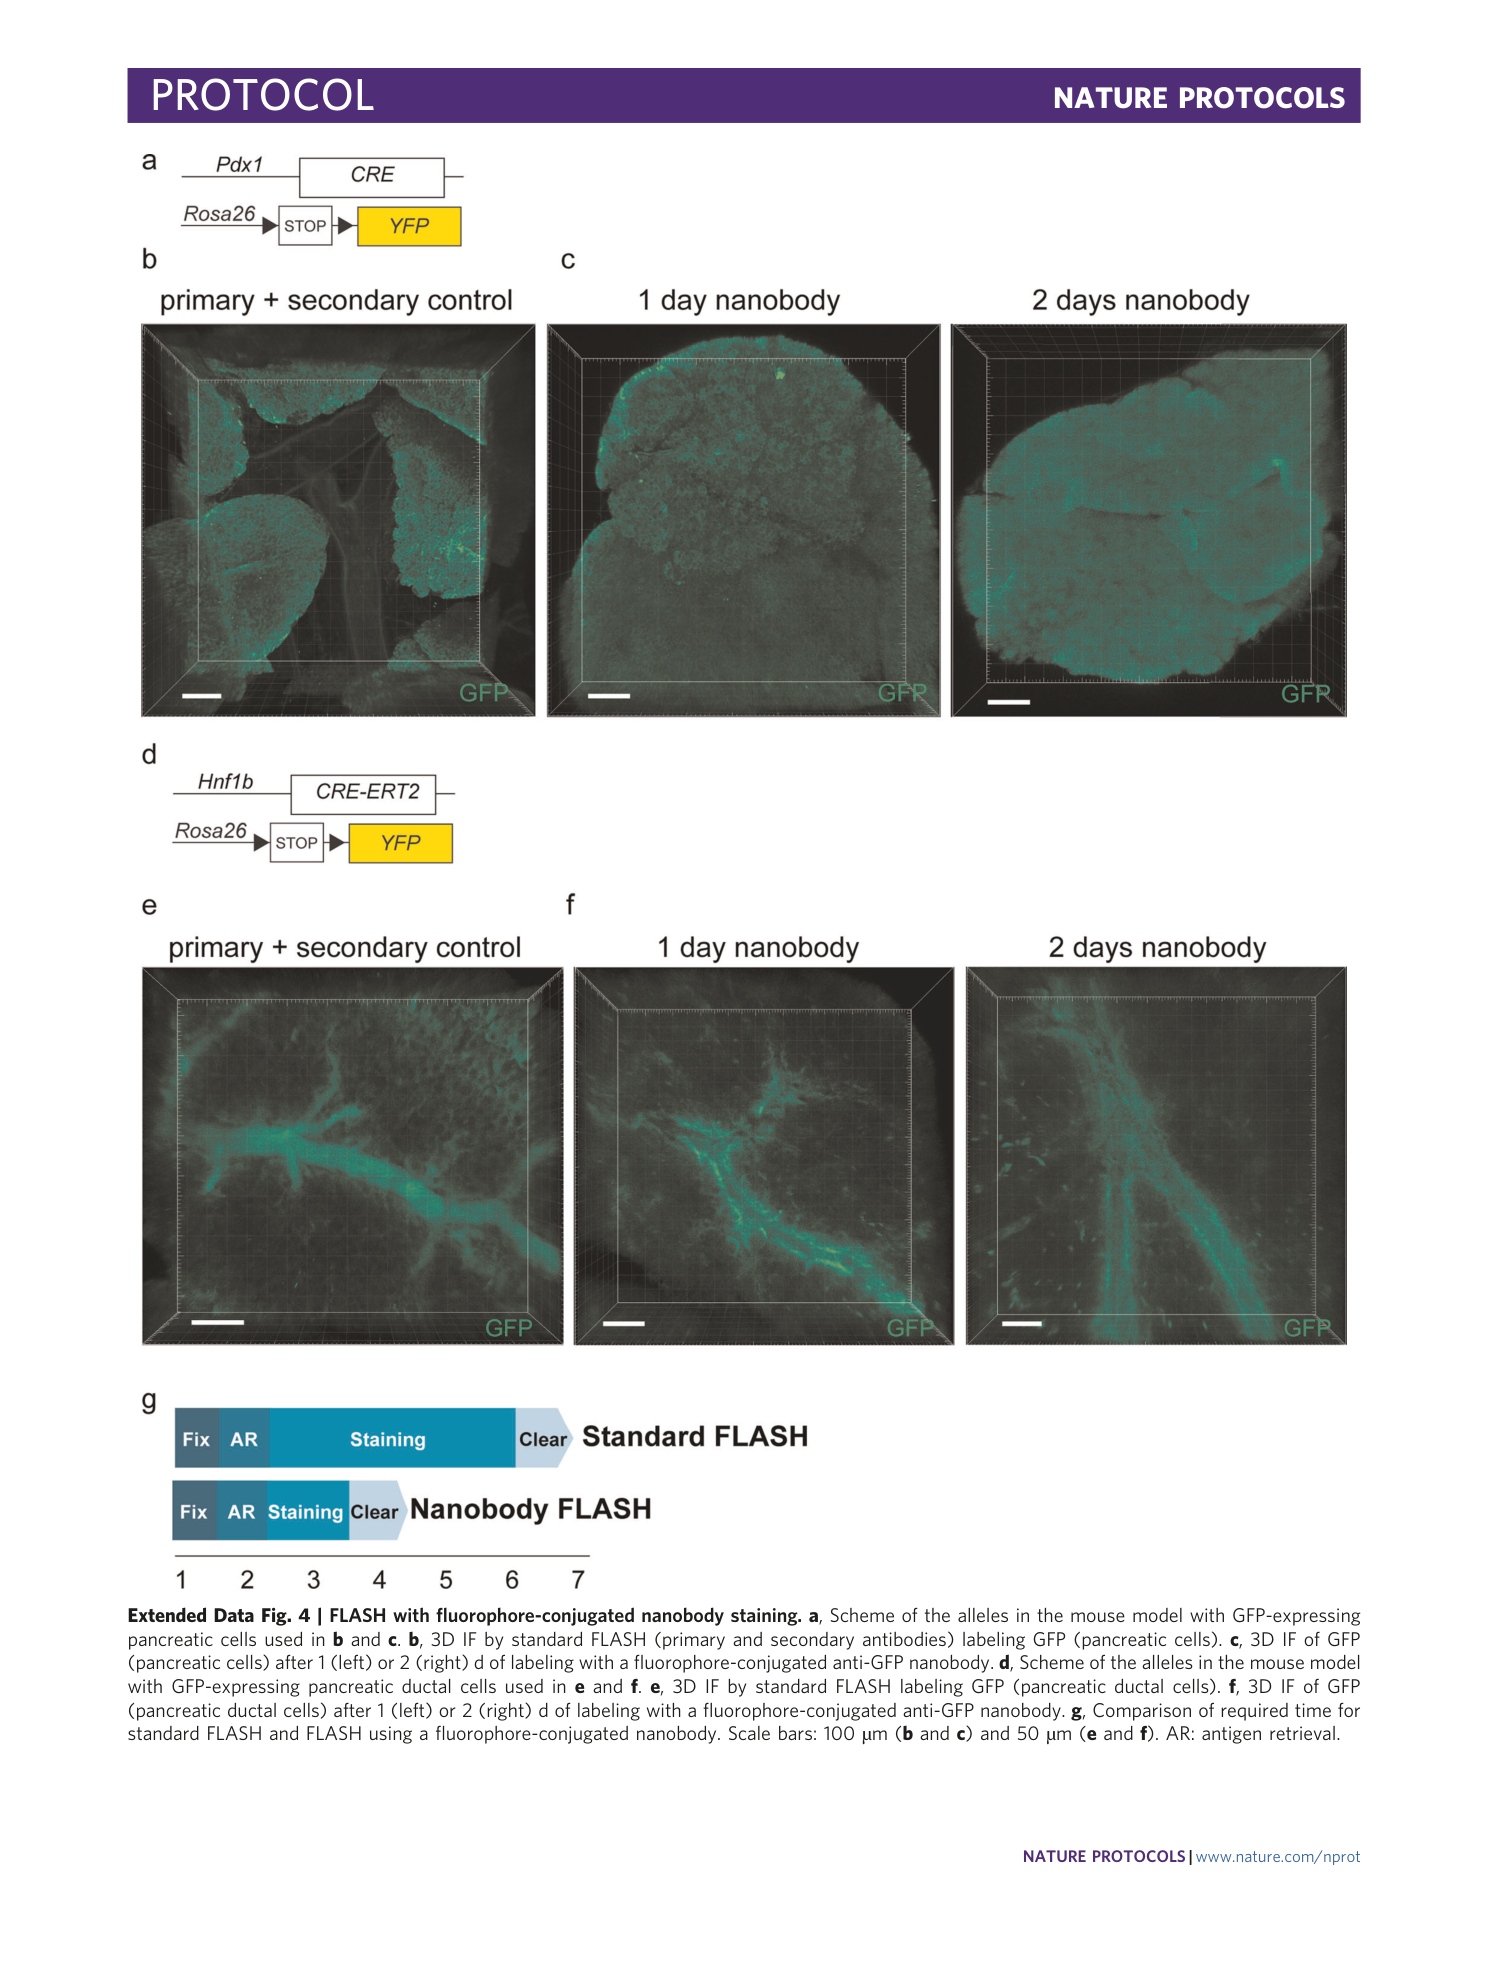
Extended Data Fig. 4 FLASH with fluorophore-conjugated nanobody staining.
a , Scheme of the alleles in the mouse model with GFP-expressing pancreatic cells used in b and c . b , 3D IF by standard FLASH (primary and secondary antibodies) labeling GFP (pancreatic cells). c , 3D IF of GFP (pancreatic cells) after 1 (left) or 2 (right) d of labeling with a fluorophore-conjugated anti-GFP nanobody. d , Scheme of the alleles in the mouse model with GFP-expressing pancreatic ductal cells used in e and f . e , 3D IF by standard FLASH labeling GFP (pancreatic ductal cells). f , 3D IF of GFP (pancreatic ductal cells) after 1 (left) or 2 (right) d of labeling with a fluorophore-conjugated anti-GFP nanobody. g , Comparison of required time for standard FLASH and FLASH using a fluorophore-conjugated nanobody. Scale bars: 100 µm ( b and c ) and 50 µm ( e and f ). AR: antigen retrieval.
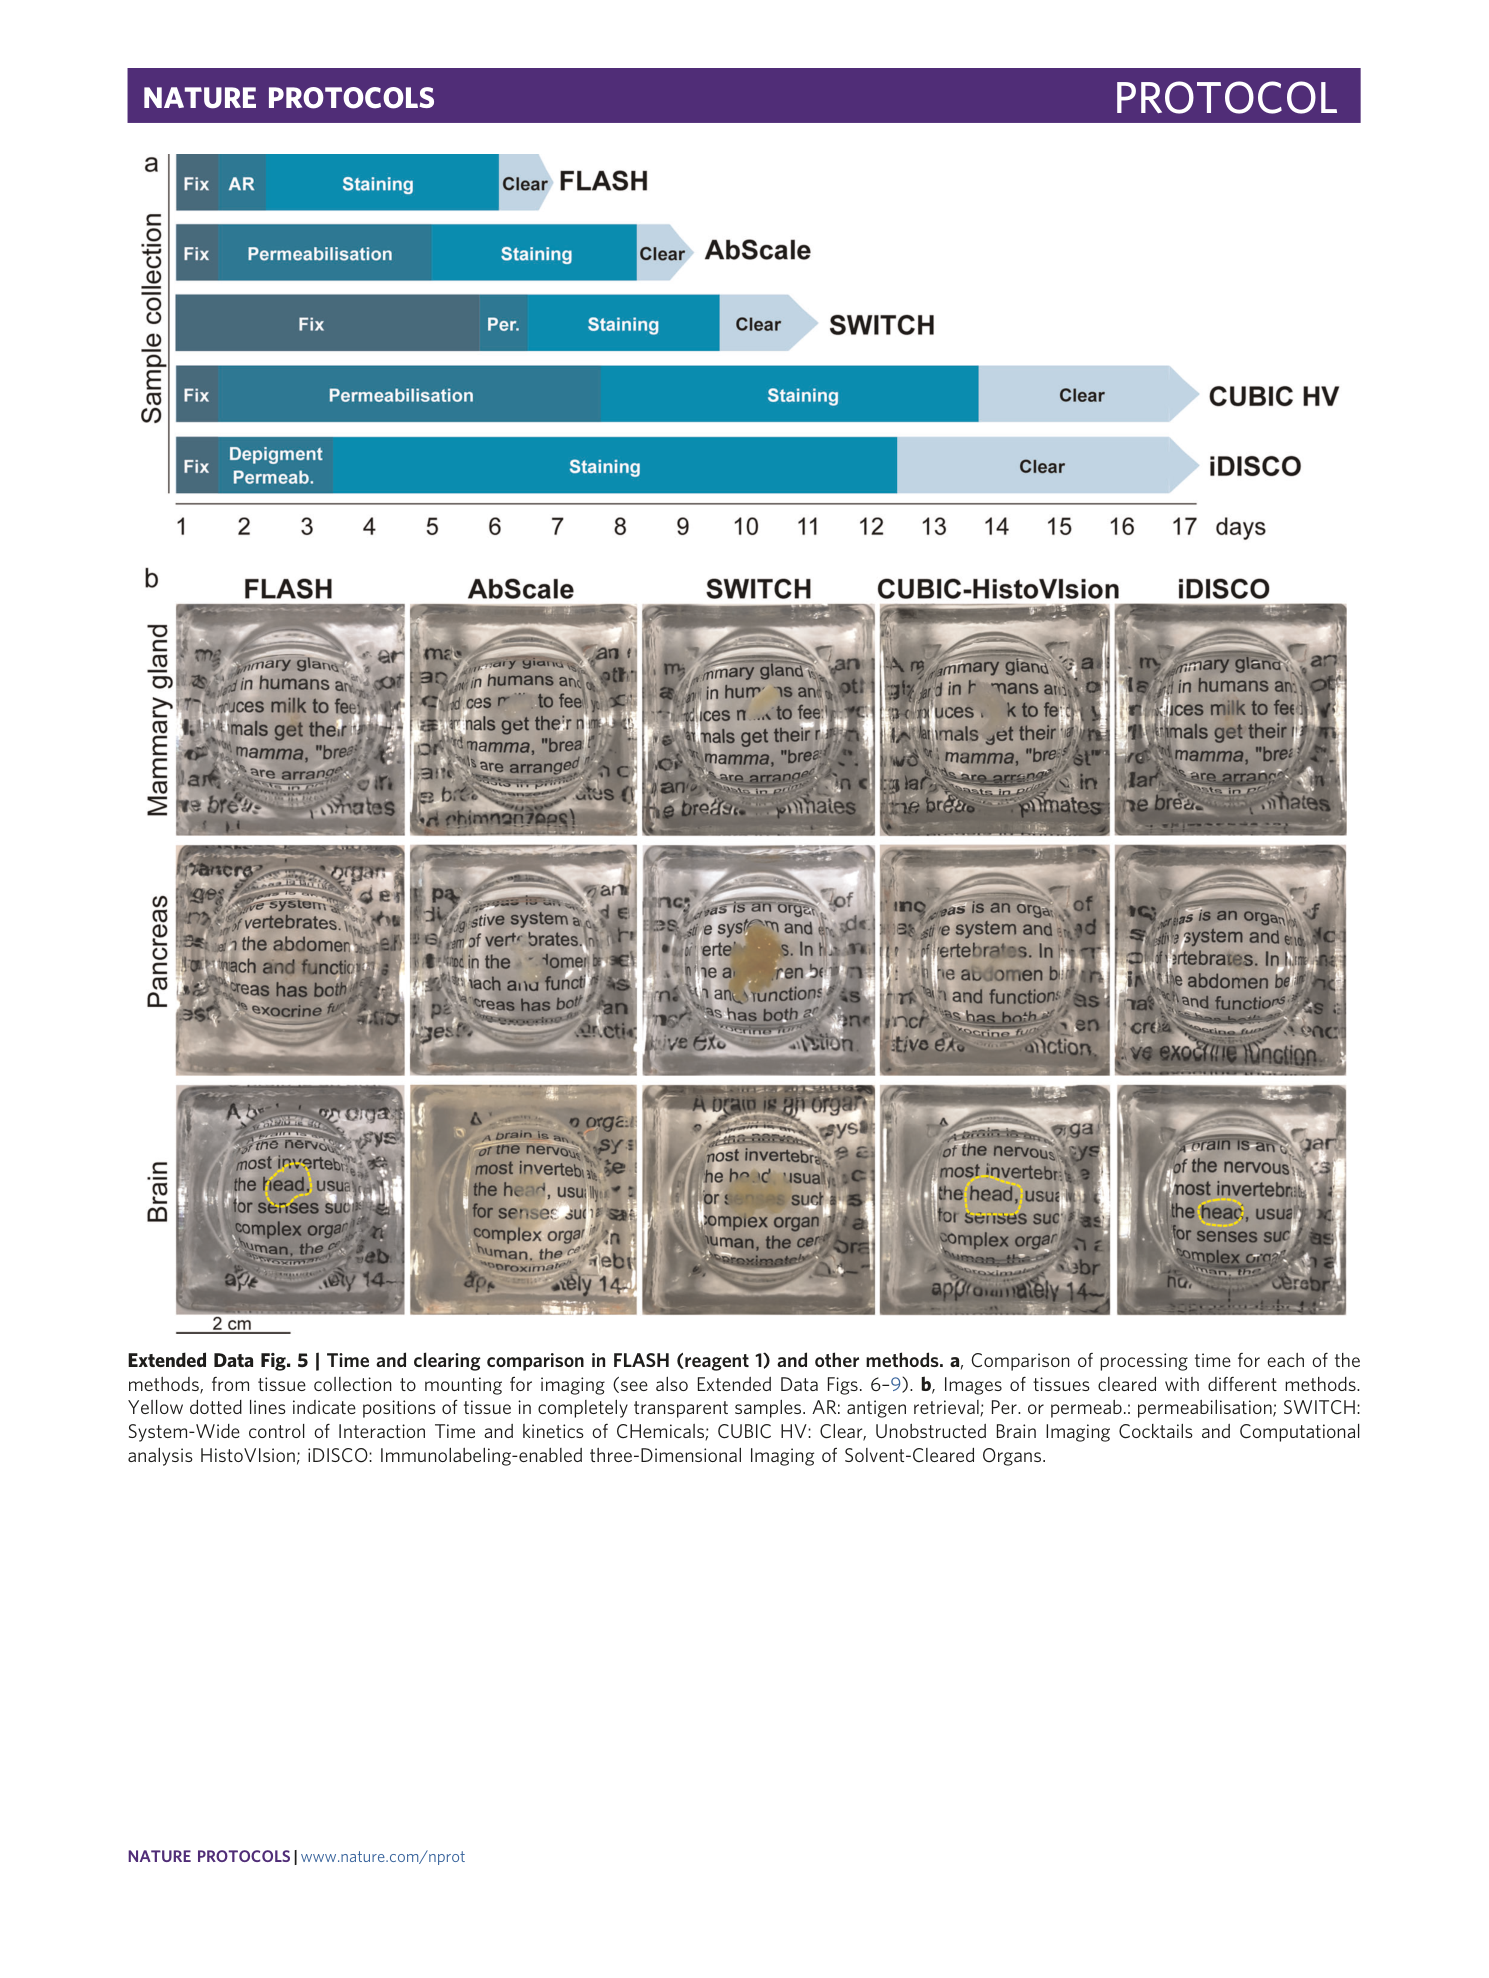
Extended Data Fig. 5 Time and clearing comparison in FLASH (reagent 1) and other methods.
a , Comparison of processing time for each of the methods, from tissue collection to mounting for imaging (see also Extended Data Figs. 6 – 9 ). b , Images of tissues cleared with different methods. Yellow dotted lines indicate positions of tissue in completely transparent samples. AR: antigen retrieval; Per. or permeab.: permeabilisation; SWITCH: System-Wide control of Interaction Time and kinetics of CHemicals; CUBIC HV: Clear, Unobstructed Brain Imaging Cocktails and Computational analysis HistoVIsion; iDISCO: Immunolabeling-enabled three-Dimensional Imaging of Solvent-Cleared Organs.
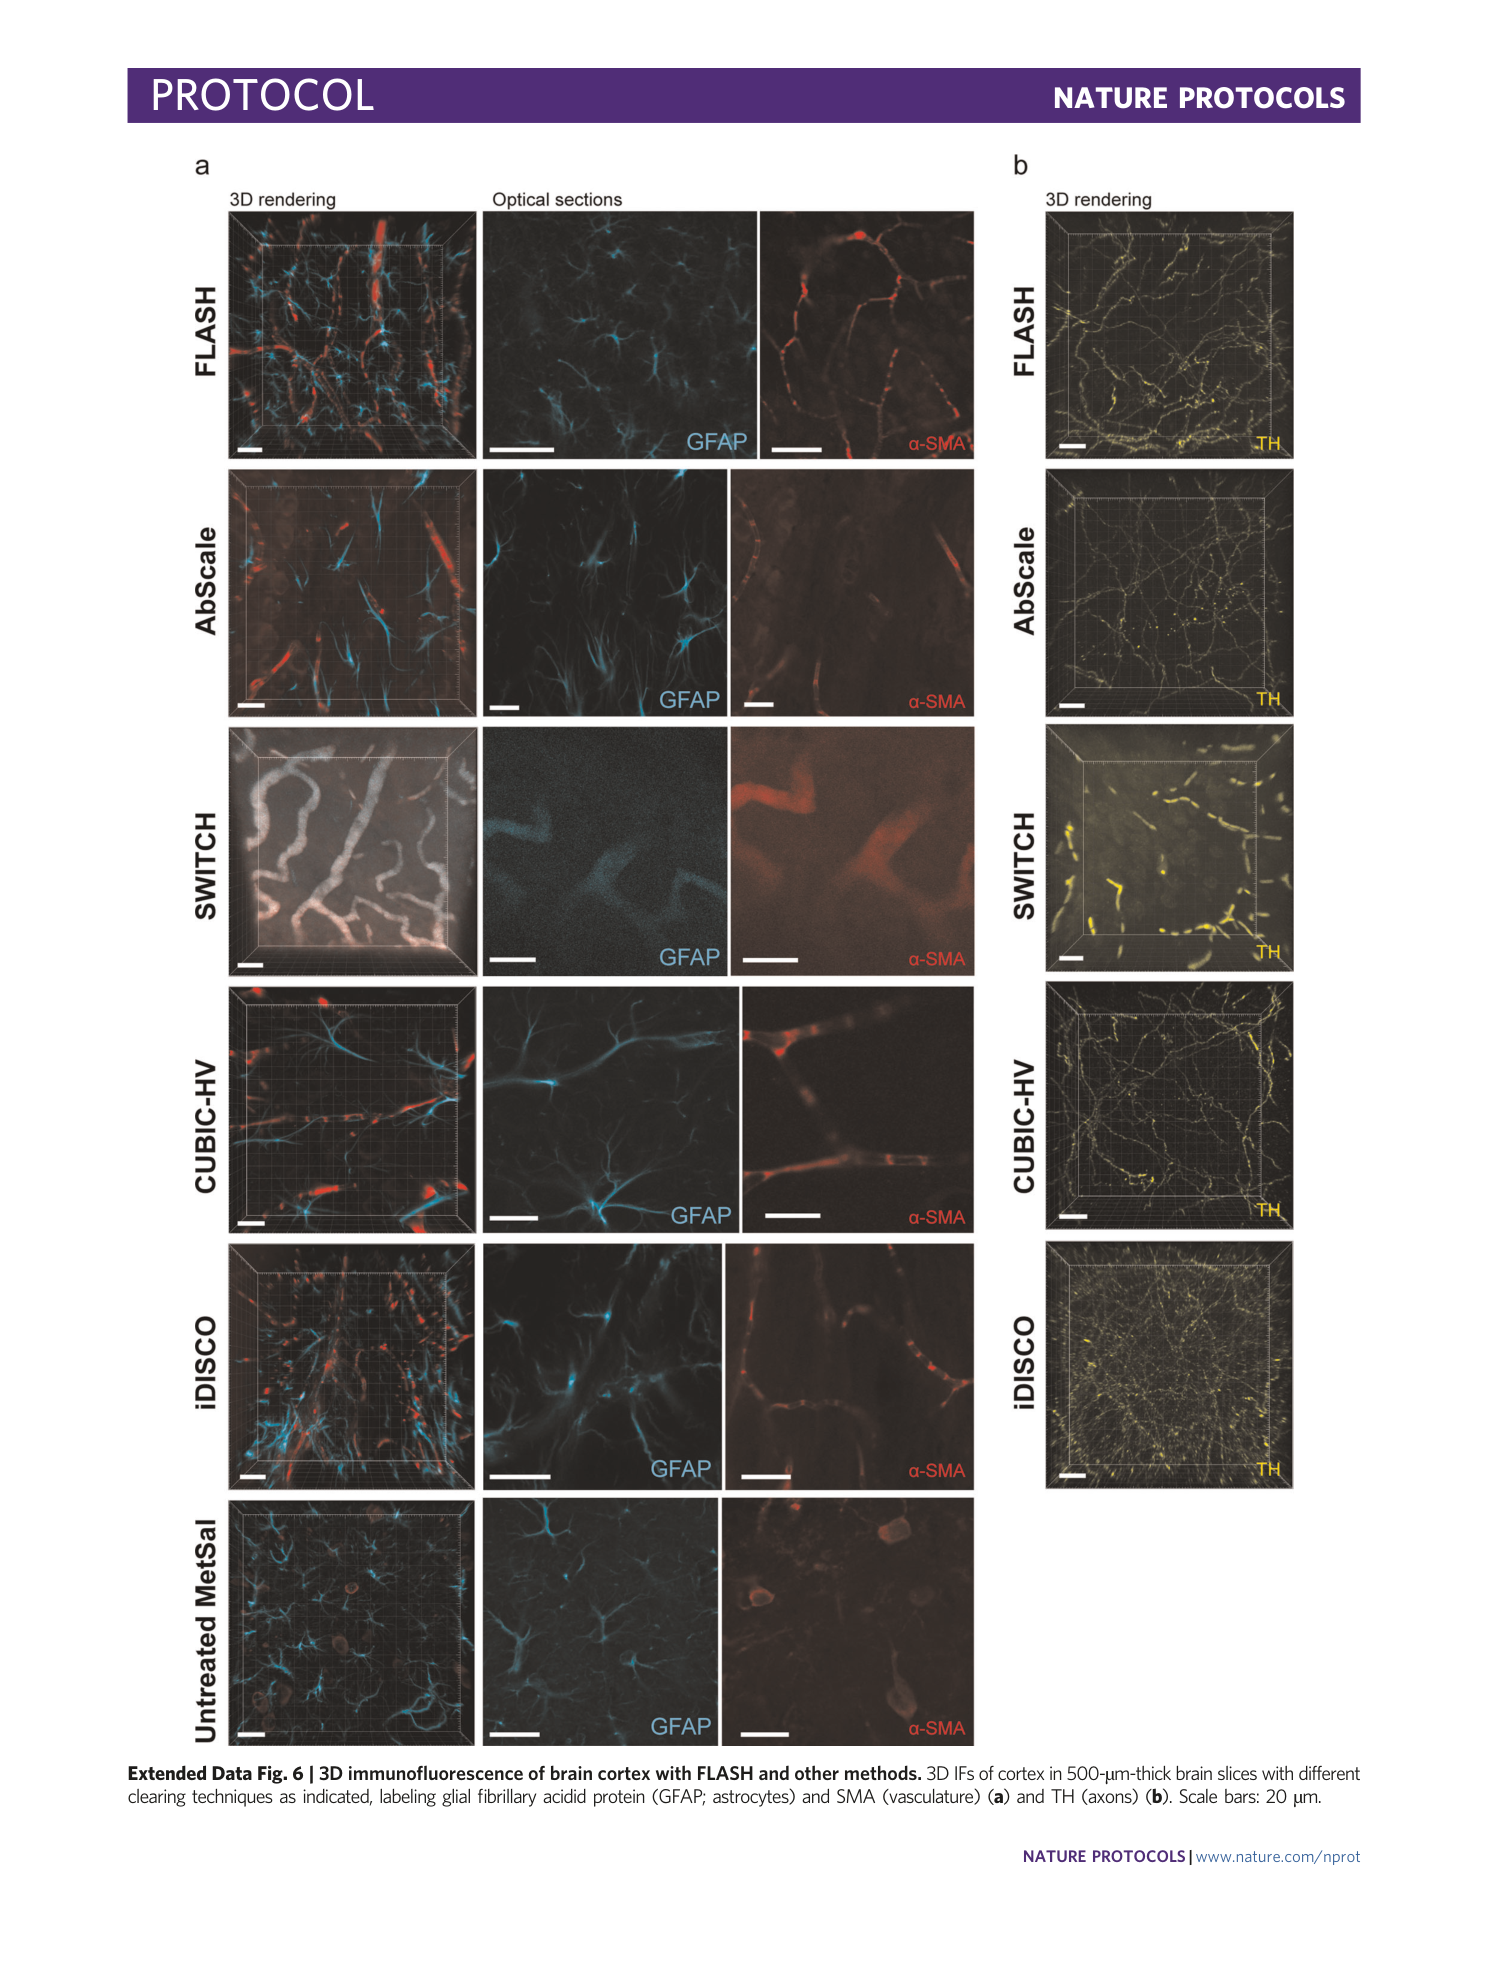
Extended Data Fig. 6 3D immunofluorescence of brain cortex with FLASH and other methods.
3D IFs of cortex in 500-µm-thick brain slices with different clearing techniques as indicated, labeling glial fibrillary acidid protein (GFAP; astrocytes) and SMA (vasculature) ( a ) and TH (axons) ( b ). Scale bars: 20 µm.
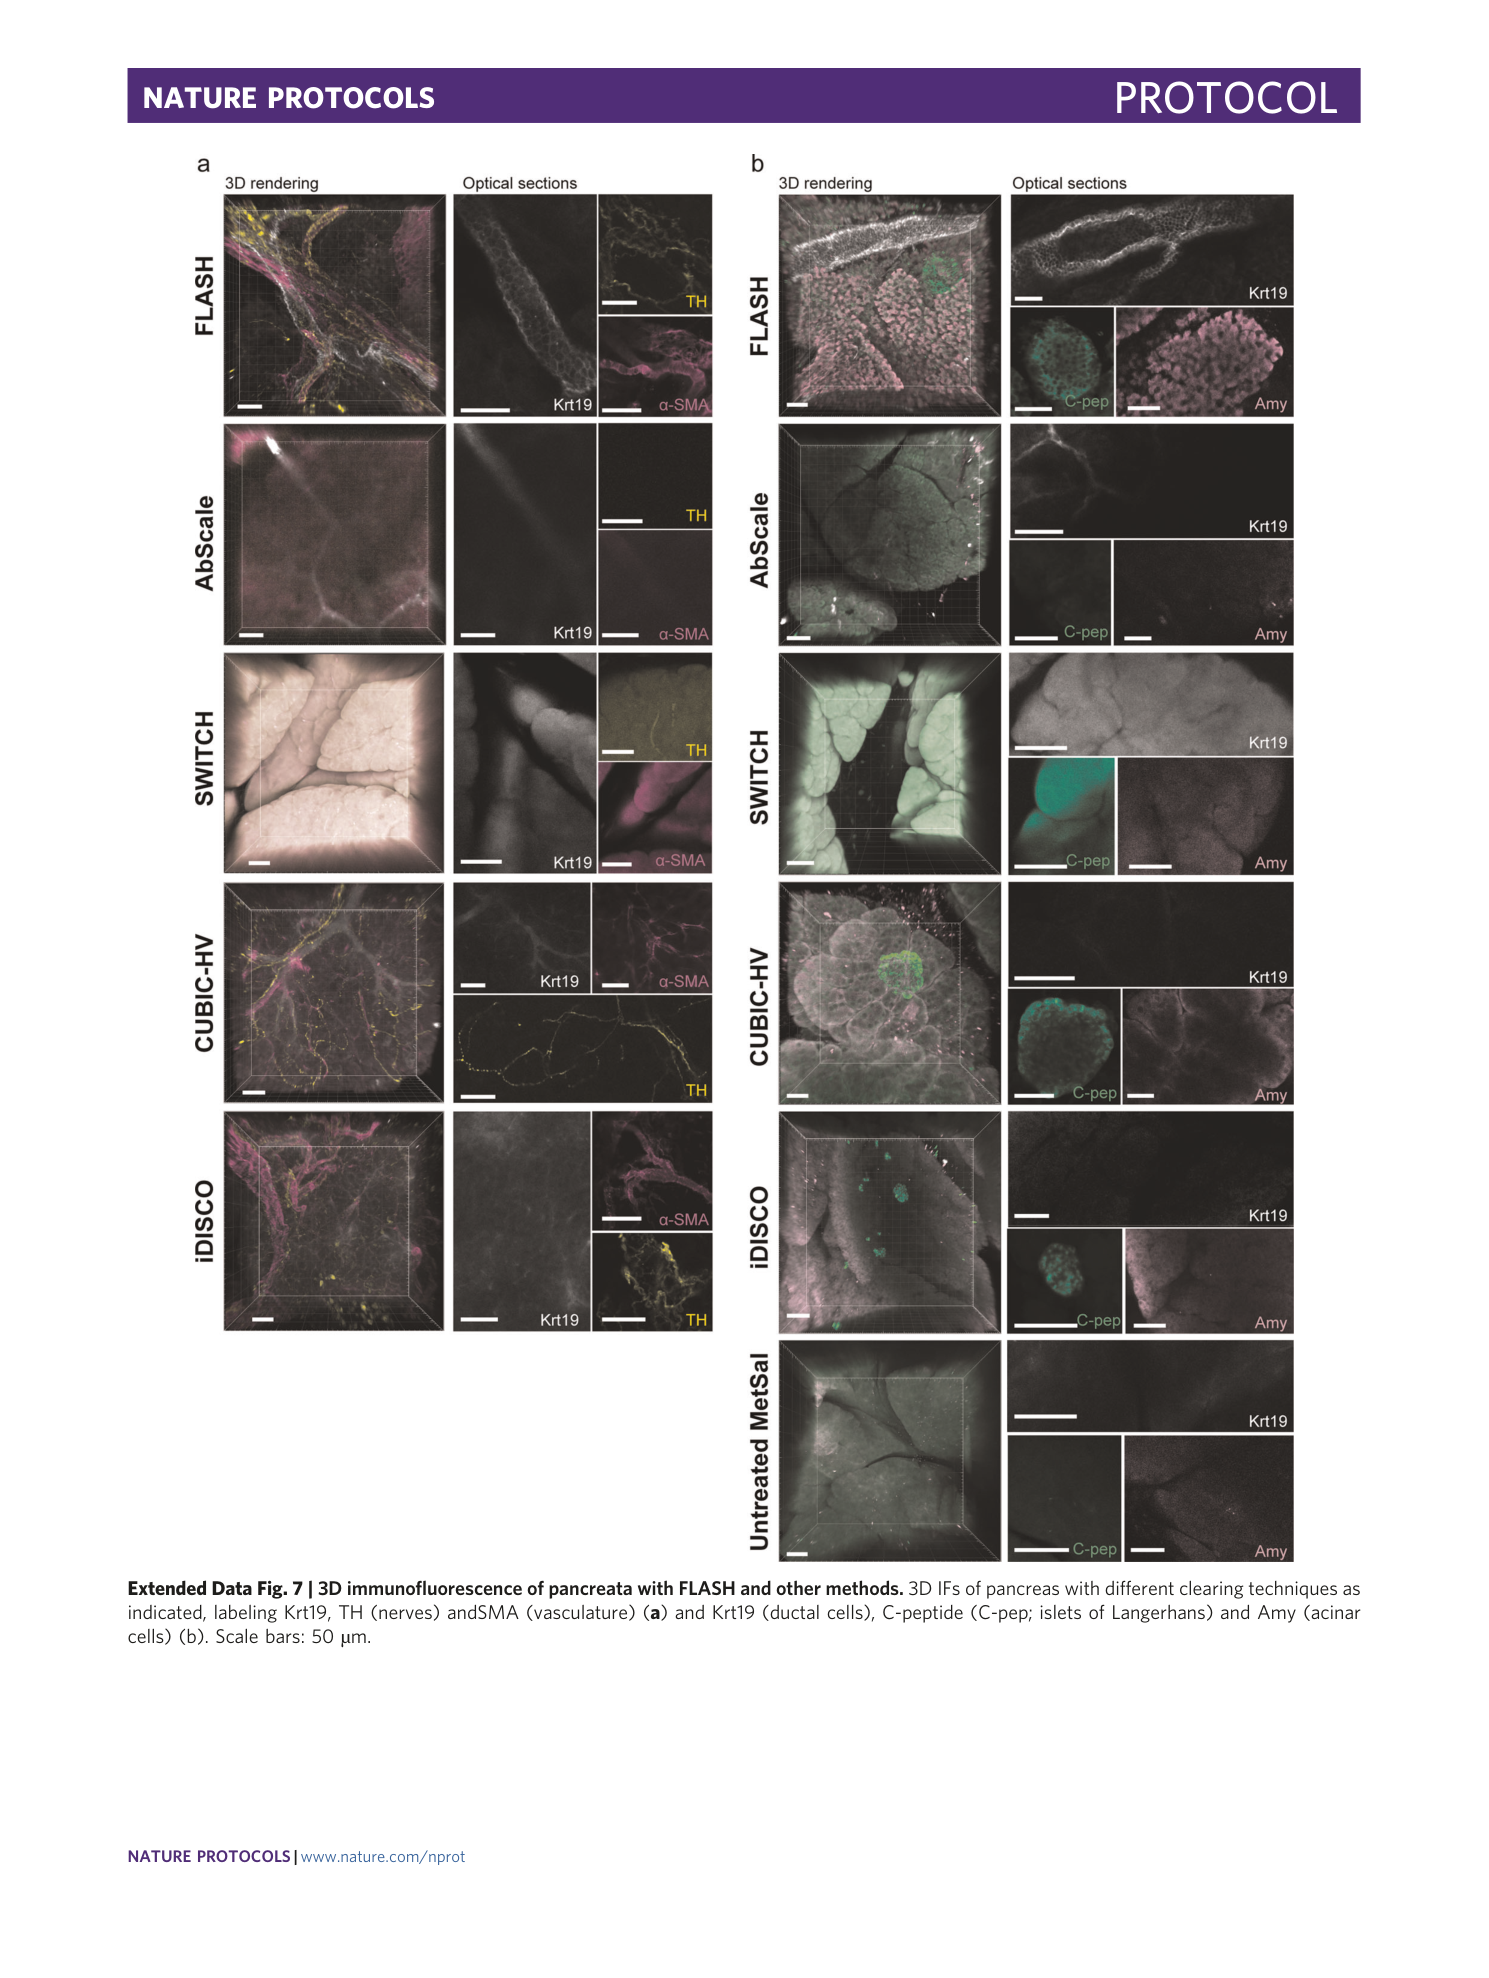
Extended Data Fig. 7 3D immunofluorescence of pancreata with FLASH and other methods.
3D IFs of pancreas with different clearing techniques as indicated, labeling Krt19, TH (nerves) andSMA (vasculature) ( a ) and Krt19 (ductal cells), C-peptide (C-pep; islets of Langerhans) and Amy (acinar cells) (b). Scale bars: 50 µm.
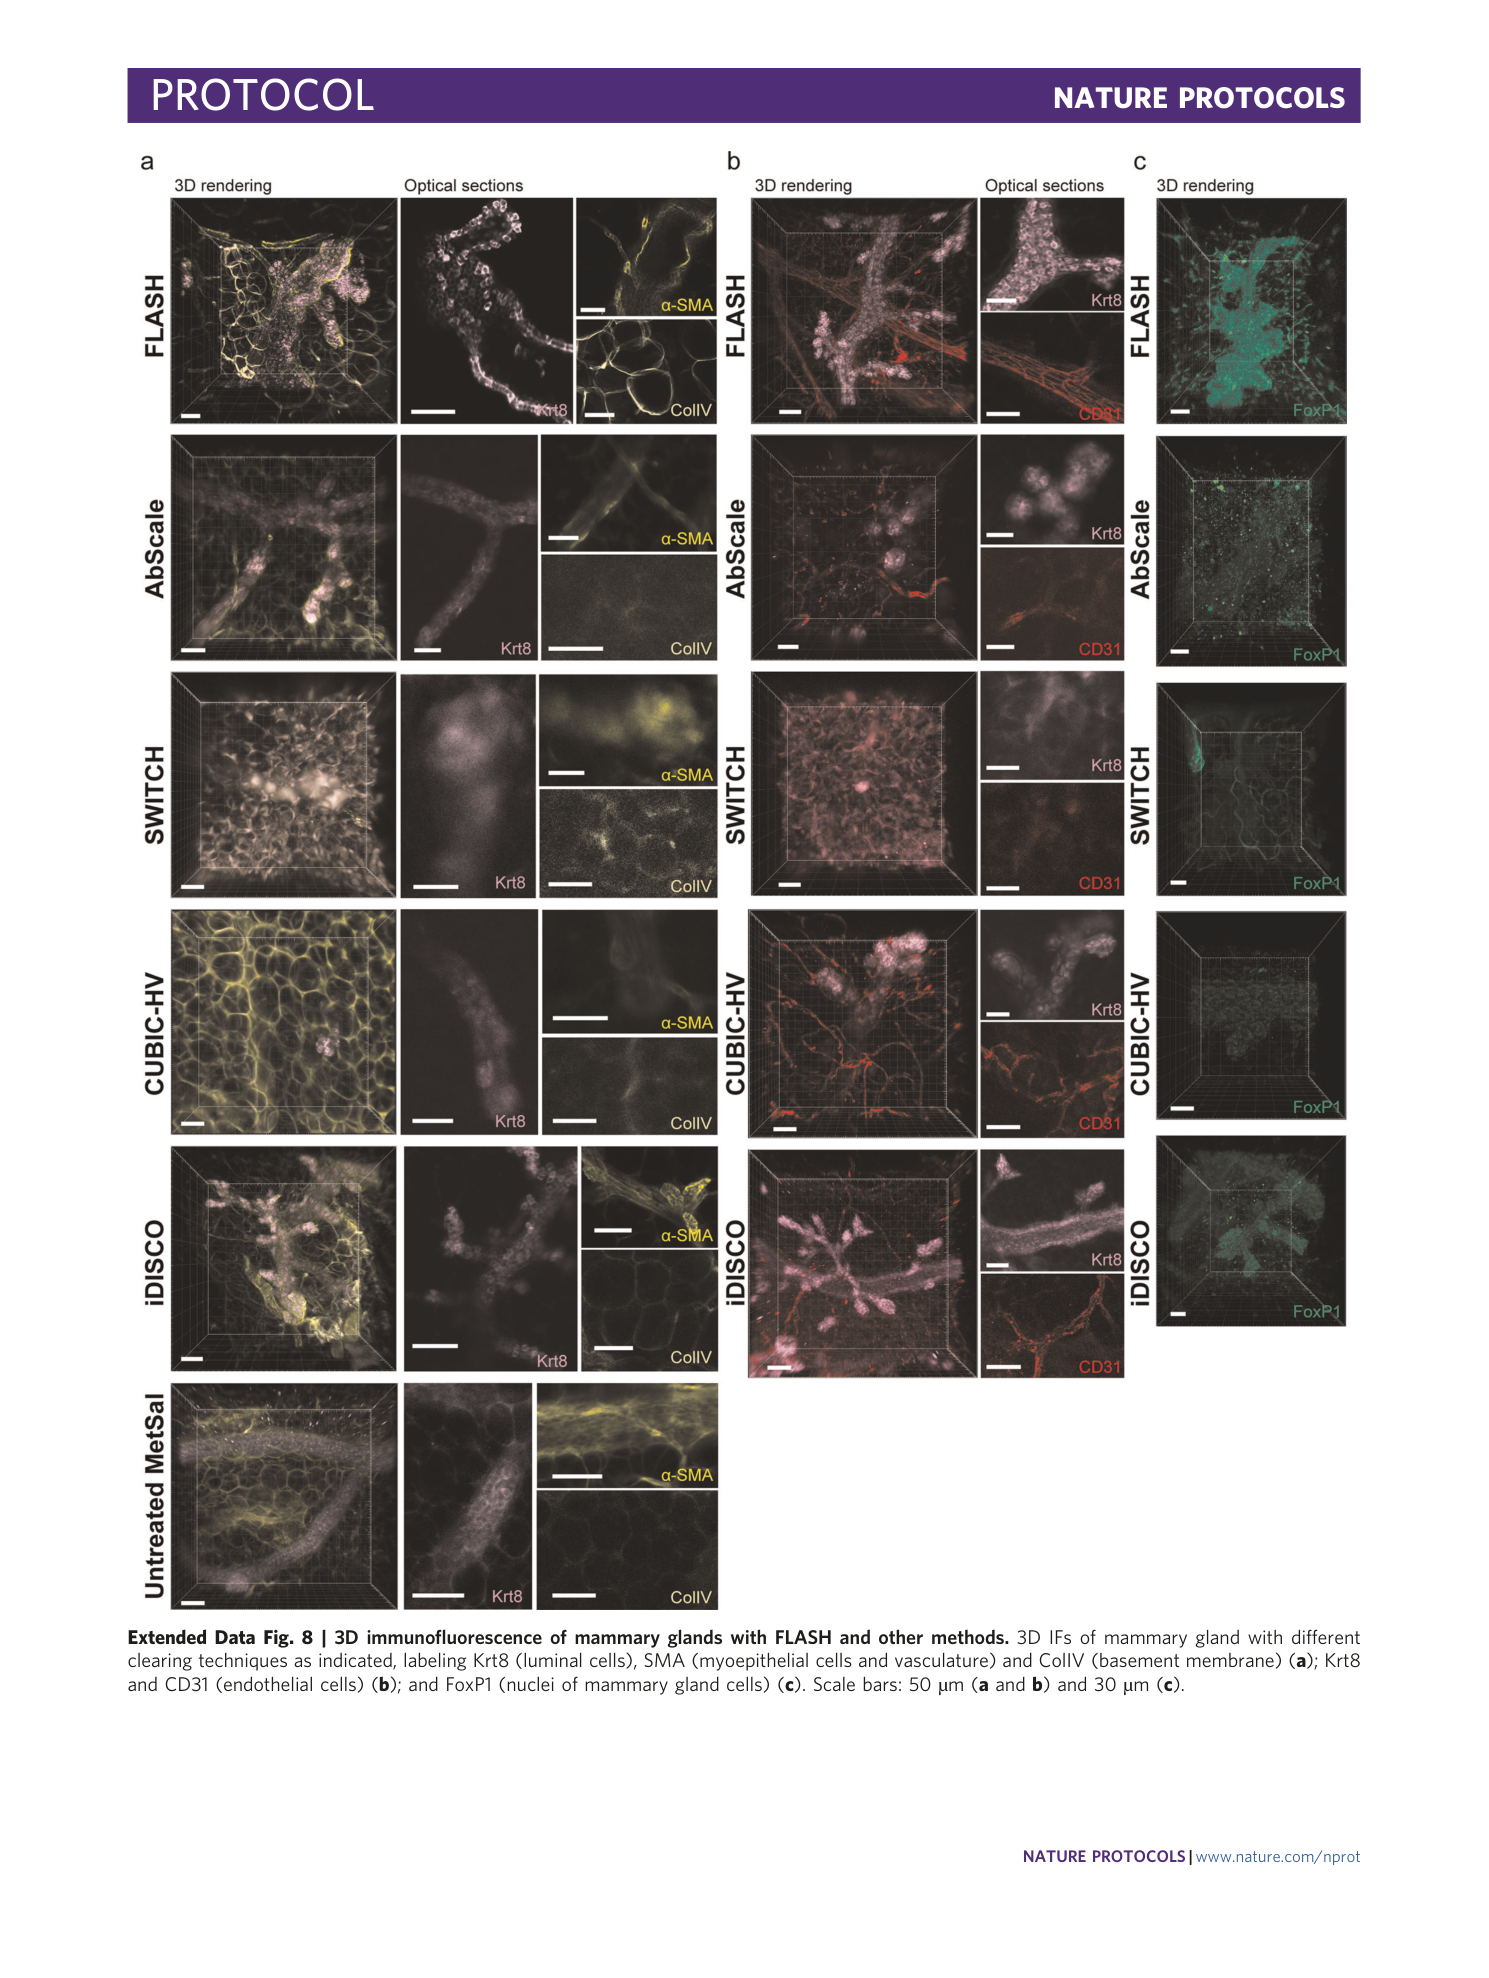
Extended Data Fig. 8 3D immunofluorescence of mammary glands with FLASH and other methods.
3D IFs of mammary gland with different clearing techniques as indicated, labeling Krt8 (luminal cells), SMA (myoepithelial cells and vasculature) and ColIV (basement membrane) ( a ); Krt8 and CD31 (endothelial cells) ( b ); and FoxP1 (nuclei of mammary gland cells) ( c ). Scale bars: 50 µm ( a and b ) and 30 µm ( c ).
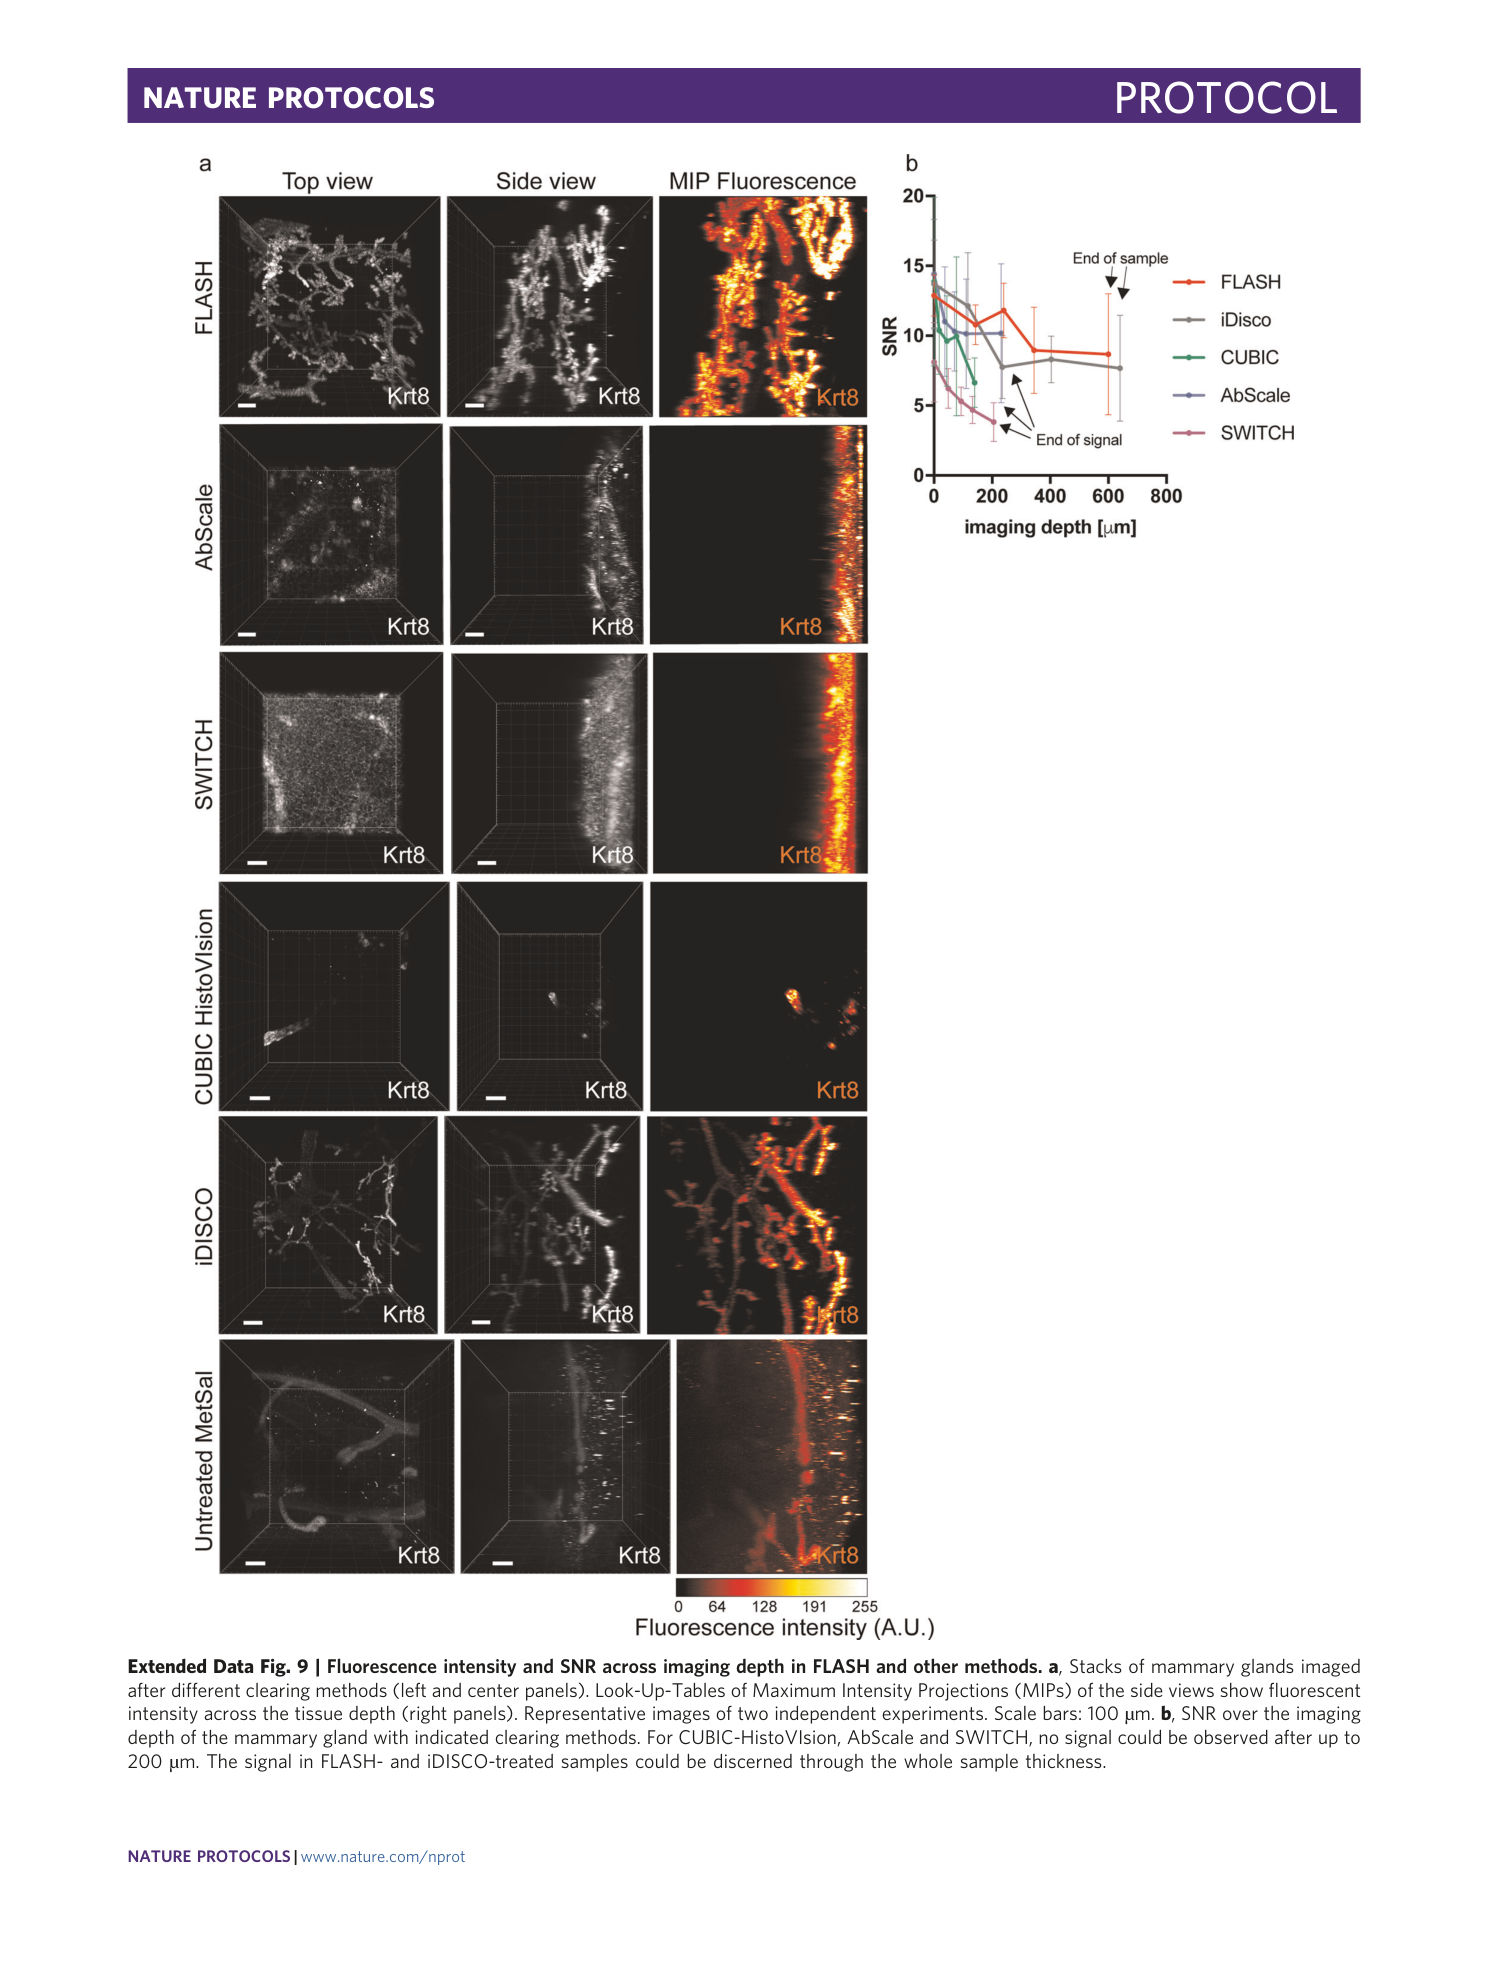
Extended Data Fig. 9 Fluorescence intensity and SNR across imaging depth in FLASH and other methods.
a , Stacks of mammary glands imaged after different clearing methods (left and center panels). Look-Up-Tables of Maximum Intensity Projections (MIPs) of the side views show fluorescent intensity across the tissue depth (right panels). Representative images of two independent experiments. Scale bars: 100 µm. b , SNR over the imaging depth of the mammary gland with indicated clearing methods. For CUBIC-HistoVIsion, AbScale and SWITCH, no signal could be observed after up to 200 µm. The signal in FLASH- and iDISCO-treated samples could be discerned through the whole sample thickness.
Supplementary information
Supplementary Information
Supplementary Methods and Supplementary Tables 1–4.
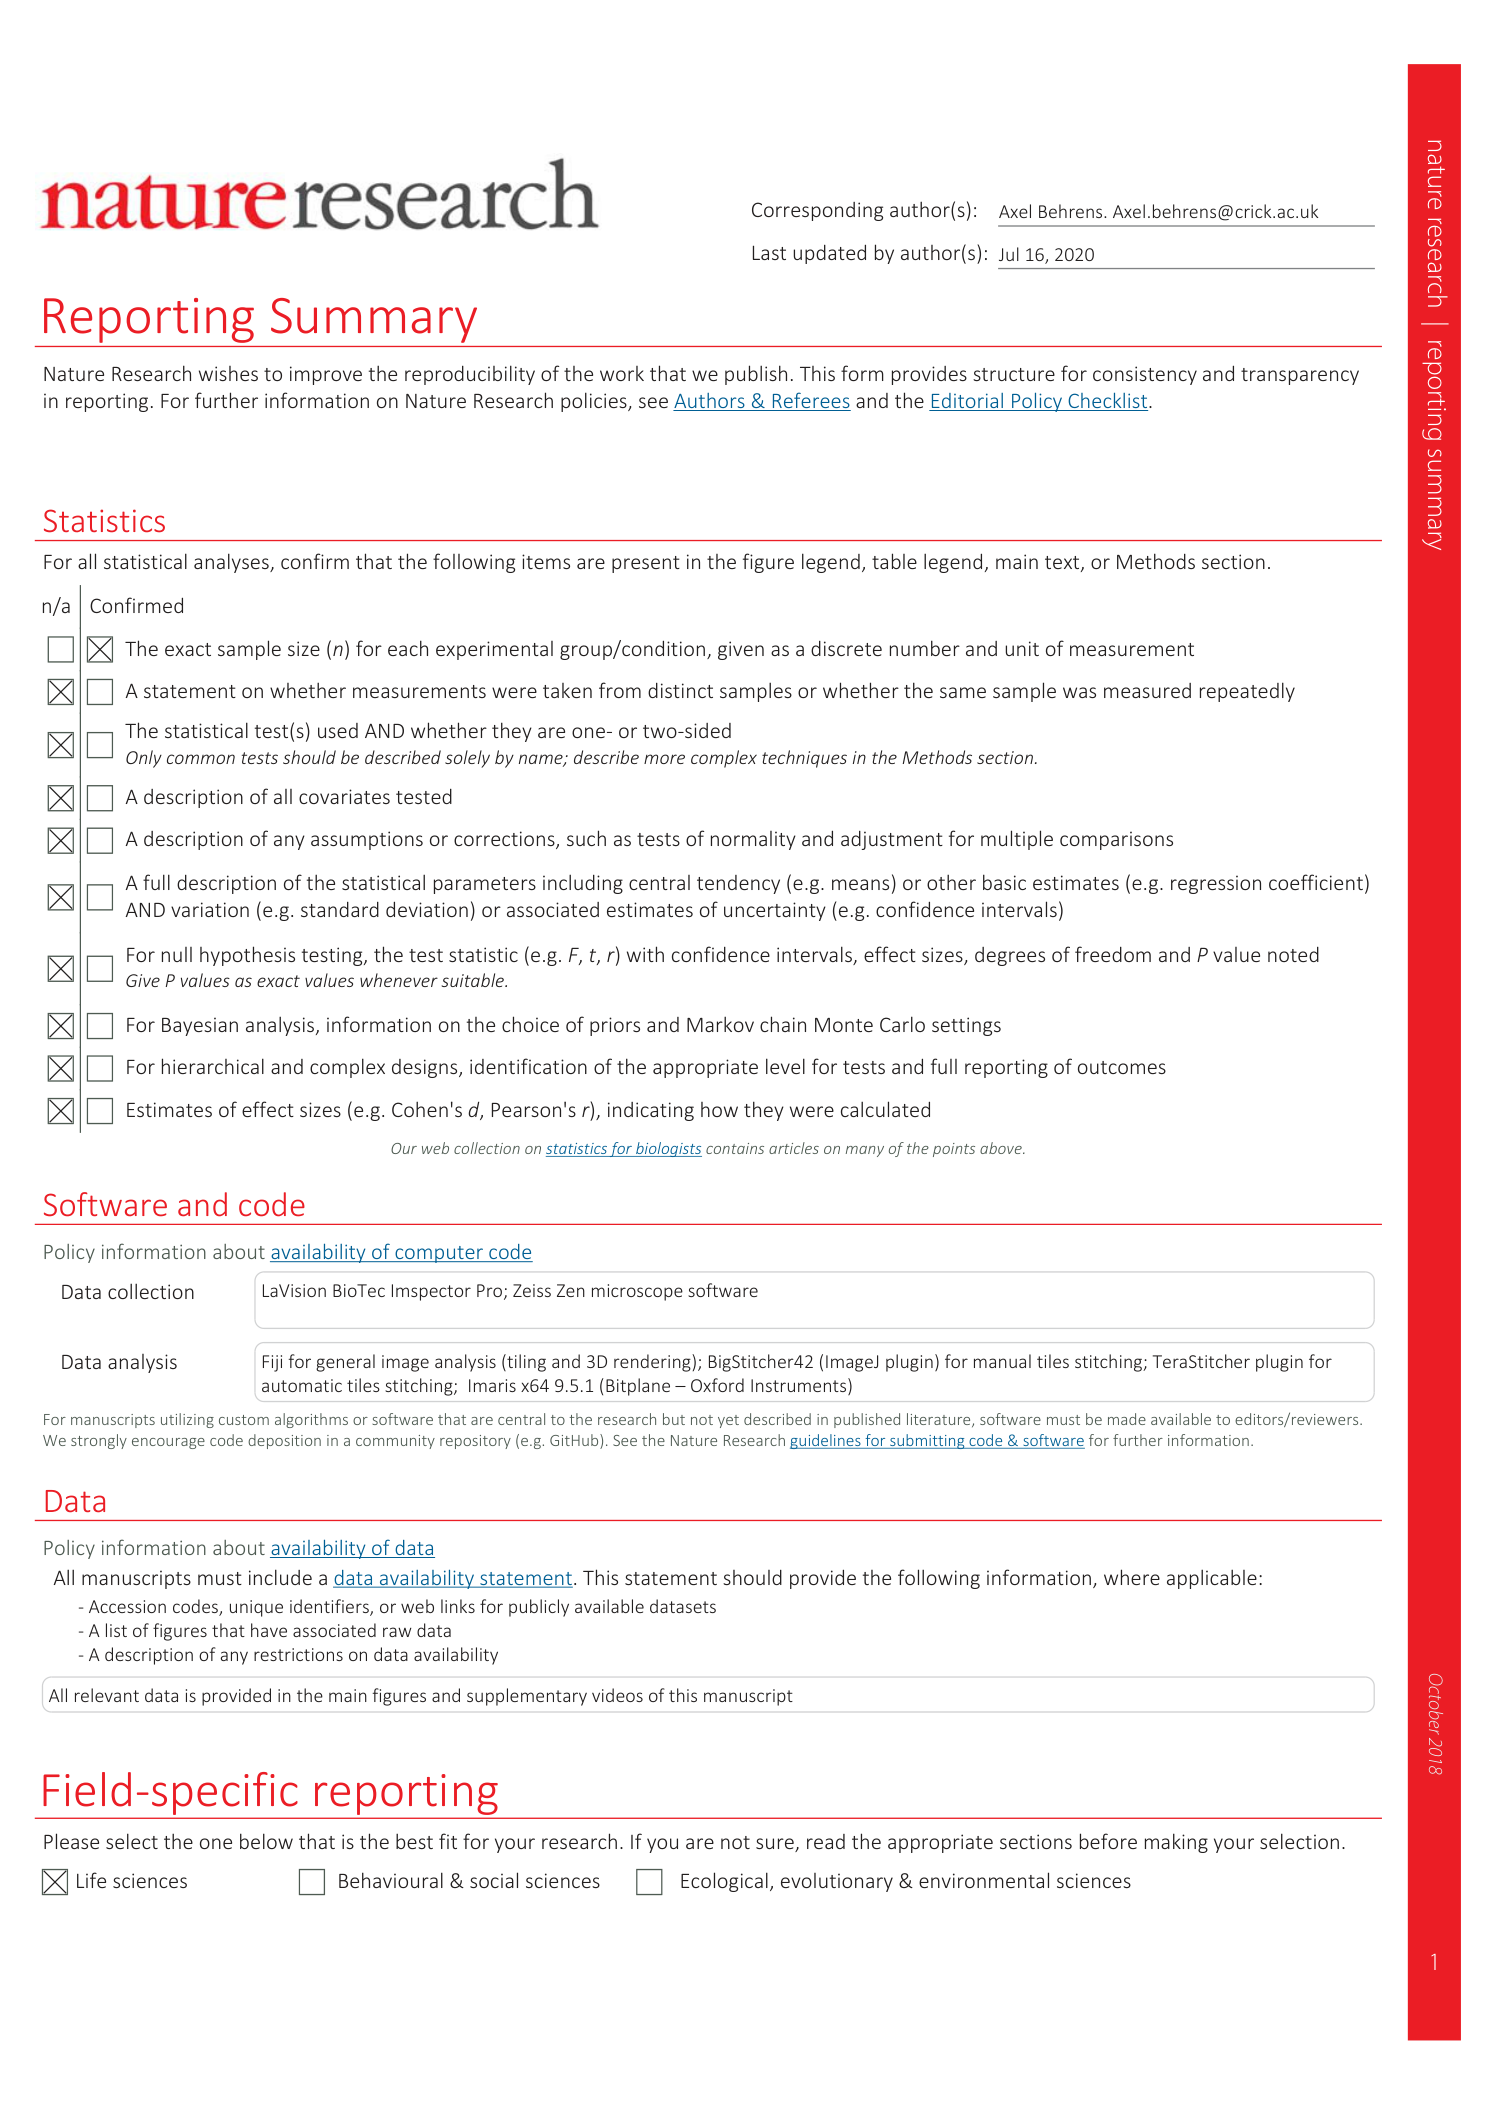
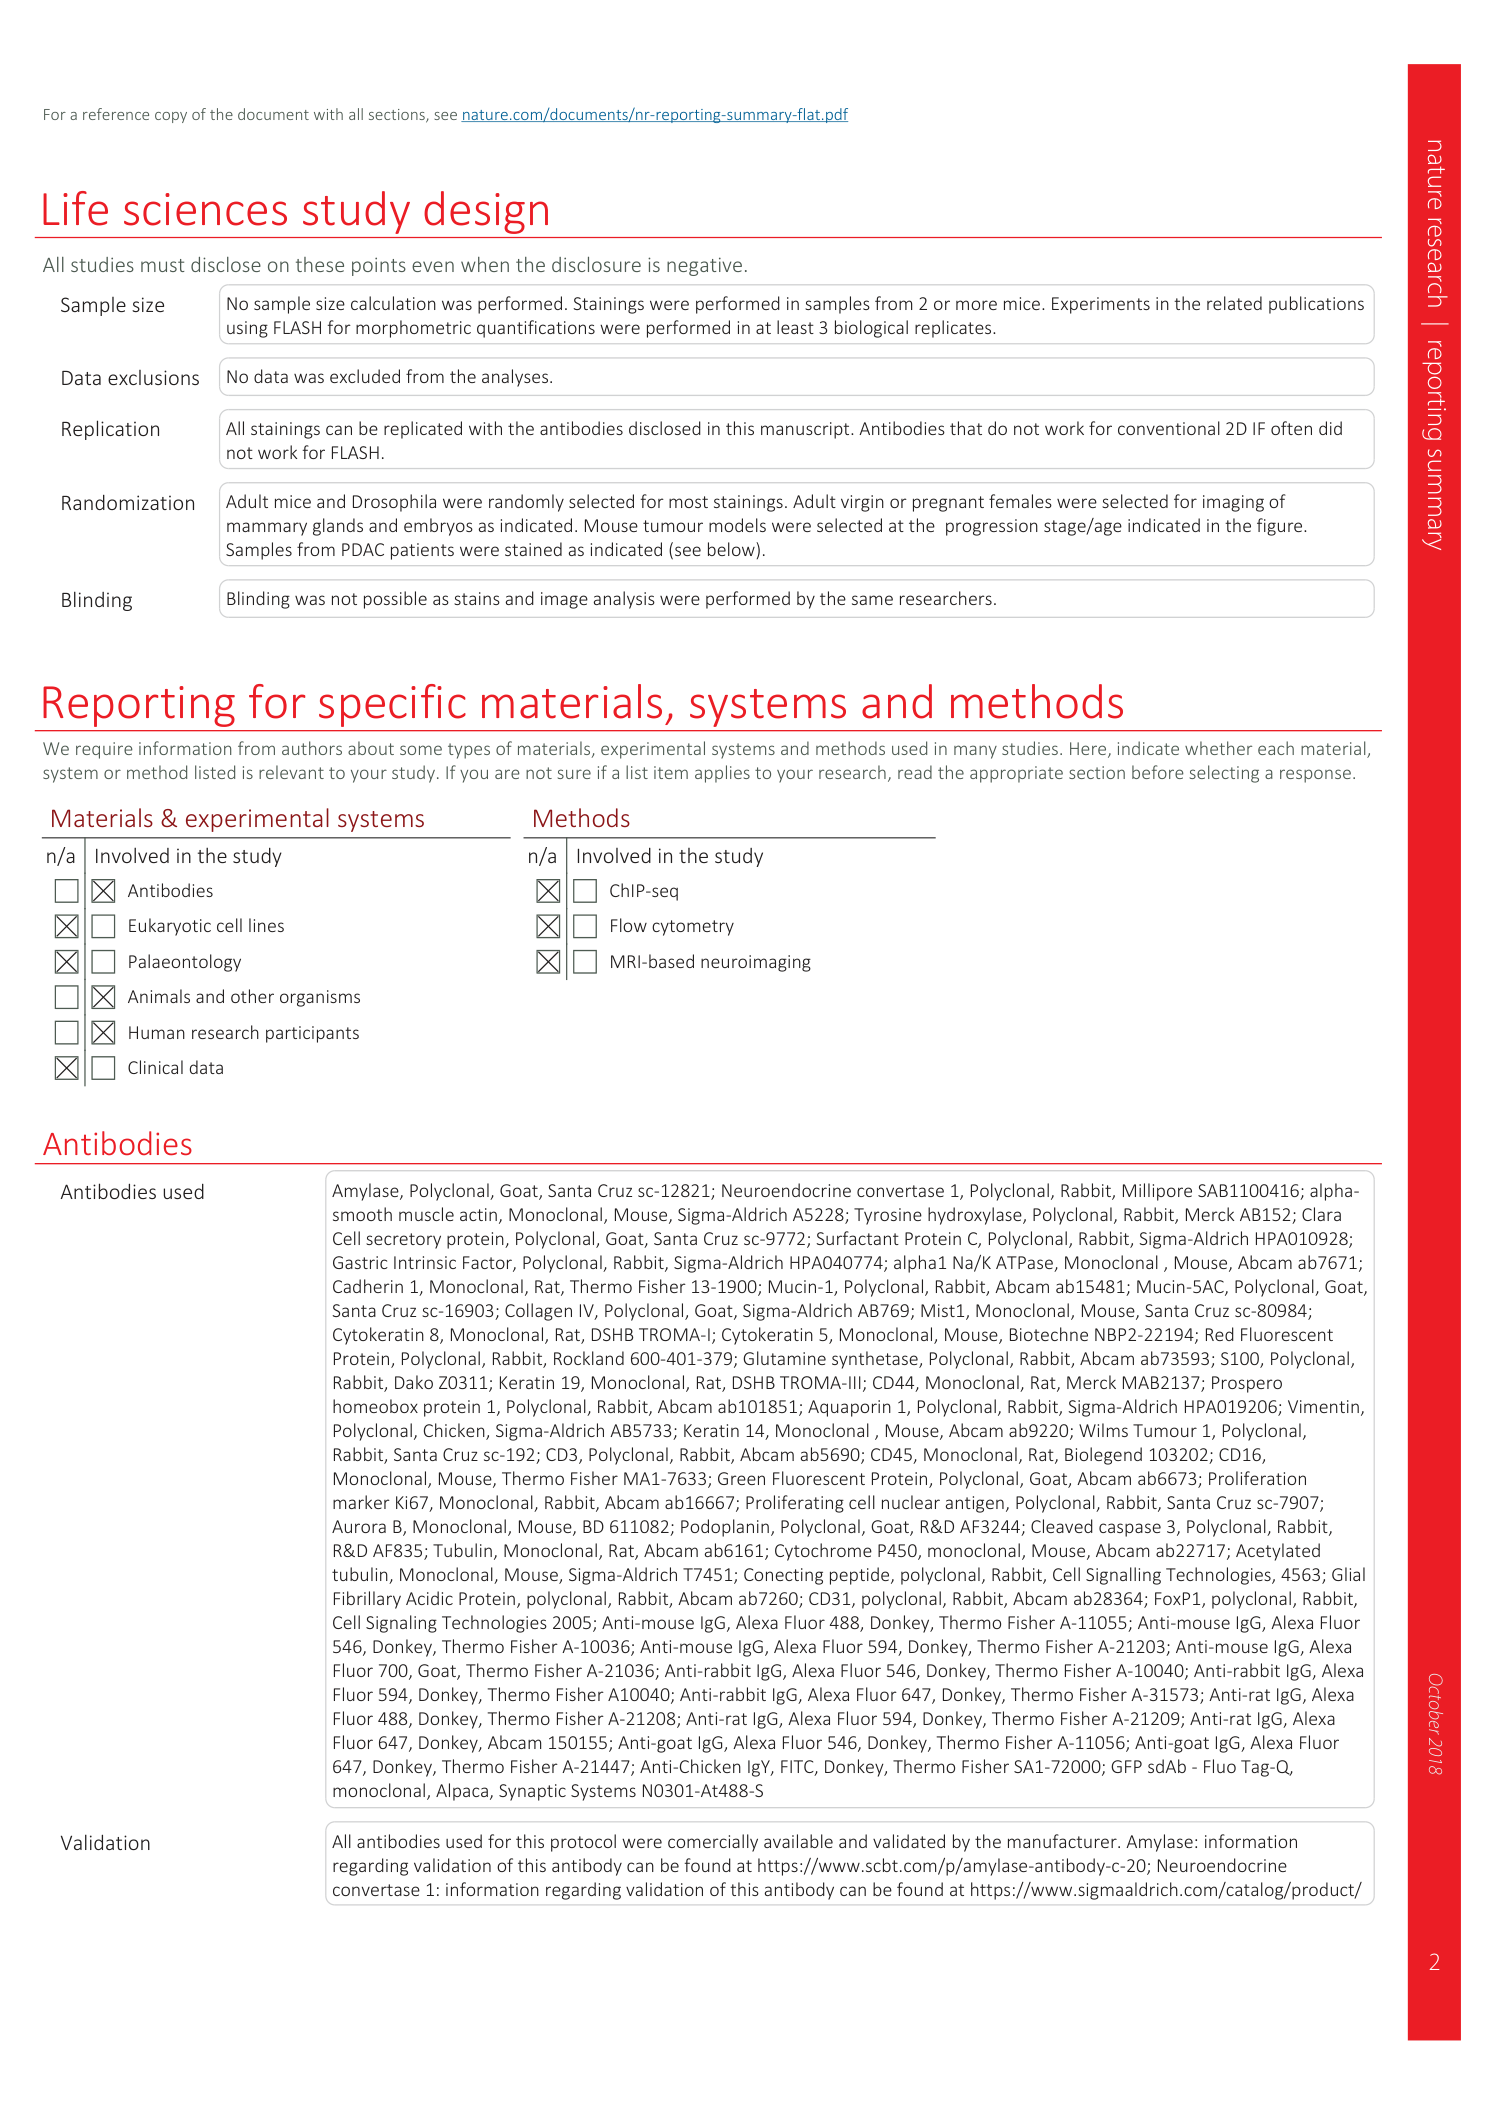
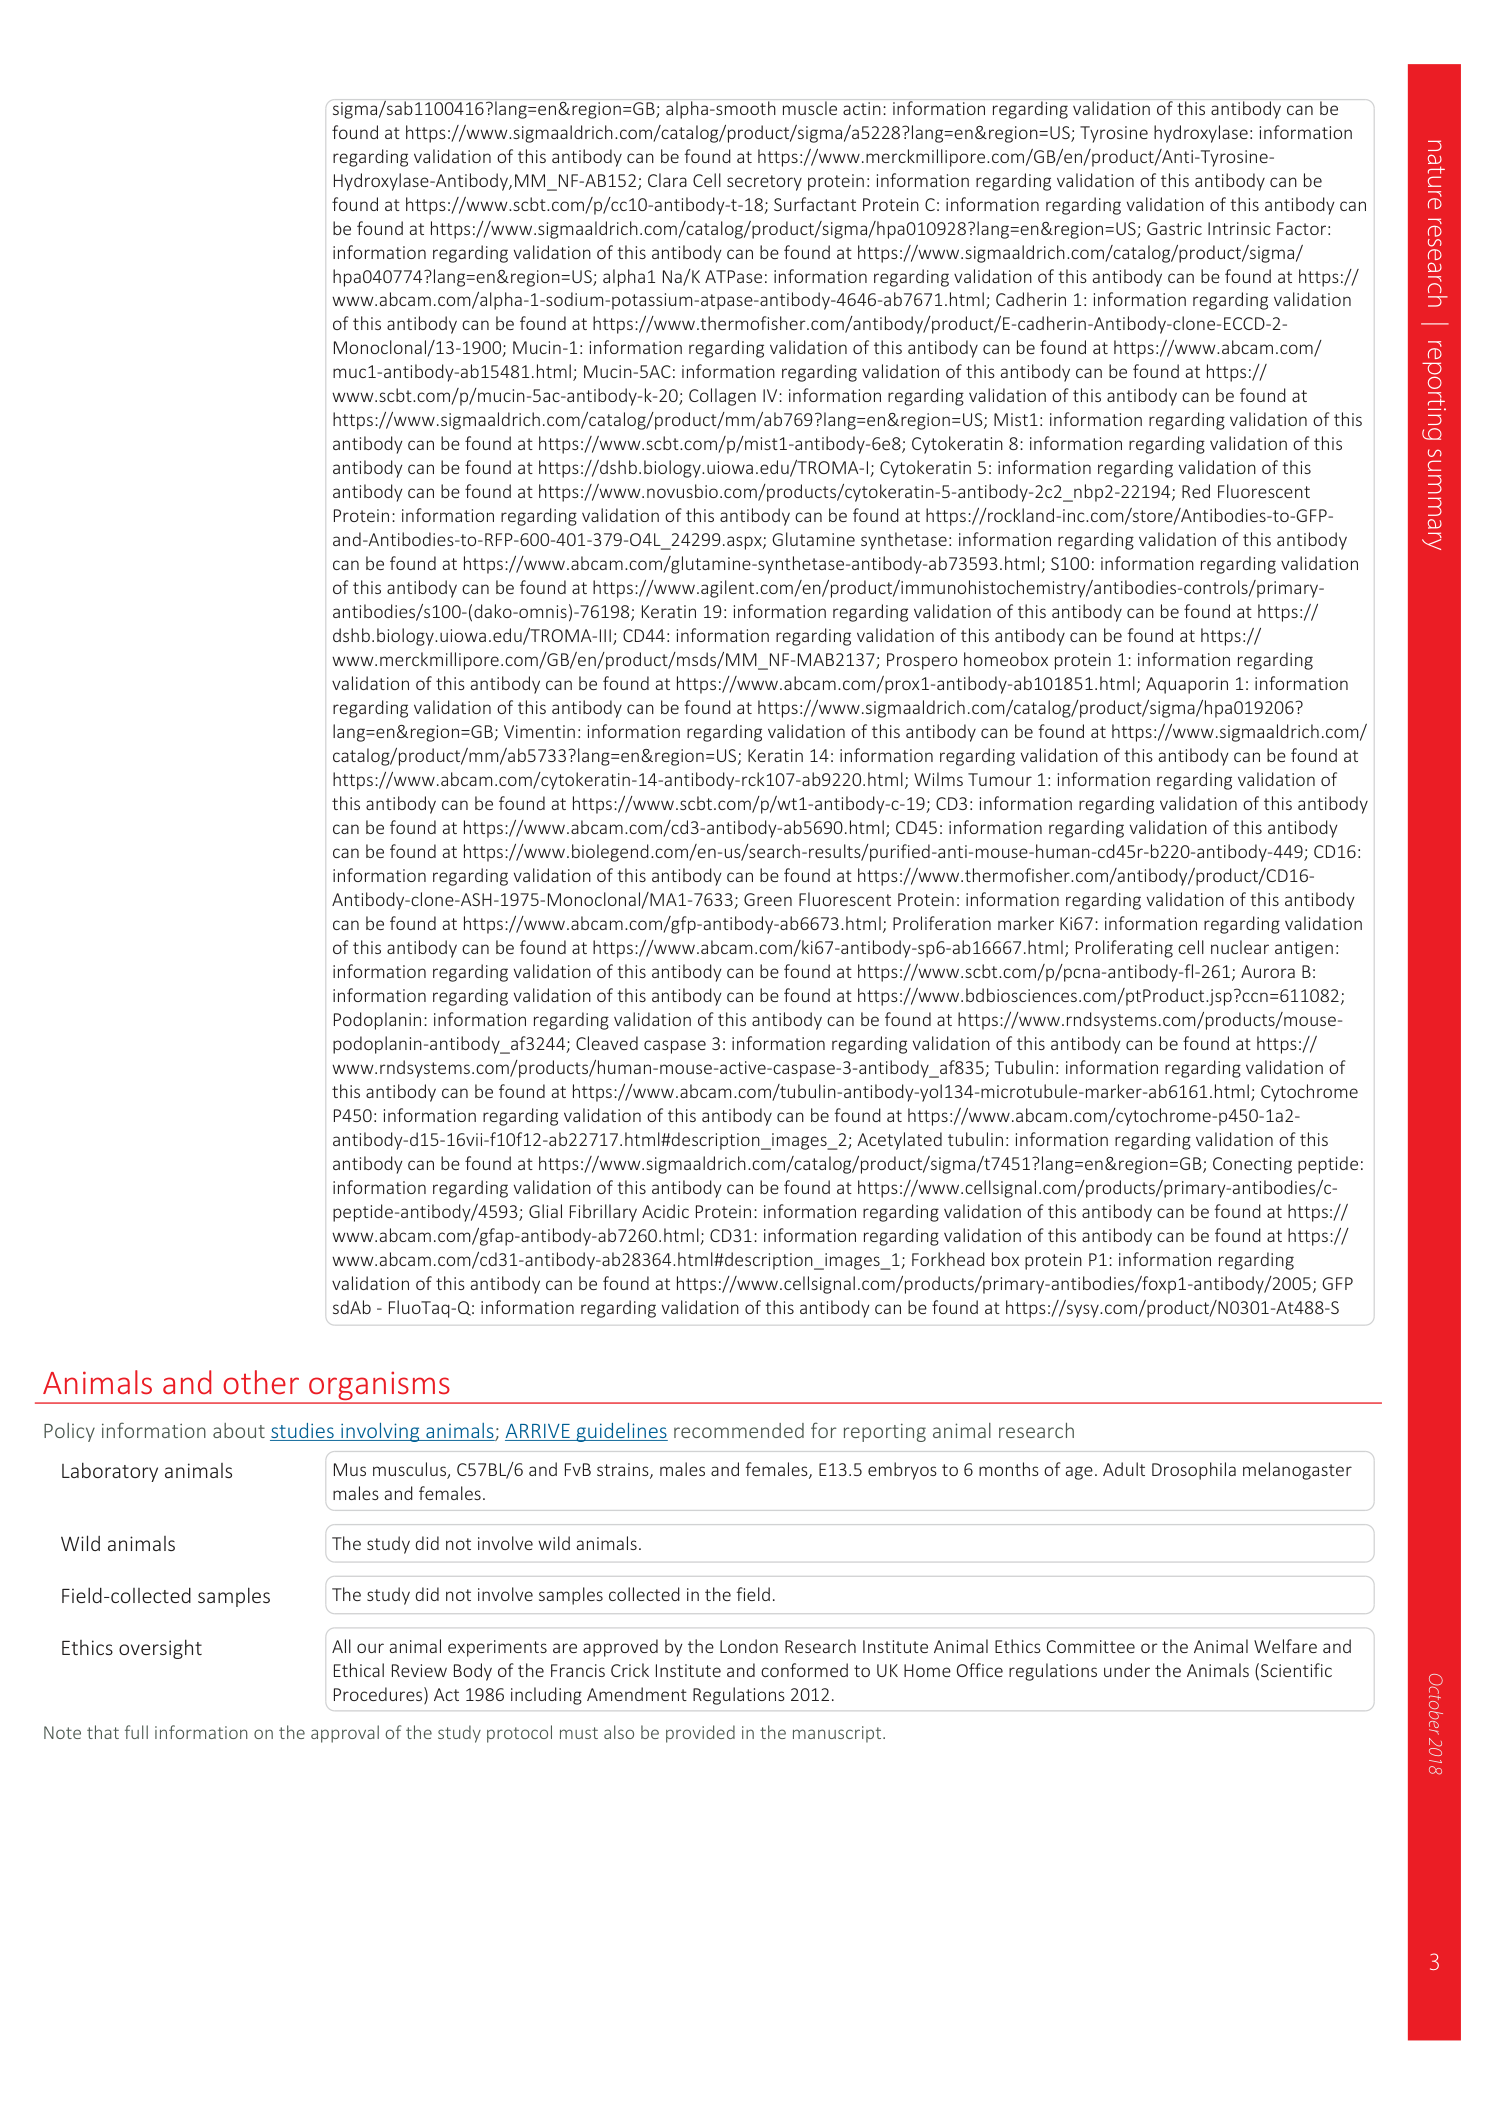
Reporting Summary
Supplementary Video 1
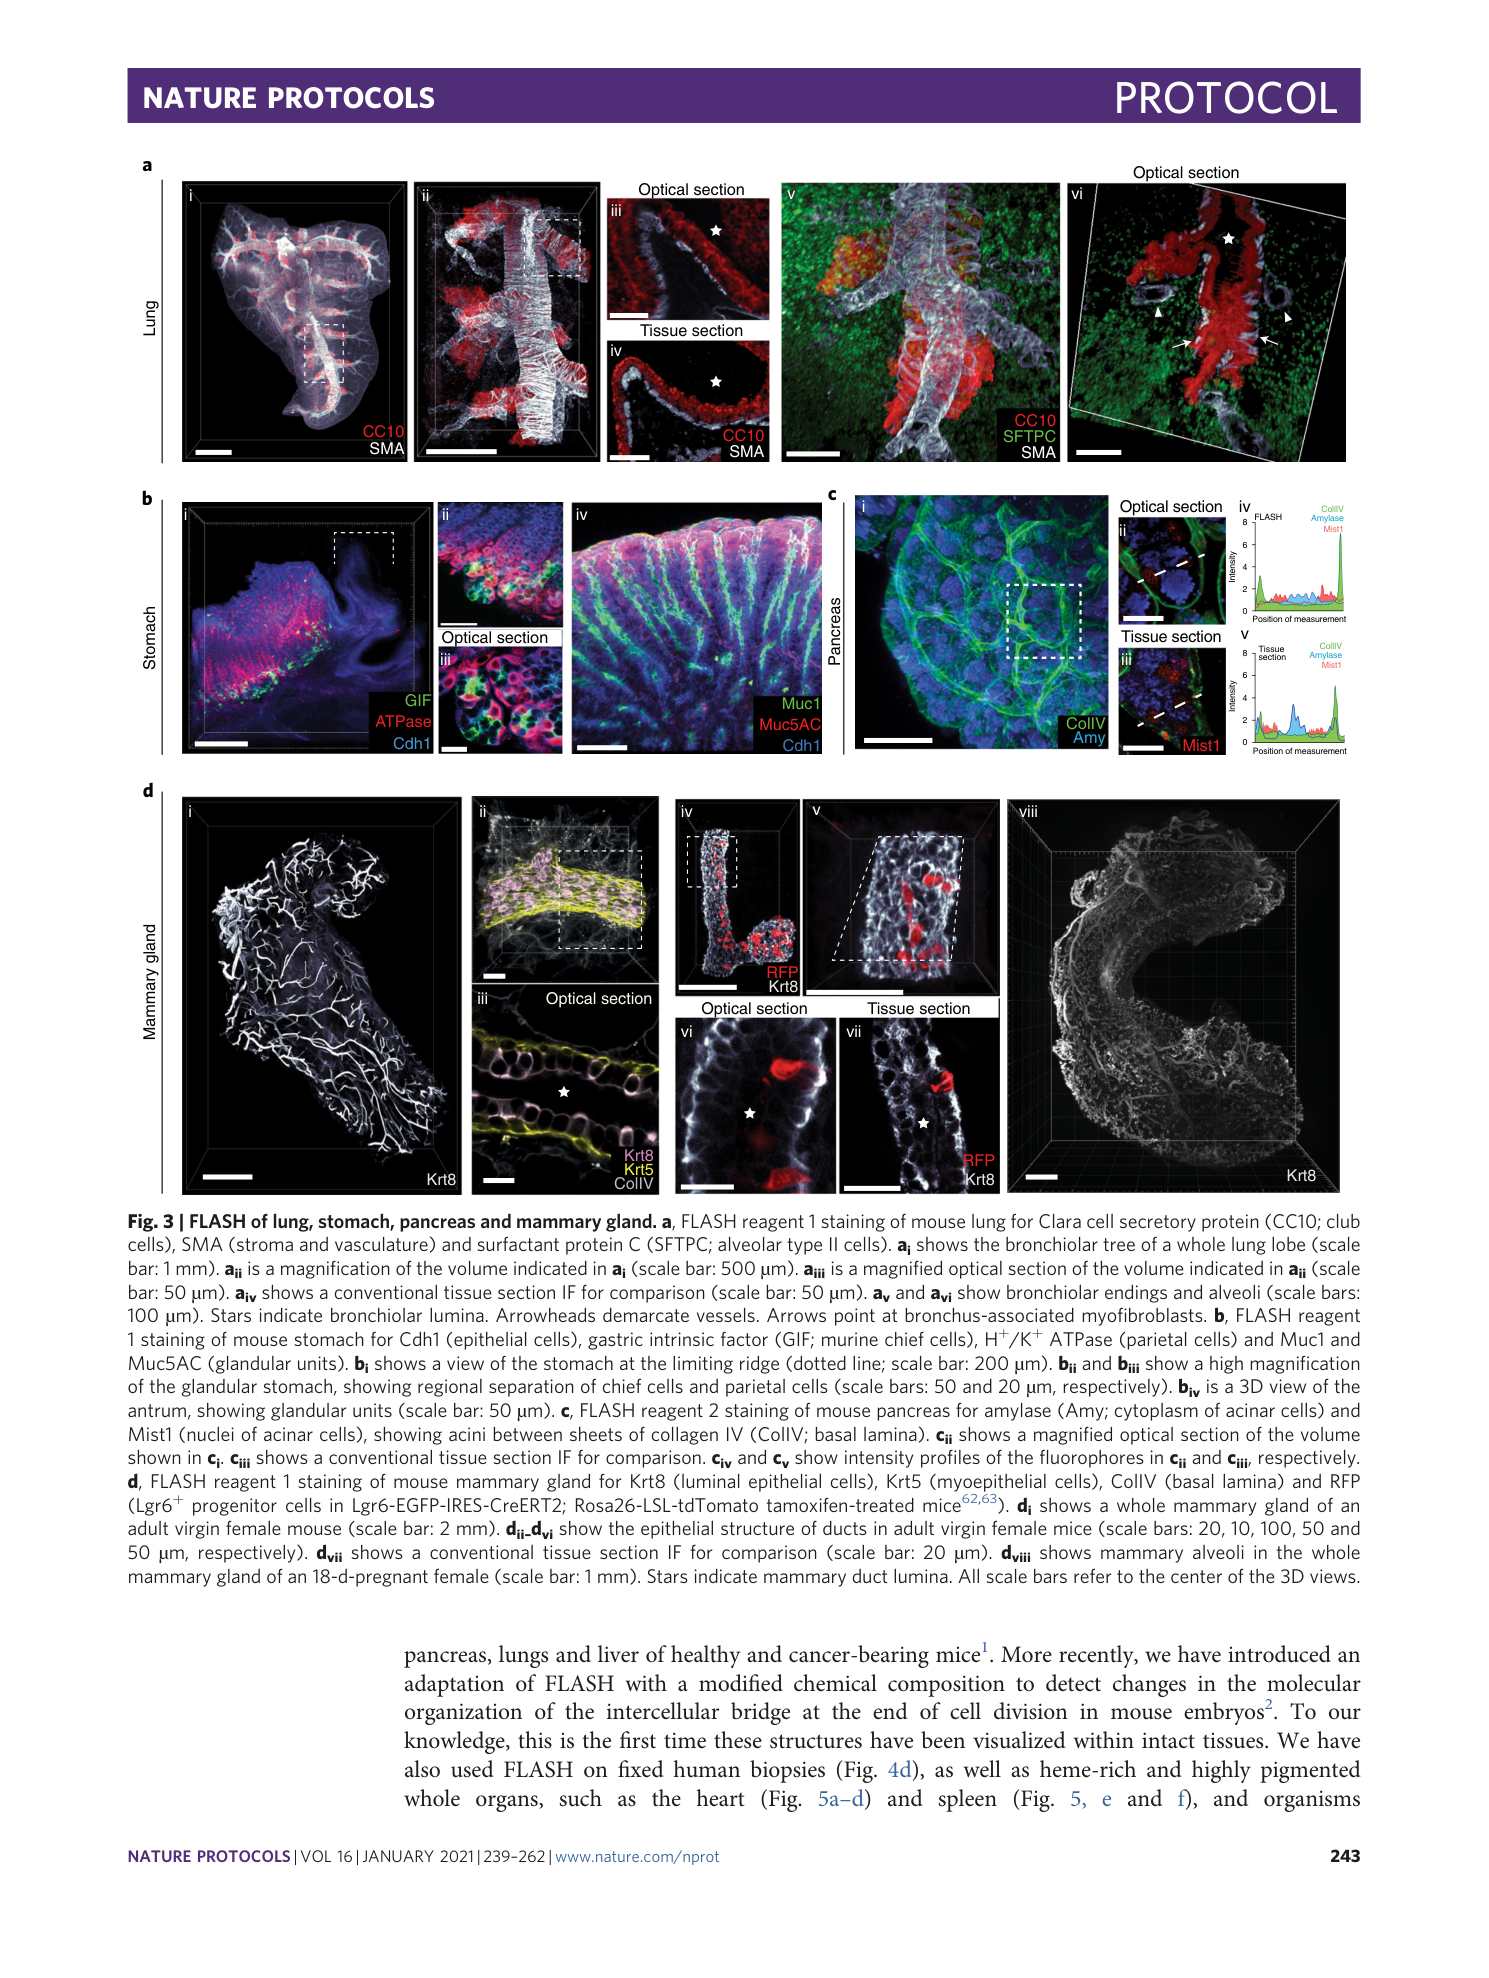
FLASH of lung. 3D confocal image of bronchiole and arteriole (SMA, magenta), Clara cells (CC10, green) and alveolar type II cells (SFTPC, cyan) in a mouse lung treated with FLASH reagent 1.
Supplementary Video 2
FLASH of pancreas. Confocal image of pancreatic duct (Krt19, white) and islets of Langerhans (PCSK1, red) in a mouse pancreas treated with FLASH reagent 1.
Supplementary Video 3
FLASH of whole mammary gland. Light-sheet image of mammary ducts (Krt8 and Krt5, pink) and basal lamina-defining adipocytes (ColIV, beige) of an entire mammary gland of an adult virgin mouse, treated with FLASH reagent 1.
Supplementary Video 4
FLASH of mammary epithelium. Confocal image of a duct in the mammary gland from Supplementary Video 3, showing luminal cells (Krt8, pink), myoepithelial cells (Krt5, yellow) and basal lamina-defining adipocytes (ColIV, beige).
Supplementary Video 5
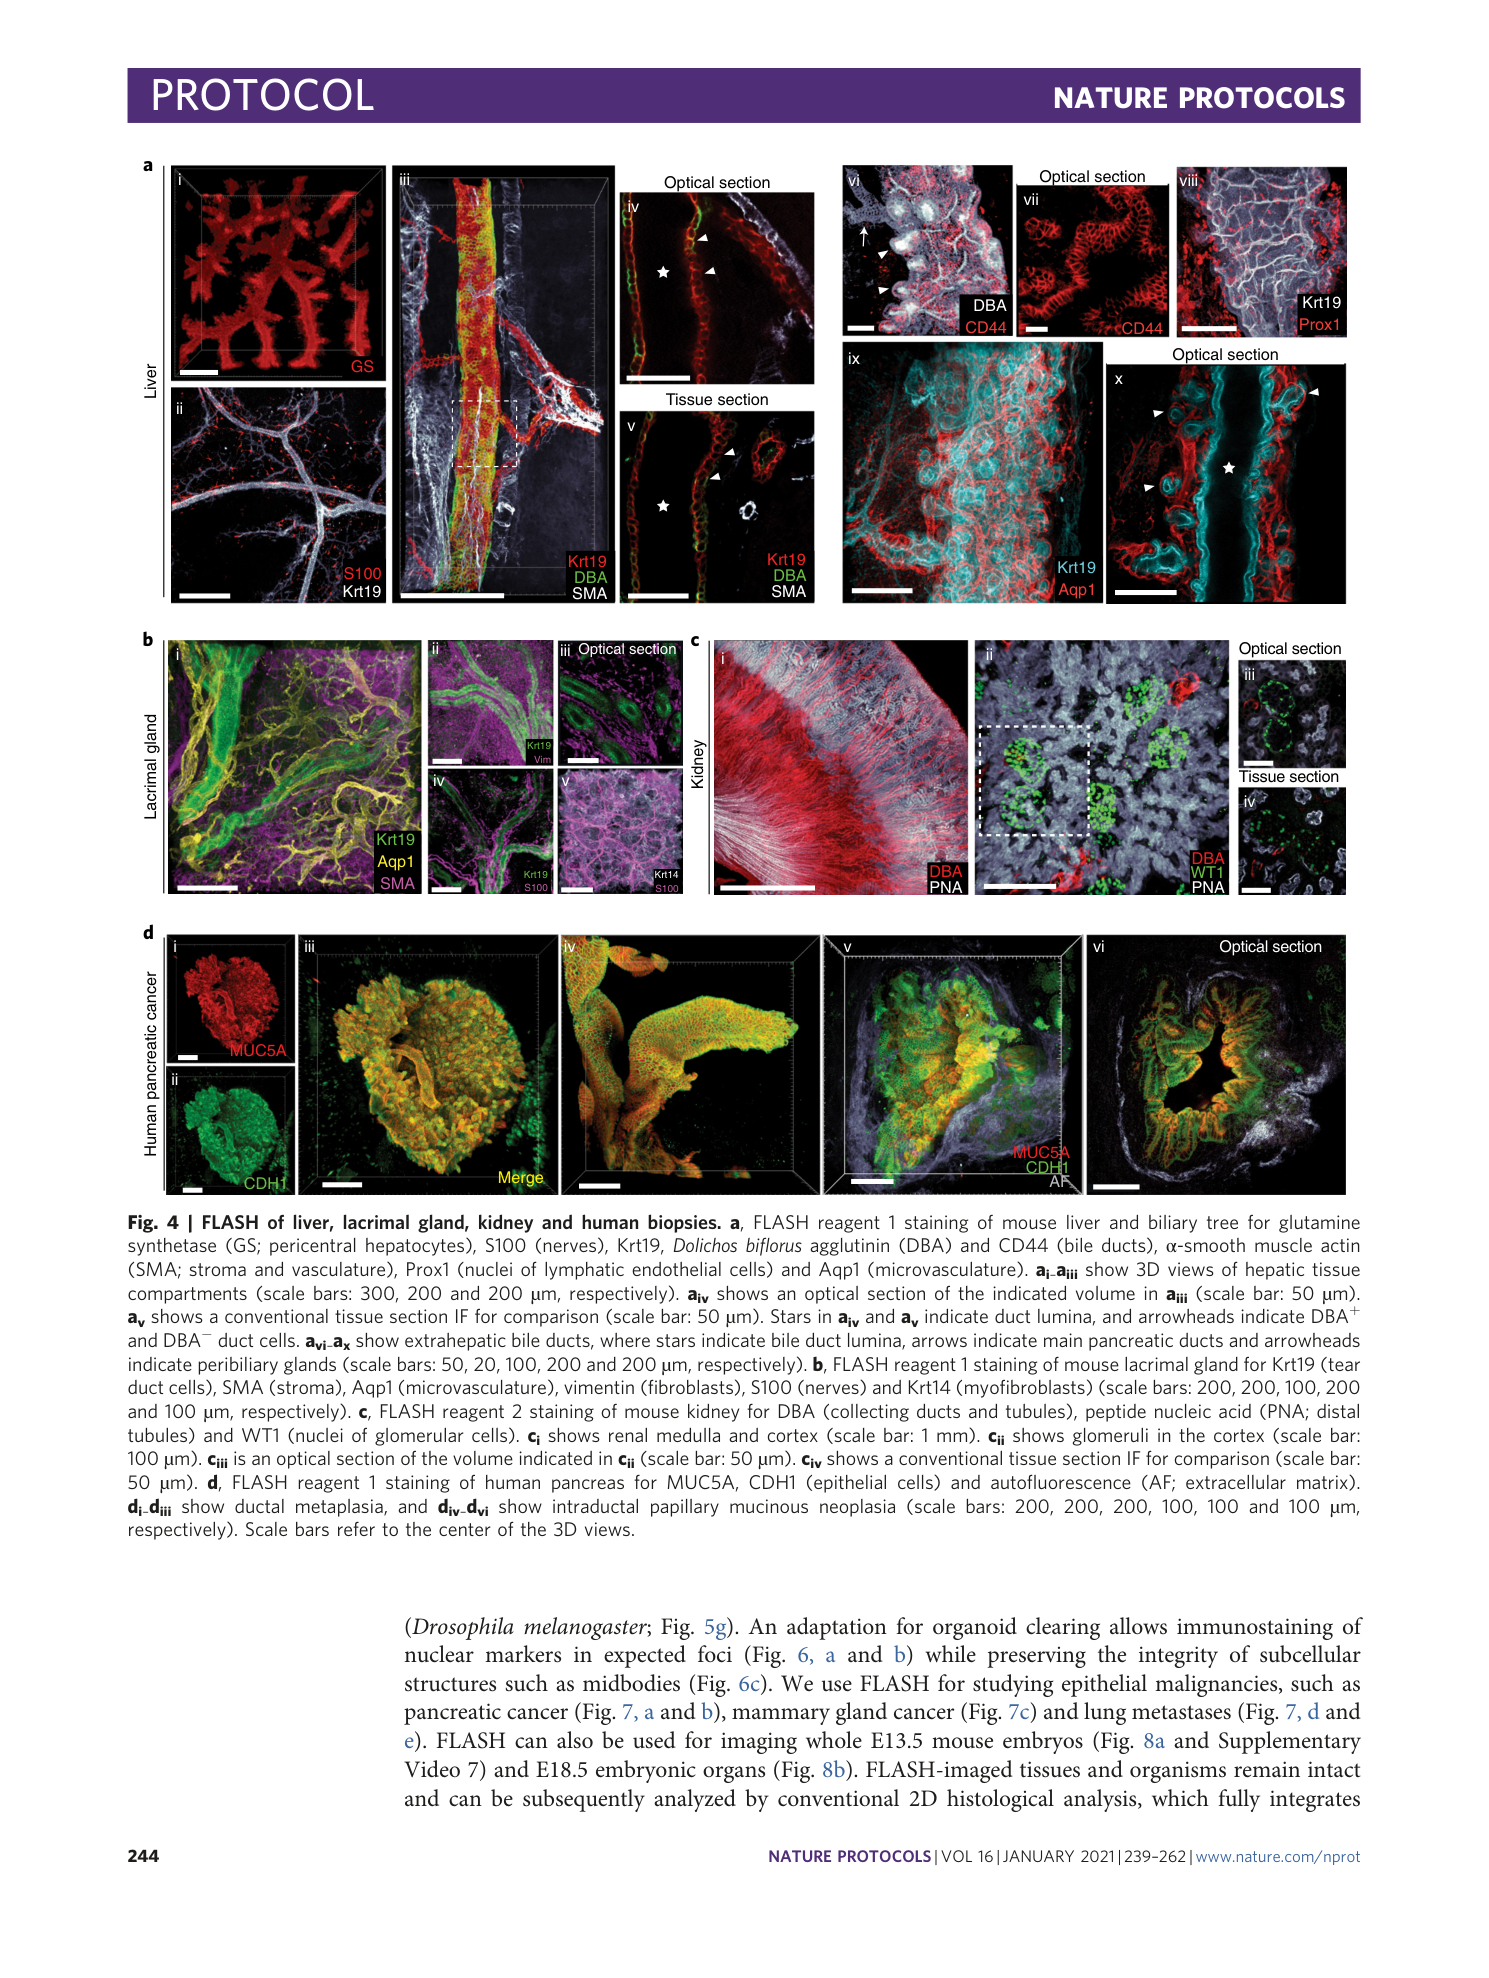
FLASH of bile duct. Confocal image of a murine extrahepatic bile duct (Krt19, cyan) and microvasculature (Aqp1, red) treated with FLASH reagent 1.
Supplementary Video 6
FLASH of lacrimal gland. Confocal image of tear ducts (Krt19, green), microvasculature (Aqp1, yellow) and stroma (SMA, magenta) of a mouse lacrimal gland treated with FLASH reagent 1.
Supplementary Video 7
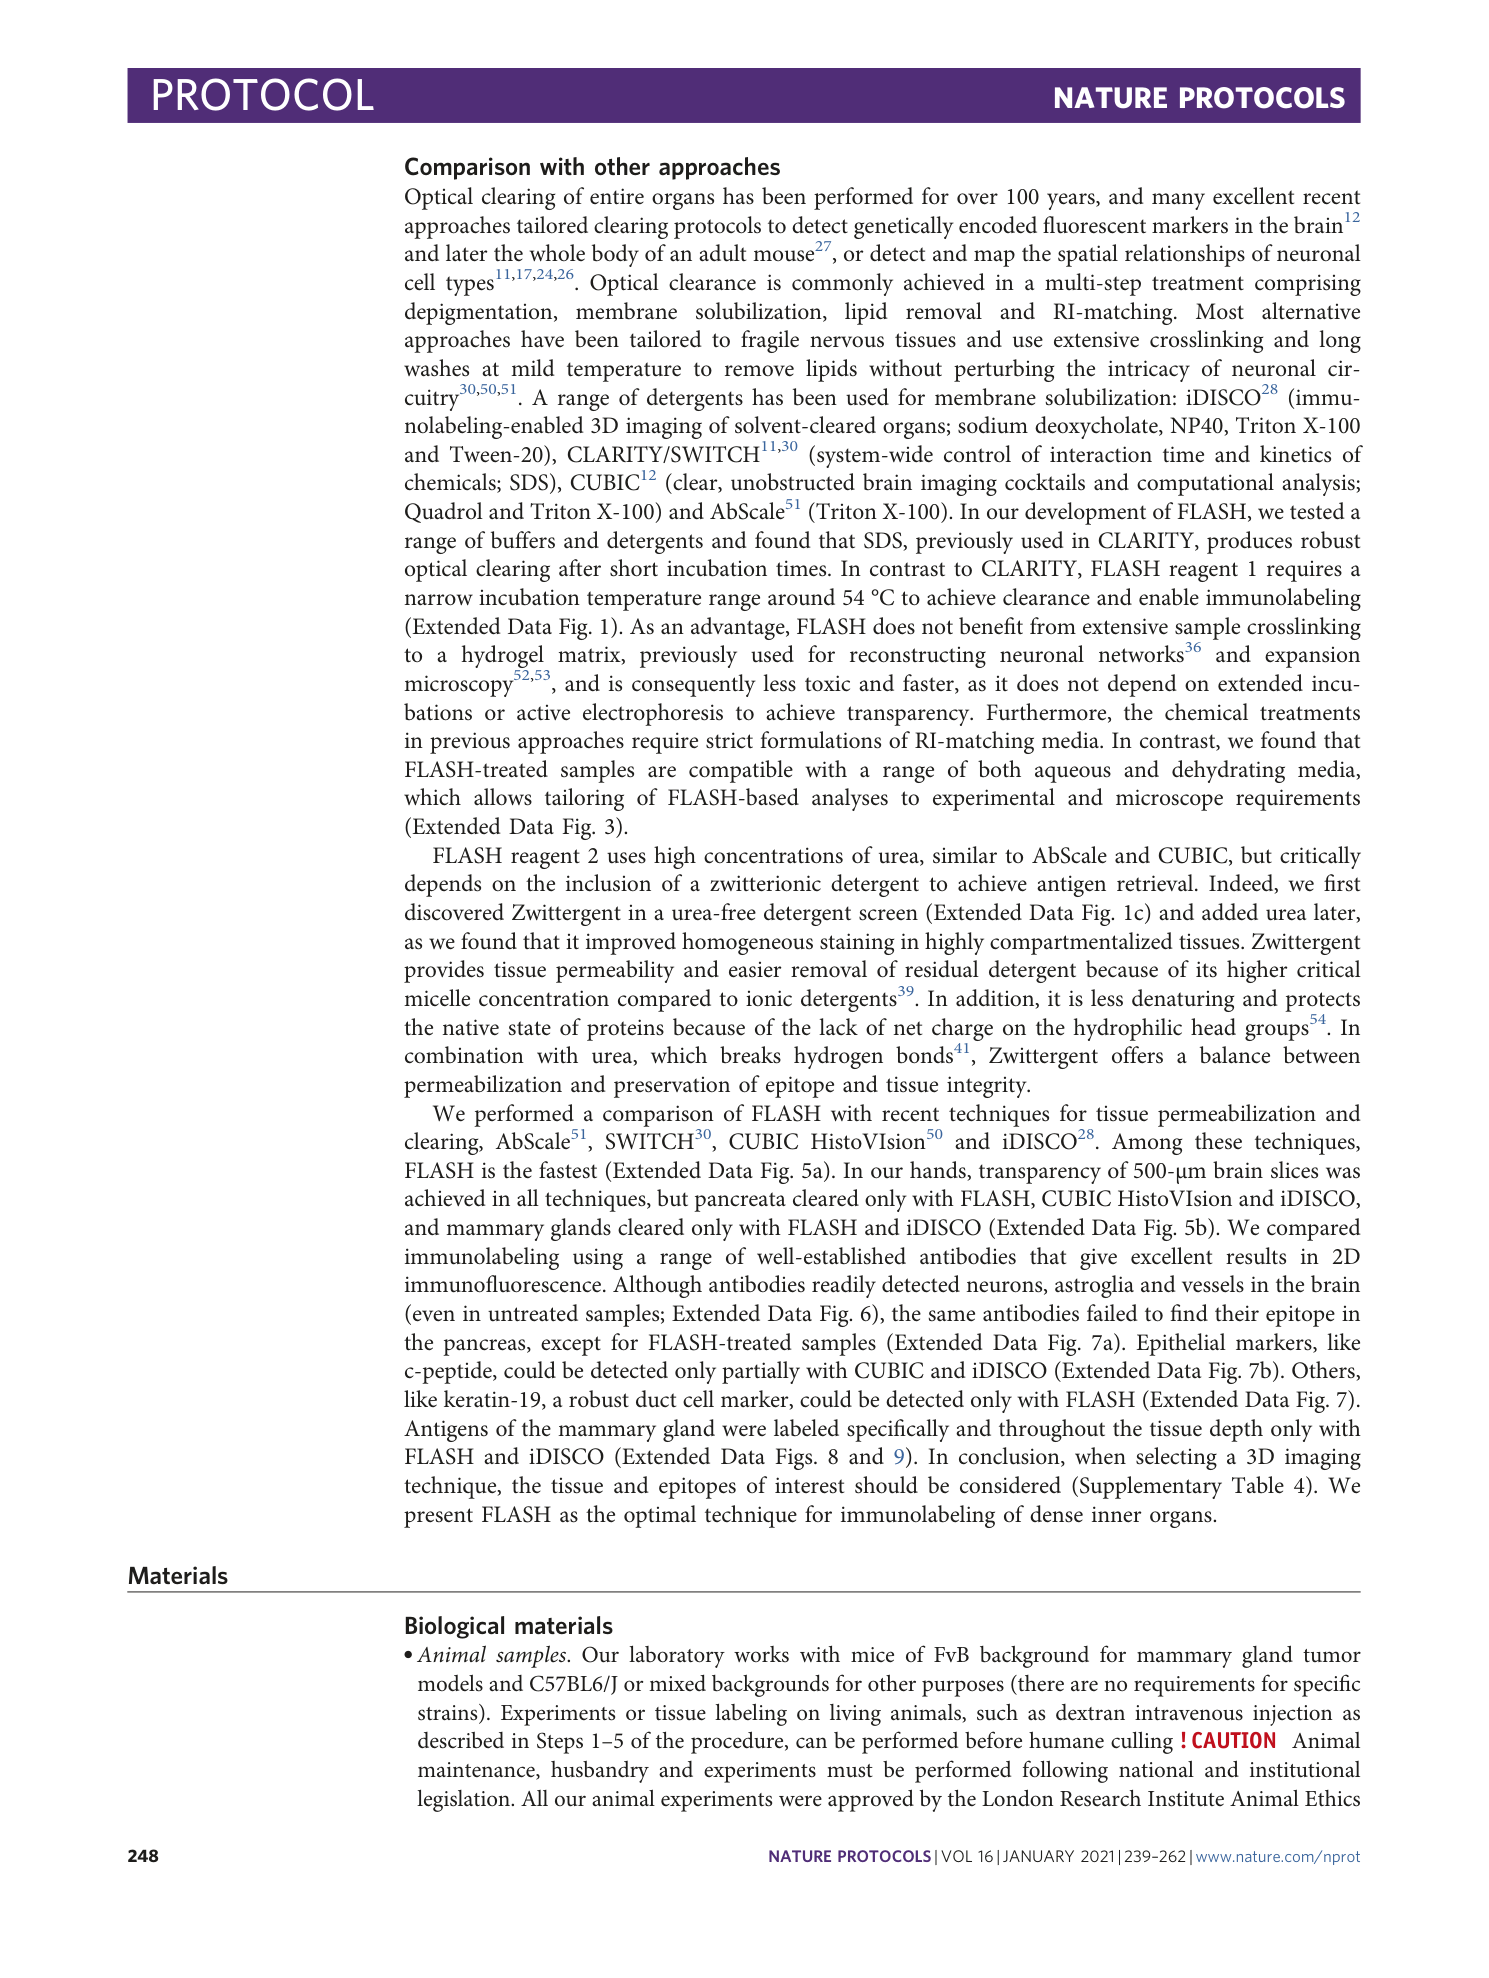
FLASH of wild-type and Cep55 −/− embryos. Light-sheet image of whole E13.5 wild-type and Cep55 −/− mouse embryos treated with FLASH reagent 2. Outline of entire embryo (autofluorescence, gray) and apoptotic cells (CC3, red). Images of the embryos in this video were included in a previous publication from our laboratory.
