Analysis of monomeric aromatic compounds in alkaline lignin-rich liquors via UHPLC-DAD
Gregg T. Beckham, Kelsey J. Ramirez, Stefan J. Haugen, Sean P. Woodworth, Morgan A. Ingraham, Davinia Salvachua
Disclaimer
This protocol is for research purposes only.
Abstract
An analysis method was developed to quantify aromatic compounds present in lignin-rich, alkaline pre-treated liquors produced from corn stover. This method employs ultra-high pressure liquid chromatography paired with diode array detection (UHPLC-DAD). A reverse phase Luna Omega PS C18 column from Phenomenex and a gradient were used to separate various aromatic compounds.
Before start
All solvents and chemicals used are listed in the ‘Materials’ section. These are excluded from in-line references to maintain clarity and keep the steps concise.
Steps
Preparation of standards
By weight, create individual 10 g/L stock standards of the following analytes using ethanol (EtOH) as a diluent:
- Protocatechuic acid
- Catechol
- 4-Hydroxybenzoic acid
- p-Coumaric acid
- Ferulic acid
- Vanillyl alcohol
- Vanillic acid
- 4-Hydroxybenzaldehyde
- Vanillin
Combine stock standards to make a 1 g/L aromatics mixed standard using EtOH as a diluent. A potential preparation can be made by adding 1 mL of each of the standards and 1 mL EtOH for an overall 10-fold dilution.
Create a calibration curve with a minimum of 5 points using ultrapure water (18.2MΩ⋅cm)(UPW) as a diluent.

Preparation of mobile phases
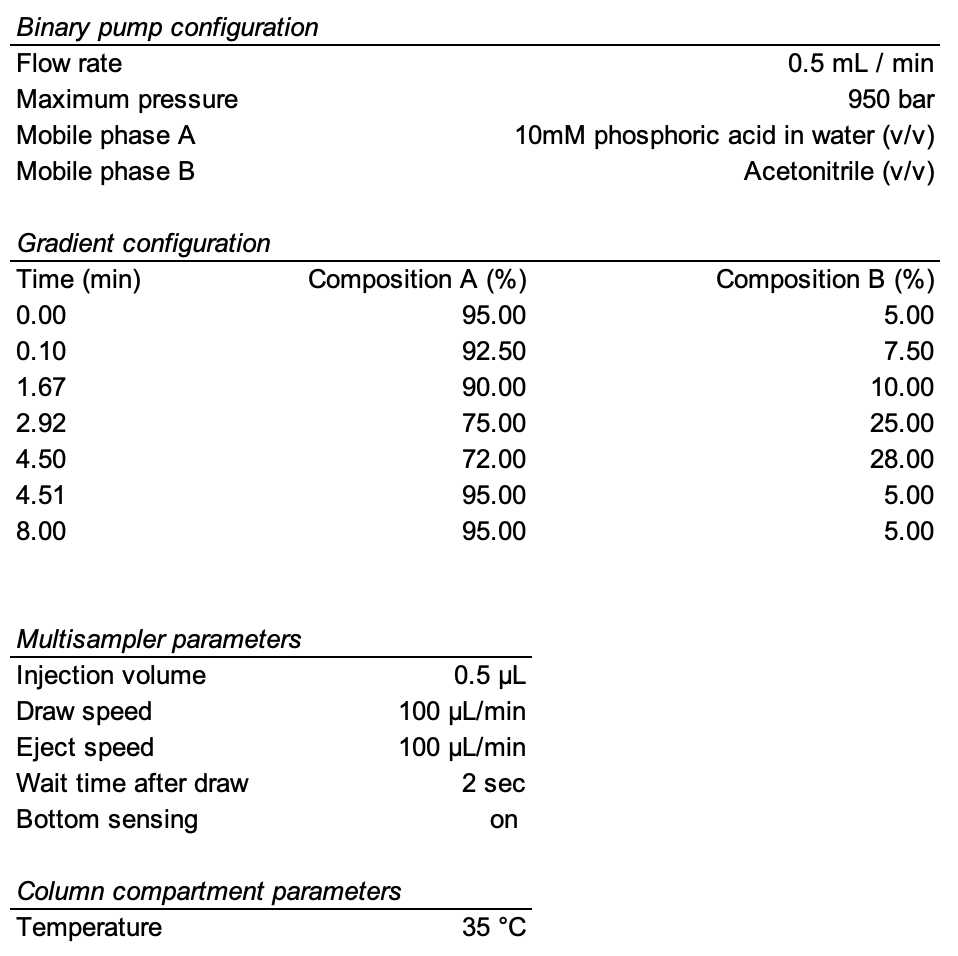
Mobile phase A consists of 10 mM phosphoric acid in UPW. This can be prepared by adding 0.67 mL of 85% (w/w) phosphoric acid per liter of UPW.
Mobile phase B was acetonitrile.
Sample preparation
Confirm that the sample matrix is compatible with instrumentation. The calibration range for this method is between 1.0 µg/mL and 500 µg/mL. Any samples with analyte concentrations expected to be greater than 500 µg/mL should be diluted appropriately to minimize the potential for carryover. Filter all samples through 0.2 µm filtered prior to injection.
UHPLC analysis
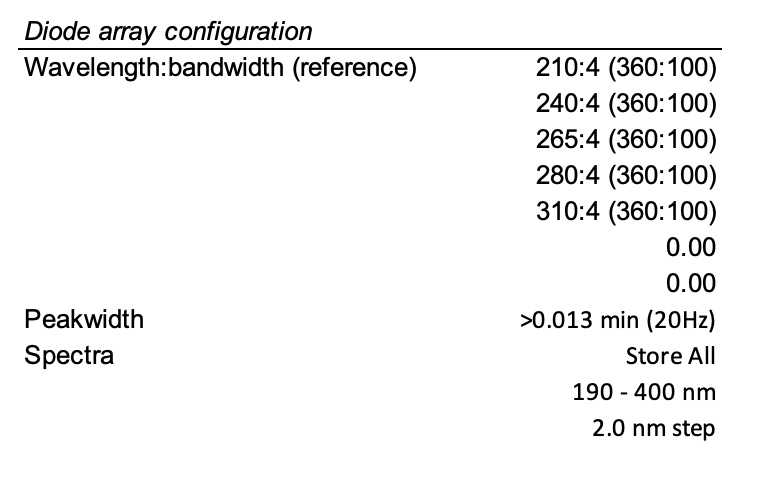
Analysis is completed on an Agilent 1290 UHPLC system utilizing the following parameters.


Analysis was completed utilizing wavelengths 265 nm and 280 nm. Quantitation of these aromatic compounds can be accomplished on multiple wavelengths. Discretion should be used in choosing the quantitative wavelength that produces the optimal response.
Data analysis and quality control
Data analysis was completed using Agilent OpenLab CDS ChemStation Edition Rev. C.01.10
The following criteria are employed to ensure reproducibility and stability throughout the analysis:
- All analyte calibration curves must have a correlation coefficient (r2) of greater than or equal to 0.995. A quadratic or linear fit may be applied with the origin ignored.
- A calibration verification standard (CVS) should be analyzed every 20 or fewer samples. This is a point from the calibration curve re-analyzed throughout the instrument run to check for drift. An acceptable recovery range for this method is +/- 10% of the expected concentration.


