MicroMPN: Software for Automating Most Probable Number Estimates from Laboratory Microplates
Karla Franco Meléndez, Adam R Rivers
software
Jupyter Notebook
MicroMPN
MPN
most probable number
microplates
Genomics and Bioinformatics Research Unit
NP301
microbes
microorganisms
viability
cell count estimation
microtiter plates
CRIS 6066-21310-005-00-D
Disclaimer
The mention of trade names or commercial products on this project is solely for the purpose of providing specific information and neither implies recommendation nor endorsement by the USDA.
Abstract
We developed a command-line Python package named "MicroMPN" to enable the automation of most probable number (MPN) value estimations from microplates of different formats and sample designs. In this protocol, we guide users on how to run MicroMPN from a Jupyter Notebook using simulated fluorescence data values. To run MicroMPN, the users must input two data files. Input file 1: the user provides a CSV file with the plate name, the well locations of each sample in a microplate, and the spectrofluorometric data. Input file 2: the user specifies the layout of a microplate with a Wellmap TOML-based format file. The second file contains the number of replicates, the dilution series, and the number of samples per plate. The Python package “wellmap” parses the information of a microplate from the TOML formatted file for downstream calculation of an MPN value. Additionally, users must specify a cutoff/threshold value, which is used to determine which wells are positive or negative for microbial growth. Output file: MicroMPN will calculate an MPN value, a bias-corrected MPN value, 95% confidence intervals, and a rarity index.
Before start
In this protocol we cover how to run MicroMPN from a Jupyter Notebook.
However, users that choose to run the package from a terminal can access MicroMPN through:
Github:
git clone git@github.com:USDA-ARS-GBRU/micrompn.git
cd micrompn
pip install .
PyPI:
pip install micrompn
docker:
docker pull ghcr.io/usda-ars-gbru/micrompn:main
Steps
Example of Input file 1: namefile.csv
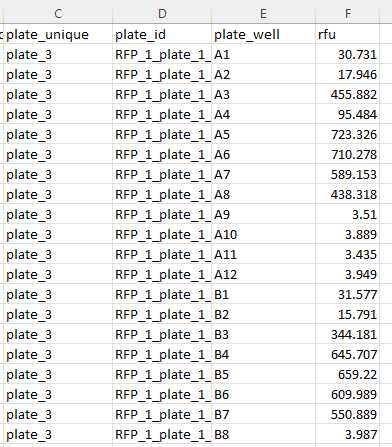
To run MicroMPN, users need an input CSV file with RFU data.
The column headers must include the following identifiers:
plate_unique
plate_well
rfu
***** *Additional column names in the input file will be ignored by MicroMPN.
As an example of a CSV file with relative fluorescence units (RFU) data, we provide users with input_protocols_io.csv. The input file provided contains RFU data in a 12 (dilution series) by 8 (replicates) microplate layout. In this microplate, column 1 has 8 replicates of resuspended soil sample. Columns 2 - 12, contain 10-fold serially diluted samples. Values correspond to spectrofluorometric measurements collected 48 h after incubating the plate.
Example of Input file 2: namefile.toml (namefile.txt)
To run MicroMPN, users need a second input file which specifies the layout of samples across a microplate. A Wellmap file can be created using a text editor (e.g., notepad). The format of the file is TOML-based.
[col]
1.dilution = 1e00
2.dilution = 1e-01
3.dilution = 1e-02
4.dilution = 1e-03
5.dilution = 1e-04
6.dilution = 1e-05
7.dilution = 1e-06
8.dilution = 1e-07
9.dilution = 1e-08
10.dilution = 1e-09
11.dilution = 1e-10
12.dilution = 1e-11
[row]
A.replicate = 1
B.replicate = 2
C.replicate = 3
D.replicate = 4
E.replicate = 5
F.replicate = 6
G.replicate = 7
H.replicate = 8
[block.12x8.‘A1’]
sample = 1
In this .toml file microplate.toml , each row (A – H) was assigned a replicate value (1 – 8), while each column (1 – 12) represented a particular dilution factor (1e00 – 1e-11). For this reason, each plate was divided into a single 12x8 sample block, although multiple sample blocks on a plate are possible. A .toml file can be opened with a text editor (e.g., notepad).
Example of how to run MicroMPN from a Jupyter Notebook
Step-by-step example on how to run the command-line tool MicroMPN from a Jupyter Notebook.
* To run micrompn from a Jupyter Notebook use the symbol "!" before micrompn; micrompn was designed to run from the command-line not from a Jupyter Notebook. To run micrompn from a Jupyter Notebook use the symbol "!" before micrompn; micrompn was designed to run from the command-line not from a Jupyter Notebook.
* For ease of documentation and a user-friendly interface, we used Jupyter Notebooks for MPN calculations. For more information on Jupyter Notebooks users are referred to (Jupyter Project Documentation). Jupyter Project Documentation).
*For information on how to install packages in a Jupyter Notebook visit Installing Python Packages from a Jupyter Notebook. Installing Python Packages from a Jupyter Notebook.
Outside of a notebook, clone or download the MicroMPN repository from GitHub (https://github.com/USDA-ARS-GBRU/micrompn). Extract files locally.

Launch a Jupyter Notebook from the Jupyter terminal or directly from the Anaconda Navigator.
Once it launches, your project directory will be displayed in your browser. Make sure the data files needed to run MicroMPN are in your project directory. Then create a new Python notebook in the same directory were all your files are located.
In a Jupyter Notebook code cell, install MicroMPN by running the following line of code:
! pip install C:\Users\location_of_extracted_files\micrompn-main\micrompn-main
* In our case, "! pip install" worked because both the shell terminal and kernel are using the same python executable. However, this is not always the case. This is explained in detail in Installing Python Packages from a Jupyter Notebook.
# Ignore this command when re-using the notebook.
Alternatively, users can install MicroMPN with the following lines of code:
import sys
print(sys.executable)
# Copy the output from "sys.executable", which should be the path to the Python executable active in the kernel.
# In a new code cell, run:
! {sys.executable output} -m pip install C:\Users\location_of_extracted_files\micrompn-main\micrompn-main
In a new code cell, import "micrompn" into the notebook.
import micrompn
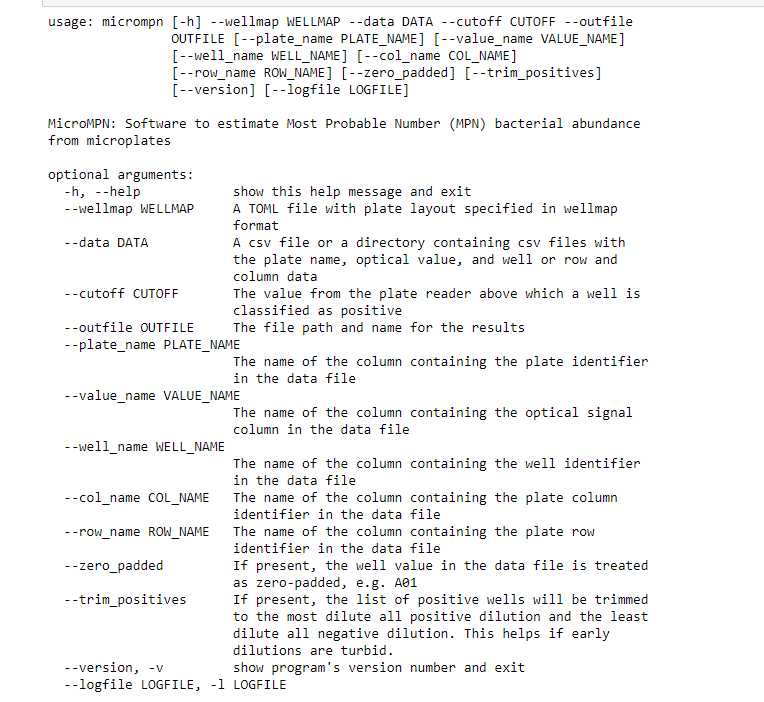
# Check proper installation by running:
! micrompn --help
# If installation was successful, user should see the following output:
To visualize the .toml or .txt file, run the following commands to first install "wellmap" and then import "wellmap" into the notebook:
! pip install wellmap #Ignore this command when re-using the notebook.
import wellmap
wellmap.show(microplate.toml)
<img src="https://static.yanyin.tech/literature_test/protocol_io_true/protocols.io.81wgbymenvpk/naf4b42rp8.jpg" alt="The Python package "wellmap", which is a dependency of "micrompn", will parse the data from the CSV file based on the .toml or .txt specifications. For more information on how to create a TOML formatted file with different plate layouts visit wellmap- File format for 96-well plate layouts." loading="lazy" title="The Python package "wellmap", which is a dependency of "micrompn", will parse the data from the CSV file based on the .toml or .txt specifications. For more information on how to create a TOML formatted file with different plate layouts visit wellmap- File format for 96-well plate layouts."/>
In a new code cell, run "micrompn".
# CSV file name: input_protocols_io.csv
# TOML file name: microplate.toml (it could also be a .txt file)
*Make sure the .csv and .toml files are located in the same directory as your Jupyter Notebook (nameofnotebook.ipynb).
# run the following code in a single line
! micrompn --wellmap microplate.toml --data "C:\location\of\CSV\file\input_protocols_io.csv"
--cutoff 6
--outfile "C:\location\of\CSV\output\file\output_protocols_io.csv"
--plate_name "plate_unique"
--value_name "rfu"
--well_name "plate_well"
--trim_positives
Example of output file output_protocols_io.csv.
| A | B | C | D | E | F | G | H |
|---|---|---|---|---|---|---|---|
| A | B | C | D | E | F | G | H |
| plate | sample | mpn | mpn_adj | upper | lower | rarity | |
| 0 | plate_3 | 3 | 7646785 | 6885935 | 18317578 | 3192197 | 0.63574 |
In our experimental setup, ~0.44g of soil were resuspended in 1 mL of volume. Then, 0.1 ml of soil resuspension were transferred to column 1 of a microplate. Since MPN estimated values are based on the volume of a sample used at each dilution step, we must adjust the MPN estimate for the difference in volume by multiplying by 10. The original sample volume in column 1 of our microplate example was 0.1 mL, therefore the concentration of bacteria is MPN/0.1 mL. This is equivalent to a correction of 10 x MPN/1 mL. We would further normalize the MPN estimate by the average mass of soil per well in order to convert MPN/mL to MPN/g. Finally, prior to any statistical analysis, log10 transform MPN values.Users can avoid this type of correction, if desired, by adjusting the dilution factors to account for the initial volume of soil resuspension.
Additional resources
We provide users with 96-wells and 384-wells microplate layouts, input files with mock RFU data, MicroMPN output files, and copies of our Jupyter Notebooks in html format.
Microplate layout: microplate_96_3_samples_vertical_dilutions.txt
96-well plate
3 samples
4 replicates
8 vertical dilutions
input: 96_3_samples_vertical_dilutions.csv
Microplate layout: microplate_96_2_samples_vertical_dilutions.txt
96-well plate
2 samples
6 replicates
8 vertical dilutions
input: 96_2_samples_vertical_dilutions.csv
output: OUTFILE_96_2_samples_vertical_dilutions.csv
Microplate layout: microplate_96_2_samples_horizontal_dilutions.txt
96-well plate
2 samples
4 replicates
12 horizontal dilutions
input: 96_2_samples_horizontal_dilutions.csv
Microplate layout: microplate_384_4_samples_horizontal_dilutions.txt
384-well plate
4 samples
8 replicates
12 horizontal dilutions
input: 384_4_samples_horizontal_dilutions.csv
Microplate layout: microplate_384_6_samples_vertical_dilutions.txt
384-well plate
6 samples
8 replicates
8 vertical dilutions
input: 384_6_samples_vertical_dilutions.csv
