Bioinformatics Protocol for Investigating Novel Biomarkers, Conducting Statistical Analysis, and Exploring Molecular Pathways: A Unified Approach for Alzheimer's Disease
Vidya Niranjan, Adarsh V, Shreya Satyanarayan Bhat, Spoorthi Anil Bandikatte
Abstract
This protocol paper presents a comprehensive bioinformatics approach aimed at identifying novel biomarkers associated with Alzheimer's disease (AD) using RNA sequencing (RNA-seq) datasets obtained from the Gene Expression Omnibus (GEO) database. Alzheimer's disease is a complex neurodegenerative disorder characterized by progressive cognitive decline, and identifying biomarkers is crucial for early diagnosis and therapeutic intervention. Leveraging bioinformatics tools and methods, this protocol outlines a step-by-step procedure for analyzing RNA-seq data to uncover potential biomarkers. The protocol includes data collection from the GEO database, quality control assessment, differential expression analysis, functional annotation, pathway enrichment analysis, and molecular pathway identification. Statistical analysis is applied throughout the protocol to ensure the robustness and reliability of the results. By following this protocol, researchers can systematically identify and validate novel biomarkers associated with Alzheimer's disease, ultimately contributing to a better understanding of its underlying molecular mechanisms and facilitating the development of targeted therapeutic interventions.
Steps
Identification of RNA-Seq Dataset
The RNA-Seq dataset utilized in this study was sourced from the European Nucleotide Archive (ENA) browser, specifically accession number GSE138853. This dataset was selected due to its relevance to Alzheimer's disease research and its availability through the ENA browser.
Retrieval of Samples
Raw sequencing samples were downloaded in FASTQ format, containing nucleotide sequences and quality scores for each read. This standardized format enables comprehensive bioinformatics analysis, including quality control and differential expression analysis.
Upon selecting the desired dataset, proceed to download the raw sequencing samples associated with it. The samples were retrieved directly from the ENA browser interface, providing access to the original sequencing data generated for the study. Each sample corresponds to a specific biological sample (e.g., tissue sample) that underwent RNA sequencing to generate transcriptomic data. The raw sequencing samples were downloaded in their original format, typically stored as FASTQ files. FASTQ is a standard file format used to represent raw sequencing data, containing both nucleotide sequences and quality scores for each sequenced read.
#Download samples (linux 20.4)
wget ftp://ftp.sra.ebi.ac.uk/vol1/srr/SRR102/012/SRR10278812
Quality Check using FASTQC
The quality assessment of the 32 samples using the FASTQC tool. FASTQC is a widely used tool for the initial assessment of raw sequencing data quality.
#quality checking using FASTQC (LINUX 20.4)
fastqc reads.fastq.gz
Conversion of BAM Files to SAM Files Using Samtools
This section outlines the comprehensive conversion of BAM files to SAM files utilizing Samtools. SAM files provide a human-readable representation of sequence alignment data, facilitating downstream analysis and interpretation.
# conversion from BAM to SAM format  (linux 20.4)
samtools view -h -o output.sam input.bam
#Sorting BAM File (linux 20.4)
samtools sort -@ 4 24.bam -o 24_sorted.bam
Alignment
All 32 RNA-Seq samples were aligned to the human reference genome obtained from the National Center for Biotechnology Information (NCBI). The alignment was performed using HISAT2, a widely used alignment tool known for its efficiency and accuracy in mapping sequencing reads to a reference genome.
#Alignment command (Linux 20.4)
hisat2 -x human_reference_genome_index -U sample.fastq.gz -S sample_aligned.sam
Generation of feature Count
The generation of feature counts using the FeatureCounts tool. FeatureCounts is a widely used tool for counting the number of reads mapped to genomic features, such as genes, transcripts, or exons, based on the alignment results obtained from aligning RNA-Seq reads to a reference genome. The annotation file used for feature counting was obtained from the National Center for Biotechnology Information (NCBI) Genome database. This file provides genomic annotations, including the locations and characteristics of genes, transcripts, and other genomic features, necessary for accurately assigning reads to features during the counting process.
#FeatureCounts Commands
featureCounts -a human_annotation_file.gtf -o counts.txt sample_aligned.sam
Differential gene expression analysis
We performed differential gene expression (DGE) analysis for all 32 samples using the DESeq2 package. DESeq2 is a widely used tool in bioinformatics for identifying genes that are differentially expressed between experimental conditions or sample groups based on RNA-Seq data. It employs a negative binomial distribution model to accommodate variability in sequencing depth and biological variability across samples. DESeq2 conducts normalization, estimation of dispersion, and statistical testing to identify genes that exhibit significant differences in expression levels between conditions. This approach enables researchers to gain insights into the molecular mechanisms underlying biological processes and diseases by identifying genes that are actively involved in specific conditions or experimental treatments.
#Dseq2 Commands (windows 11)
# Load count data
count_data <- read.csv('count.csv', header = TRUE, row.names = 1)

# Filter low-count genes
count_data <- count_data[rowSums(count_data[, c('SRR15039666', 'SRR15039668', 'SRR22702939','SRR22702940','SRR22702946','SRR22702961','SRR22801652','SRR22801654')]) > 50, ]

# Define experimental conditions
condition <- factor(c("AD", "AD", ..., "H"))

# Create a data frame with sample IDs and conditions
coldata <- data.frame(row.names = colnames(count_data), condition)

# Remove rows with missing values
count_data_clean <- count_data[complete.cases(count_data), ]

# Create DESeq2 object
dds <- DESeqDataSetFromMatrix(countData = count_data_clean, colData = coldata, design = ~condition)

# Perform differential expression analysis
dds <- DESeq(dds)

# Transform count data
vsdata <- vst(dds, blind = FALSE)

# Generate PCA plot
plotPCA(vsdata, intgroup = "condition")

# Plot dispersion estimates
plotDispEsts(dds)

# Extract differential expression results
res <- results(dds, contrast = c("condition", "C", "H"))

# Filter significant results
sigs <- na.omit(res)
sigs <- sigs[sigs$padj < 0.05, ]

# Print significant results
sigs

# Extract expression matrix of significant genes
sig_expr_matrix <- assay(dds)[rownames(sigs), ]

# Log2 transform expression matrix
log_sig_expr_matrix <- log2(sig_expr_matrix + 1)

# Generate heatmap
heatmap <- pheatmap(log_sig_expr_matrix, cluster_rows = TRUE, cluster_cols = TRUE, color = colorRampPalette(c("blue", "white", "red"))(100))

# Save heatmap as TIFF file
tiff("heatmap.tiff", width = 10, height = 10, units = "in", res = 600)
print(heatmap)
dev.off()

# Plot MA plot
plotMA(res)

# Generate volcano plot
volcano_plot <- ggplot(res, aes(x = log2FoldChange, y = -log10(padj))) +
    geom_point(aes(color = ifelse(padj < 0.05, "Significant", "Not significant")), size = 2, alpha = 0.8) +
    scale_color_manual(values = c("Significant" = "red", "Not significant" = "gray")) +
    labs(title = "Volcano Plot", x = "Log2 Fold Change", y = "log10(p-value)") +
    theme_minimal() +
    theme(
        plot.margin = margin(20, 20, 20, 20),
        axis.text.x = element_text(size = 10),
        axis.text.y = element_text(size = 10),
        legend.position = "bottom",
        legend.direction = "vertical",
        legend.box = "vertical",
        legend.margin = margin(t = 20, r = 20, b = 0.5, l = 20, unit = "pt")
    )

# Display volcano plot
print(volcano_plot)
Gene ontology
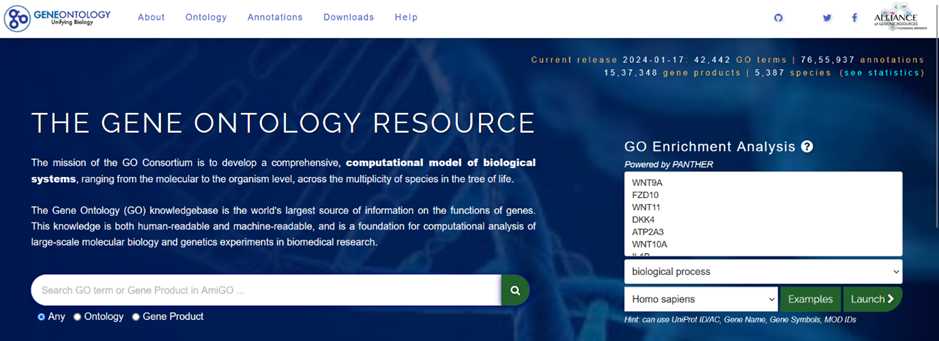
In this section, we utilized the Gene Ontology (GO) database to perform a functional analysis of the differentially expressed genes identified in the RNA-Seq analysis. GO is a widely used bioinformatics resource that categorizes genes into defined terms based on their molecular functions, biological processes, and cellular components, providing valuable insights into the biological roles of genes. Gene Ontology (GO) helps us understand gene functions. It covers Biological Processes: Genes’ roles in cell division, metabolism, development, and immune response. Molecular Functions: Specific activities at
the molecular level (e.g., enzyme catalysis, binding). Cellular Components, Where gene products operate within cells (nucleus, mitochondria, etc.). The image shows the Gene Ontology website, where researchers input gene IDs to explore these aspects.
 biological
process analysis, highlighting processes such as response to stimulus and cell
differentiation. Each process is linked to statistical values that signify its
significance. This image provides valuable insights into the biological
functions influenced by a specific set of query genes, laying the groundwork
for understanding their roles within an organism.")

molecular function analysis based on query genes. It highlights specific
molecular activities associated with statistical significance, providing
insights into the functional roles of these genes at the molecular.")

cellular component analysis based on query genes. It highlights specific
cellular locations associated with statistical significance, providing insights
into where these genes operate within cells.")
Pathway Analysis using KEGG MAPPER
Utilization of the KEGG (Kyoto Encyclopedia of Genes and Genomes) database and its pathway analysis tool to investigate the functional significance of the differentially expressed genes identified in our study. KEGG is a comprehensive database that provides information on biological pathways, networks, diseases, and drugs, allowing researchers to elucidate the molecular mechanisms underlying complex biological processes. the list of differentially expressed genes obtained from our analysis as input for the KEGG pathway analysis. KEGG Mapper enables the visualization and interpretation of biological pathways enriched with differentially expressed genes, providing insights into the biological processes and signaling pathways that are dysregulated under specific experimental conditions.
")
. Each pathway represents a specific biological process, cellular signaling pathway, or disease mechanism that is enriched with the input gene IDs. Key pathways that are significantly enriched with input gene IDs are identified, highlighting their importance in driving the observed changes in gene expression. These key pathways serve as focal points for further investigation into the molecular mechanisms underlying specific biological processes or disease pathways.")
Enrichment and Statistical analysis of overexpressing genes
We utilized ShinyGO 0.8.0 to perform enrichment analysis of the input gene list obtained from our study. ShinyGO employs statistical algorithms to identify GO terms that are significantly enriched with the input genes compared to what would be expected by chance. This analysis enables the functional annotation of gene sets and helps uncover the biological themes and pathways represented by the input genes. considering factors such as gene count, background gene set, and false discovery rate (FDR) correction.
In the ShinyGO interface, users are provided with a text box or file upload option to input their list of gene identifiers. These gene identifiers can be in various formats, such as Entrez Gene IDs, Ensembl IDs, or gene symbols. Users can either manually enter the gene IDs or upload a file containing the list of gene IDs obtained from their study.
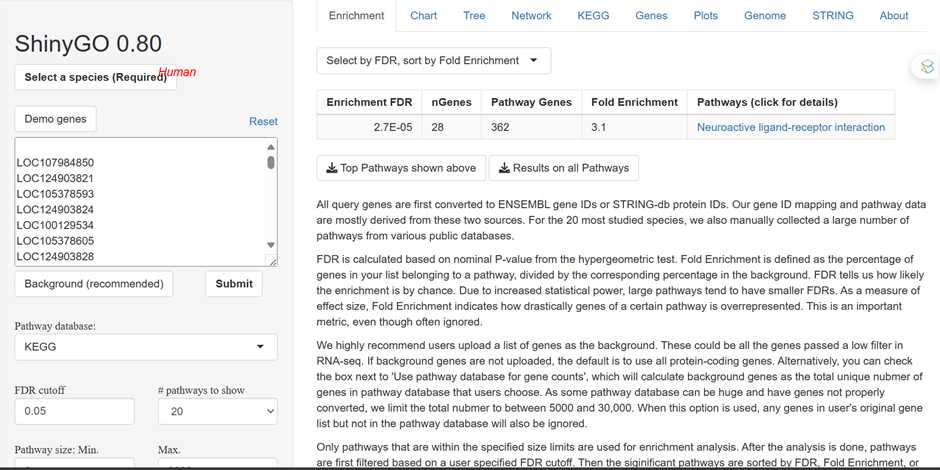
Upon performing enrichment analysis using ShinyGO, users receive a comprehensive summary of enriched Gene Ontology (GO) terms associated with the input gene list. The enrichment results provide valuable insights into the functional significance of the input genes by identifying overrepresented biological processes, molecular functions, and cellular components.
ShinyGO presents a list of enriched GO terms, categorized into biological processes, molecular functions, and cellular components. Each GO term is accompanied by statistical metrics indicating its significance level, such as p-values or false discovery rates (FDR).

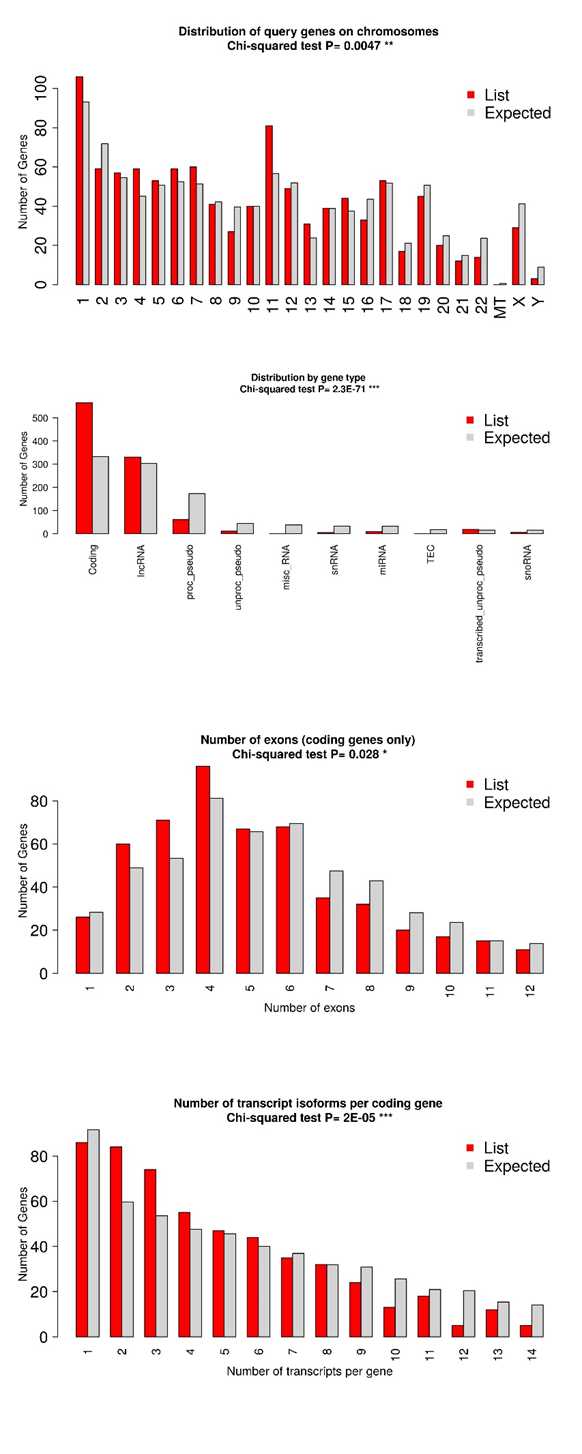
The chi-squared test assesses the association between categorical variables, such as gene annotations or GO terms, comparing the observed distribution of these characteristics among your genes with the expected distribution based on the entire genome. If the chi-squared test yields a low p-value, typically below 0.05, it indicates a significant difference in the distribution of gene characteristics between your genes and the rest of the genome. Similarly, Student's t-test compares the means of quantitative variables, such as gene expression levels or numerical gene features, between your genes and the broader genome. A low p-value from the t-test suggests a significant difference in the mean values of gene characteristics between your genes and the rest of the genome. Overall, if both tests yield low p-values, it suggests that your genes possess special characteristics, such as enrichment for specific annotations or unique expression patterns, distinguishing them from the general population of genes in the genome and potentially indicating their distinct biological roles.
PPI Network Construction
The PPI network construction and hub genes analysis using ShinyGO provide valuable insights into the molecular mechanisms underlying the observed upregulation of genes, helping to elucidate key regulatory pathways and potential therapeutic targets in the studied biological system.The top-upregulated genes are inputted into the platform to construct a PPI network. ShinyGO utilizes existing databases and algorithms to predict protein-protein interactions based on known protein interactions, protein domains, or functional annotations. The resulting PPI network represents the interconnectedness between the proteins encoded by the top-upregulated genes, highlighting potential functional relationships and pathways involved.
 network visualized using ShinyGO depicts the interactions among proteins encoded by the top upregulated genes identified from differential expression analysis. Each node represents a protein, with node size indicating its degree of connectivity. Edges between nodes represent predicted or known interactions, with thicker lines indicating stronger interactions. Hub proteins, characterized by high connectivity, are highlighted within the network. Functional annotations or enriched pathways associated with the proteins are overlaid onto the network, providing insights into the biological processes or molecular functions represented.")
Chromosomal enrichment
The chromosomal positions of genes are visualized using ShinyGO. Genes are represented as red dots on the chromosomes, providing a spatial overview of their distribution across the genome. Purple lines highlight regions where these genes exhibit statistically significant enrichment compared to the background gene density.
The genome is scanned using a sliding window approach, with each window subdivided into equal-sized steps for sliding. Within each window, a hypergeometric test is employed to assess whether the genes are significantly overrepresented. Essentially, the genes within each window define a gene set or pathway, and enrichment analysis is conducted to identify statistically enriched regions.
Please note that the chromosomes may only be partially shown, as the last gene's location is utilized to draw the line. This analysis offers insights into the genomic localization and enrichment patterns of the genes, shedding light on potential chromosomal hotspots or regions associated with specific biological processes or pathways.

EXPECTED OUTCOME OF THE PIPELINE
The expected outcome of the study is the comprehensive characterization of top-upregulated genes in Alzheimer's disease, elucidating their roles through gene ontology (GO) analysis, pathway enrichment, and disease intervention pathways. Through rigorous statistical analysis utilizing the tools employed above, the study aims to identify novel genes associated with Alzheimer's disease pathology. The resulting document will provide detailed functional information on these novel biomarkers, shedding light on their involvement in disease mechanisms and offering insights for potential therapeutic interventions.
Retrieval of Samples

